 Open Access Article
A novel strategy for the characterization of glaucocalyxin A metabolites in vivo and in vitro by UHPLC-Q-TOF-MS based on DDA and DIA data acquisitions
Wenjing Suna,
Yiran Jinb,
Shuai Guanb,
Mengxin Yanga,
Miaoting Zhanga,
Jiali Houa and
Yingfeng Du *a
*a
aDepartment of Pharmaceutical Analysis, School of Pharmacy, Hebei Medical University, 361 East Zhongshan Road, Shijiazhuang, Hebei 050017, P. R. China. E-mail: yingfengdu@126.com; Fax: +86-311-86266419; Tel: +86-311-86265625
bThe Second Hospital of Hebei Medical University, Shijiazhuang, Hebei 050000, P. R. China
First published on 11th March 2020
Abstract
Glaucocalyxin A (GLA) belongs to the natural ent-kauranoid diterpenoids family with antitumor, antifibrotic, anticoagulative, antioxidant, and anti-AD effects. In this study, ultra-high-performance liquid chromatography coupled to quadrupole time-of-flight mass spectrometry (UHPLC-Q-TOF-MS) system was applied to observe probable metabolites of GLA in vitro and in vivo firstly. The mass data were respectively obtained by two typical acquisition methods, ‘data-dependent acquisition’ (DDA) and ‘data-independent acquisition’ (DIA) modes. The combinations can not only guarantee sensitivity but also capture more precursor ions and MS/MS spectra. Then, multiple data processing techniques were applied to hunt metabolites rapidly. As a result, 32 phase I metabolites of different structures and 6 phase II metabolites were identified, including 25, 18, 17 and 7 in rat urine, feces, bile, and plasma, respectively. Besides, under the action of rat intestinal flora (RIF), 7 metabolites were detected. In the study, the main bio-transformations were oxidation and demethylation. Conjugation with methylation, sulfate, and glucuronide produced phase II metabolites. This study laid the foundation for the further study of the pharmacological effects of GLA and was conducive to mechanism research.
1. Introduction
Rabdosia japonica has been extensively used as an oriental medicine and dietary supplement in Asia.1 For thousands of years, it has been used for the treatment of gastrointestinal floral infections.2–4 Glaucocalyxin A (GLA), an ent-kauranoid diterpenoid, derives from the Rabdosia japonica plant. Diterpenoids, triterpenoids, and flavonoids are the main components of the herb.5 Moreover, GLA is the most active diterpenoid, acting as a quality index of this herb.2 Nowadays, GLA has aroused widespread concern by scientists in various fields due to its multiple antitumor,6–10 antifibrotic,11 anticoagulative,12 antioxidant,13 and anti-AD effects.14The absorbance and elimination of GLA in rats were fast after oral administration (Tmax = 0.750 ± 0.224 h, t1/2 = 1.11 ± 0.17 h).2 The excretion of GLA amounted to 23.8%, 12.8% and 35.68% in feces, urine, and bile within 12 h respectively.15 These results indicated that GLA was fast metabolized and excreted mainly as metabolites. To our knowledge, only eight metabolites and three metabolite transformation types of GLA were identified in rat bile and rat liver microsome by HPLC-MS-ESI. And there was few systematic summary of metabolic profiles.16
Some transformations of Traditional Chinese Medicine (TCM) orally administered were under the action of intestinal flora in the gastrointestinal tract. Accordingly, in exoteric metabolite research, intestinal flora has been extensively used.17,18 Besides, scientists usually predict the metabolic profile in humans by microbial transformation.19
Although ultra-high-performance liquid chromatography coupled to quadrupole time of flight mass spectrometry (UHPLC-Q-TOF-MS) has played an essential role in qualitative studies with higher sensitivity and accuracy, excavation trace metabolites in complex biological matrices were still facing huge challenges. Feature fragments provided by the mass spectrometer is vital for judging metabolite elemental composition and inferring structure. Generally speaking, the hit rate and quality of the MS/MS spectrum are the key information for identifying metabolites. The MS information was obtained by full scan, while available MS/MS spectrum acquisition techniques in LC/MS can roughly be divided into two categories: data-dependent acquisition (DDA) and data-independent acquisition (DIA). In order to obtain the MS/MS spectrum of as many metabolites as possible, we innovatively combined the two methods in this experiment.
The DDA method is also called the IDA method in some literature. When using the DDA method, the criteria and the mass defect filtering (MDF) filter templates must be pre-set. The occurrence of the MS/MS spectrum is dependent on the preset criteria to a great extent. Despite its ability to obtain a high-quality MS/MS spectrum, there are many defects such as exploring the template setup method, understanding the metabolic transformation theory, and setting a reasonable level. A high-quality MS/MS spectrum of a target compound cannot be obtained unless its amount exceeds the preset criteria. Given the above reasons, the hit rates of the MS/MS spectrum in the DDA method are lower but the quality is high.
SWATH (sequential window acquisition of all theoretical fragment ion spectra) is a commonly used DIA technique in AB Sciex. The DIA method does not need to set thresholds in advance. All signals enter the collision chamber in turn to obtain the MS/MS spectrum. Therefore, it can sequentially acquire the MS/MS spectrum of whole precursor ions, which greatly increases the hit rate of the MS/MS spectrum of trace substances. However, it is a disadvantage that the missing preselection may result in impure mass spectra, which may be difficult to identify and lead to a decreasing sensitivity.20 Therefore, the combination of the above two methods will increase not only the quality of the MS/MS spectrum but also the hit rate of trace metabolites. Therefore, it could increase the number of metabolites identified and enrich metabolic profile.
In this study, a practical method combined with DDA and DIA acquisitions was established and developed to identify metabolites of GLA in vivo and in vitro by UHPLC-Q-TOF-MS for the first time. Besides, we compared these two data acquisitions to demonstrate the advantages. Finally, the rapid UPLC-Q-TOF-MS based on multiple data processing technologies was successfully employed to expound metabolites and metabolic profile of GLA.
2. Experiments
2.1 Reagents and materials
GLA (purity ≥ 98%) was purchased from Weikeqi Chemical Industry (Sichuan, China). HPLC-grade formic acid and acetonitrile were both purchased from Fisher (NJ, USA), and ultra-pure water was purchased from Wahaha Corporation (Hangzhou, China). L-Cysteine, L-ascorbic acid, CMC-Na, MgCl2, K2HPO4, KH2PO4, NaCl, (NH4)2SO4, CaCl2, MgSO4, and Na2CO3 were from Beijing AoBoXing Biotech Co., Ltd. (Beijing, China).2.2 Instrumentation and analytical conditions
Chromatographic separation was performed on a Shimadzu (Kyoto, Japan) UPLC instrument including a binary solvent delivery system (LC-30AD), an auto sampler (SIL-30AC), and a column oven (CTO-30A). The chromatographic system was performed on a Phenomenex Luna C18 (2.6 μm, 100 mm × 3.0 mm) attached to a guard column and the column temperature was maintained at 25 °C. The mobile phase consisted of water (A) and acetonitrile (B). Both solutions were supplemented with 0.1% formic acid. Linear gradient elution was set as the procedure: 0–20 min, 18–38% B; 20–23 min, 38–45% B; 23–28 min, 45–65% B; 28–31 min, 65–90% B, 31–35 min, 90% B. The initial proportional concentration maintained for 10 minutes before the next sample was collected. The injection volume was 3 μL and the flow rate was 0.4 mL min−1.Besides, mass spectrometry was executed on a Triple TOF™ 5600+ system with Duo-Spray™ ion sources operating in the negative electrospray ionization (ESI) mode. Analyst® TF 1.7 software was used to control the instrument and for data acquisition.
The specific parameters of MS and MS/MS were listed in Table 1, and these two modes have similarities and differences.21 All samples were detected with electrospray ionization (ESI) source in negative ionization mode. Besides, a superb calibration delivery system (CDS) was used to automatically check the MS and MS/MS during the acquisition time.
| DDA (negative) | DIA (negative) | ||
|---|---|---|---|
| Different parameters | Accumulation time of MS (ms) | 200 | 430 |
| Accumulation time of MS/MS (ms) | 100 | 60 | |
| The number of isolation windows | 0 | 28 | |
| The wide of isolation windows (Da) | 0 | 26 | |
| The cycle time (s) | 1.0499 | 1.2973 | |
| The cycles | 1772 | 1434 | |
| Common parameters | Declustering potential (eV) | −60 | −60 |
| Collision energy of MS/MS (eV) | −35 | −35 | |
| Collision energy spread (eV) | −15 | −15 | |
| Mass of TOF (Da) | 100–800 | 100–800 | |
| Mass of MS/MS (Da) | 60–800 | 60–800 | |
| Ion spray voltage floating (V) | −4500 | −4500 | |
| Nebulizing gas (psi) | 55 | 55 | |
| Heater gas (psi) | 55 | 55 | |
| Curtain gas (psi) | 35 | 35 | |
| Turbo spray temperature (°C) | 550 | 550 | |
| Mass acquisition time (min) | 30 | 30 |
2.3 Metabolism of GLA by rat intestinal flora (RIF) in vitro22,23
![[thin space (1/6-em)]](https://www.rsc.org/images/entities/char_2009.gif) 000 rpm for 10 min. Nitrogen was used to evaporate the supernatant. The residue was dissolved in 200 μL mobile phase and filtered with the organic membrane of 0.22 μm. Finally, the filtrate was transferred to a sample vial to run an analysis.
000 rpm for 10 min. Nitrogen was used to evaporate the supernatant. The residue was dissolved in 200 μL mobile phase and filtered with the organic membrane of 0.22 μm. Finally, the filtrate was transferred to a sample vial to run an analysis.At the same time, there were two control groups: blank B (100 μL methanol in culture medium fluid) and blank C (100 μL GLA in anaerobic medium fluid), see Fig. 3.
2.4 Metabolism of GLA in vivo
The rats were randomly divided into six groups with six rats in each group. Group 1, 3, and 5 were blank groups. Group 2, 4, and 6 were experimental groups. A single dose of GLA (suspended in 0.5% CMC-Na) was 10 mg kg−1.25 The rats of the blank groups were given 0.5% CMC-Na. Considering that many drugs are metabolized within 24 hours, our biological samples covered at least 24 h.26
Rats in groups 1 & 2 were held in metabolic cages to collect the urine and feces samples within 72 h. Rats in groups 3 & 4 were to collect bile under anesthesia within 24 h. The tubes used to collect urine, feces, and bile were placed in an ice bath, samples were collected as timely as possible. Rats in groups 5 & 6 were collected blood samples from the orbital vein of the rats with heparinized tubes at 0.25, 0.5, 0.75, 1, 2, 4, 8, 12 and 24 h after dosing.2 Then all the blood samples were immediately centrifuged at 4500 rpm for 10 min under 4 °C to obtain plasma. The same biological sample was mixed and then stored at −80 °C.
![[thin space (1/6-em)]](https://www.rsc.org/images/entities/char_2009.gif) 000 rpm for 10 min.
000 rpm for 10 min.Six-fold (volume) ethyl acetate was added to lyophilized feces samples. The samples were vortexed, centrifuged, and took the supernatant, repeated 3 times. The supernatant was evaporated to dryness.
Besides, ten milliliters of urine and 3-fold ethyl acetate were vortexed for 10 min. Before the supernatant was evaporated to dryness under N2, it was centrifuged at 15![[thin space (1/6-em)]](https://www.rsc.org/images/entities/char_2009.gif) 000 rpm for 10 min.
000 rpm for 10 min.
The residue was dissolved in 200 μL mobile phase. Finally, the filtrate was transferred to a sample vial to run the analysis.
2.5 Analytical strategy and metabolite analysis27–30
The research strategy consisted of four steps: (1) on-line data were respectively acquired by both DDA and DIA mode. (2) These two sets of raw data were processed separately. Multiple post-data-processing technologies can eliminate hybrid spectra and detect metabolites rapidly.As is known that DIA has high hit rates of the MS/MS spectrum compared to the DDA method. Combined with Principal Component Variable Grouping (PCVG) filtering in the MetabolitePilot™ post-processing software, the quality of the MS/MS spectrum could be greatly improved. KPIs technique, as an assistant tool in MasterView™1.1 software, could also detect metabolites with similar structures. In general, compounds that showed the same mother nucleus could exhibit similar fragmentation behaviors in collision induced dissociation mode due to their identical skeleton. Thus they can generate certain common fragments, namely key product ions (KPIs). The KPIs were preliminarily constructed by summarizing the mass fragmentation rules of the GLA. We set fragment ions at m/z 149.0594, 123.0450, 97.0670 as KPIs, because they were major and stable fragment ions. Given the most metabolites own the skeleton of their corresponding parent compounds, KPIs could be also used for the rapid detection and identification of the prototypes and their corresponding metabolites. With the assistant tool in MasterView™, we use KPIs as screening indicators. In this way, we can quickly target metabolites. Besides, other data mining methods including fragment ion filter (PIF), extract ion chromatogram (EIC), neutral loss filter (NLF), and mass defect filter (MDF) provided by the metabolic software were also applied. (3) Mass spectrometry is not suitable for isomer discrimination. The third step was the differentiation of isomers, we used two widely accepted parameters, namely, Clog![[thin space (1/6-em)]](https://www.rsc.org/images/entities/char_2009.gif) P and the minimum capacity values. It is extremely troublesome to distinguish the structural isomers in the identification process of metabolites because of the same molecular formula, small difference in the retention time and the MS/MS spectra. Therefore, a useful parameter Clog
P and the minimum capacity values. It is extremely troublesome to distinguish the structural isomers in the identification process of metabolites because of the same molecular formula, small difference in the retention time and the MS/MS spectra. Therefore, a useful parameter Clog![[thin space (1/6-em)]](https://www.rsc.org/images/entities/char_2009.gif) P calculated by the program Chemdraw Ultra 14.0 was introduced to distinguish the structural isomers. Usually, the compound with the less Clog
P calculated by the program Chemdraw Ultra 14.0 was introduced to distinguish the structural isomers. Usually, the compound with the less Clog![[thin space (1/6-em)]](https://www.rsc.org/images/entities/char_2009.gif) P value had the shorter retention time in a reversed phase liquid chromatography system. We can make a preliminary distinction between isomers in this way. Besides, the minimum capacity values (software Chem3D) selected compound by calculating the values at different sites of the group. (4) Finally, relevant drug bio-transformation knowledge is necessary.
P value had the shorter retention time in a reversed phase liquid chromatography system. We can make a preliminary distinction between isomers in this way. Besides, the minimum capacity values (software Chem3D) selected compound by calculating the values at different sites of the group. (4) Finally, relevant drug bio-transformation knowledge is necessary.
3. Results and discussion
3.1 Mass spectrometric patterns of GLA (M0)
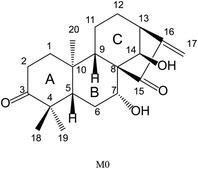
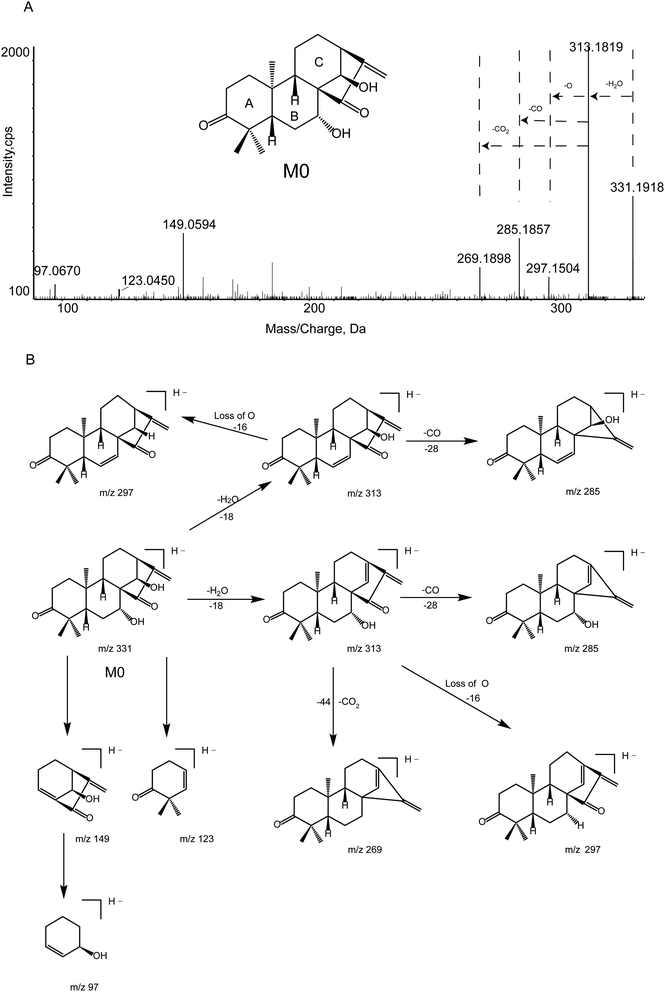
The chemical structure of M0 was shown in Fig. 1. M0 was eluted at 13.41 min and exhibited [M − H]− at m/z 331.1918 (0.9 ppm, elemental composition C20H28O4) in all experimental samples under the chromatographic and mass conditions.The deprotonated ion at m/z 331.1918 ([M − H]−) of M0 successively eliminated H2O and CO to produce characteristic products ions at m/z 313.1819 ([M − H–H2O]−) and 285.1857 ([M − H–H2O–CO]−), respectively. Besides, the fragment ion at m/z 269.1898 ([M − H–H2O–CO2]−) originating from the ion m/z 313.1819 ([M − H–H2O]−) was interpreted as proceeding via the loss of the C7 hydroxyl and the C15 carbonyl groups to remove the neutral fragment CO2. Furthermore, the characteristic daughter ion at m/z 149.0594 ([C9H10O2–H]−) was acquired from the fracture of the C7–C8 bond and C9–C10 bond. Key product ions (KPIs) were at m/z 149.0594, 123.0450, and 97.0670. Besides, another fragment ion was at m/z 297.1504 ([M − H–H2O–O]−). The MS/MS spectrum of deprotonated GLA and its fragmentation pathway were shown in Fig. 2.
It is general that a site with a high density of electron clouds is easily oxidized and where the electron cloud density is small is easy to be restored. Moreover, the carbon–carbon double bonds of M0 predicted that hydrogenation and internal hydrolysis would occur, –OH predicted that loss of water, methylation, sulfate conjugation and glucuronide conjugation would occur.
3.2 Phase I metabolites identification
Most of phase I metabolites underwent oxidation, demethylation, ketone formation, hydrogenation, and internal hydrolysis. Ketone formation, oxidation, and oxidation to carboxylic acid can be thought of as the characteristic metabolic profile of M0. Other metabolic profiles were also observed.![[thin space (1/6-em)]](https://www.rsc.org/images/entities/char_2009.gif) P, they were initially deduced. The Clog
P, they were initially deduced. The Clog![[thin space (1/6-em)]](https://www.rsc.org/images/entities/char_2009.gif) P values of M18 and M19 were 0.5558 and 1.1302, respectively.
P values of M18 and M19 were 0.5558 and 1.1302, respectively.In M21, the diagnostic ions at m/z 137 and 97 were by ketogenic A ring and original C ring, respectively. Only the C-1 and C-2 positions in the A ring may undergo a ketone reaction. According to the oxidation mechanism, a site having a large electron cloud density is easily oxidized. Hence, the C-1 position was probable to undergo a ketone reaction due to a larger electron cloud density.
In M22, fragment ions at m/z 149 and 123 were the same as M0. The above information implied that the ketone was formed in the B ring. Only the C-6 was consistent.
In M23, the characteristic fragment ion was at m/z 163. It strongly implied that the oxidation of alkyl group to ketone group was conducted at C-11 or C-12. According to the principle of minimum energy and steric hindrance effect, the C-12 position was easier to form a ketone. The lowest energy of ketone metabolites at C-11 and C-12 were 59.3359 kcal mol−1 and 59.1798 kcal mol−1, respectively.
M5 was eluted at 14.41 min. It showed the elemental composition of C19H28O3. Fragment ions at m/z 285 and 267 were produced via successively losing H2O from the deprotonated ion at m/z 303 ([M − H]−). Besides, characteristic fragment ion at m/z 123 was observed.
M6 (tR = 28.53 min) and M7 (tR = 29.11 min) showed the elemental composition of C20H28O3. By losses of H2O and CO, the distinctive product ions at m/z 297 ([M − H–H2O]−) and 269 ([M − H–H2O–CO]−) were created by the deprotonated ion at m/z 315 ([M − H]−) in M6–M7. Besides, M6 generated the KPIs at m/z 149, 123, and 97. M6 was observed by the loss of an oxygen atom from C-7. As for M7, the product ion at m/z 253 ([M − H–H2O–CO2]−) was formed by the loss of CO2. Fragment ion at m/z 133 was contributed to losing an oxygen atom from C14.
In M8, the deprotonated ion at m/z 333 ([M − H]−) successively eliminated H2O and CO to produce ions at m/z 315 ([M − H–H2O]−) and 287 ([M − H–H2O–CO]−), respectively. Subsequently, the product ion at m/z 271 ([M − H–H2O–CO2]−) was formed by the loss of CO2 from the ion at m/z 315. The fragment ion at m/z 151 was 2 Da higher than that of M0, which indicated that hydrogenation took place in the C rings at C16–C17. M9 exhibited the dehydrated product ion at m/z 315 and fragment ions at m/z 151, 123 and 97. And no product ions after CO or CO2 removal have been found, indicating that hydrogenation occurred at C-15. For M10, in addition to the fragment ions generated by the losses of H2O, CO, and CO2, fragment ions at m/z 149, 97 and 125 were also observed. The fragment ion at m/z 125 indicated that the hydrogenation occurred at the C-3 position of the A ring.
![[thin space (1/6-em)]](https://www.rsc.org/images/entities/char_2009.gif) P values of them displayed 0367, 0.0368 and 0.6112, respectively. Based on the above information, M26, M27, and M28 were temporarily deduced.
P values of them displayed 0367, 0.0368 and 0.6112, respectively. Based on the above information, M26, M27, and M28 were temporarily deduced.![[thin space (1/6-em)]](https://www.rsc.org/images/entities/char_2009.gif) P values.
P values.3.3 Phase II metabolites identification
Metabolic profile involved methylation conjugation, sulfate conjugation, and glucuronide conjugation. Products that have undergone both phase I metabolism and phase II metabolism have also been observed.3.4 Comparison of metabolites acquired by DDA and DIA
There is almost no difference in the type and amount of metabolites obtained by the DDA or DIA method in rat urine, feces, bile, and RIF. But in plasma, the results obtained by these two acquisition modes varied widely. Specifically, 3 and 7 metabolites were detected by DDA and DIA, respectively (see Fig. 8). However, for some compounds (M1, M2, M8, M9, M10), the corresponding MS/MS fragment data could only be detected via DDA mode. Previous research has shown that matrix effects might have failed in MS/MS data acquisition in DIA mode.31 Based on the complementarity of DDA and DIA modes, the hit rate of identifying trace metabolites was superbly increased, thereby enriching metabolic profile.3.5 Metabolic profile of GLA
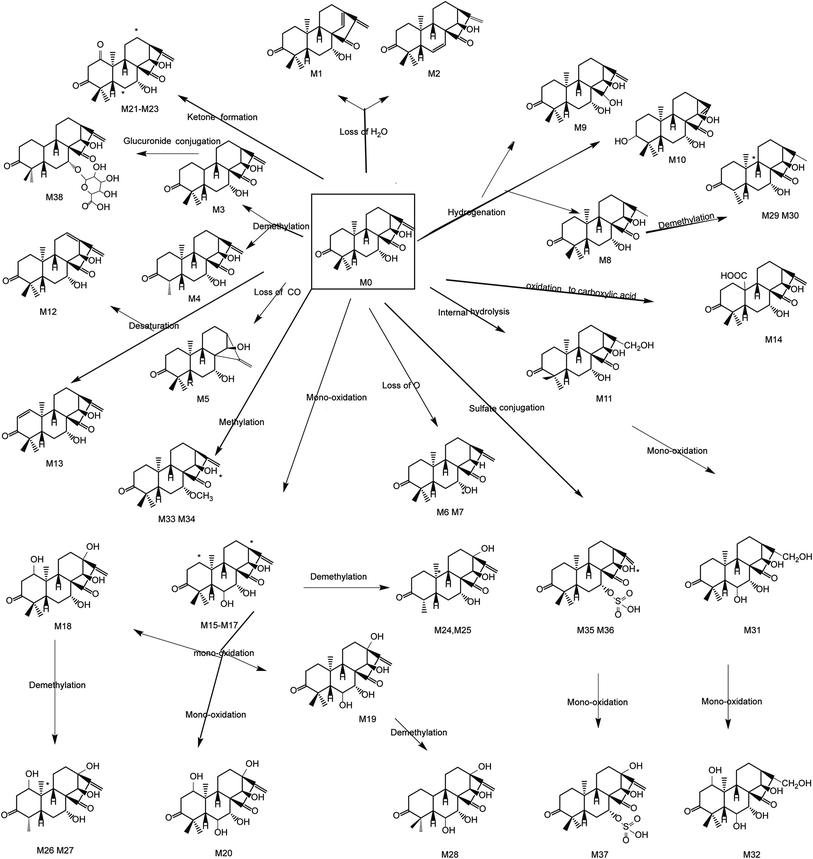
The characteristic metabolic profiles of phase I were oxidation, demethylation, hydrogenation, internal hydrolysis, desaturation, and ketone formation. Methylation conjugation, sulfate conjugation, oxidation and sulfate conjugation, and glucuronide conjugation were metabolic routes of phase II. Furthermore, GLA distinctively underwent successional oxidation and demethylation reaction. This is extremely evident in the metabolic profile. The possible metabolic profiles of GLA in vitro and in vivo were displayed in Fig. 5. Besides, Table 2 was the identification of metabolites that appeared.| Compound ID | Formula | [M − H]− (m/z) | TR (min) | Error (ppm) | Fragment ions | Potential pathway | Clog![[thin space (1/6-em)]](https://www.rsc.org/images/entities/char_2009.gif) P P |
RIF | U | F | B | P |
|---|---|---|---|---|---|---|---|---|---|---|---|---|
| a RIF: rat intestinal flora; U: urine; F: feces; B: bile; P: plasma. Total: total metabolites. KPIs were indicated in bold face. “+”: the MS data detected by DDA and DIA. “*”: the MS data only detected by DIA. The MS/MS fragment data of M1, M2, M8, M9, M10 could only be observed under DDA mode. | ||||||||||||
| M0 | C20H28O4 | 331.1918 | 13.41 | 0.9 | 331.1918, 313.1819, 297.1504, 285.1857, 269.1898, 255.1382, 149.0594, 123.0450, 97.0670 | Parent | 1.8834 | + | + | + | + | + |
| M1 | C20H26O3 | 313.1818 | 26.78 | 2.5 | 313.1818, 285.1135, 269.1193, 131.0494, 123.0441 | Loss of water | 1.8972 | + | ||||
| M2 | C20H26O3 | 313.1819 | 27.12 | 3.1 | 313.1819, 285.1165, 269.1205, 149.0571 | Loss of water | 2.3082 | + | ||||
| M3 | C19H26O4 | 317.1765 | 28.08 | 2.1 | 317.1765, 299.1813, 271.2283, 255.2118, 123.0500, 97.0686 | Demethylation | 1.3644 | + | ||||
| M4 | C19H26O4 | 317.1764 | 29.34 | 1.7 | 317.1764, 299.1816, 271.2292, 255.2122, 149.0538, 97.0697 | Demethylation | 1.3644 | + | ||||
| M5 | C19H28O3 | 303.1972 | 14.41 | 2.2 | 303.1972, 285.0737, 267.1234, 123.0498 | Loss of CO | 2.3380 | + | ||||
| M6 | C20H28O3 | 315.1973 | 28.53 | 2.2 | 315.1973, 297.1815, 269.0817, 149.0602, 123.0453, 96.9605 | Loss of O | 2.5922 | + | + | + | + | |
| M7 | C20H28O3 | 315.1968 | 29.11 | 0.7 | 315.1968, 297.1877, 269.0833, 253.0732, 133.0302, 96.9586 | Loss of O | 2.1212 | + | + | + | + | |
| M8 | C20H30O4 | 333.2078 | 23.01 | 1.9 | 333.2078, 315.1951, 287.1812, 271.1692, 151.0767, 123.0620, 96.9608 | Hydrogenation | 2.2348 | + | + | |||
| M9 | C20H30O4 | 333.2081 | 20.13 | 2.8 | 333.2081, 315.1960, 151.1134, 123.0510, 97.0646 | Hydrogenation | 2.9720 | + | ||||
| M10 | C20H30O4 | 333.2079 | 20.43 | 2.0 | 333.2079, 315.1968, 287.1327, 271.1692, 149.0671, 125.0961, 96.9600 | Hydrogenation | 2.2854 | + | ||||
| M11 | C20H30O5 | 349.2020 | 11.23 | −0.2 | 349.2020, 331.1912, 303.1963, 287.2022, 167.1065, 96.9607 | Internal hydrolysis | 1.0482 | + | + | |||
| M12 | C20H26O4 | 329.1760 | 18.34 | 0.5 | 329.1760, 311.0892, 283.1180, 267.1007, 147.0371, 123.0451 | Desaturation | 1.6594 | + | + | + | ||
| M13 | C20H26O4 | 329.1765 | 18.05 | 1.8 | 329.1765, 311.2208, 283.2639, 267.1934, 149.0601, 121.0364 | Desaturation | 1.7394 | + | + | + | ||
| M14 | C20H26O6 | 361.1657 | 24.42 | 0.1 | 361.1657, 343.1899, 315.1971, 299.2137, 149.0595, 123.0509 | Oxidation to carboxylic acid | 0.6694 | + | + | * | ||
| M15 | C20H28O5 | 347.1866 | 3.01 | 0.6 | 347.1866, 329.1686, 301.1778, 285.1866, 149.0674, 123.0623 | Mono-oxidation | 1.1712 | + | + | + | ||
| M16 | C20H28O5 | 347.1874 | 4.02 | 2.8 | 347.1874, 329.2308, 301.1415, 285.1857, 165.1280, 147.0799 | Mono-oxidation | 1.8424 | + | + | + | ||
| M17 | C20H28O5 | 347.1859 | 22.25 | −1.4 | 347.1859, 329.1782, 301.2046, 285.1864, 149.0619, 139.0721 | Mono-oxidation | 0.5968 | + | + | + | ||
| M18 | C20H28O6 | 363.1821 | 11.62 | 2.1 | 363.1821, 345.1675, 317.2071, 301.1773, 165.0883 | Di-oxidation | 0.5558 | + | + | + | ||
| M19 | C20H28O6 | 363.1826 | 13.25 | 3.7 | 363.1821, 345.1675, 317.2073, 301.1771, 165.0882 | Di-oxidation | 1.1302 | + | + | + | ||
| M20 | C20H28O7 | 379.1753 | 23.14 | −2.6 | 379.1753, 361.2113, 333.2042, 317.1679, 165.1244, 139.1135 | Tri-oxidation | −1.5640 | + | + | * | ||
| M21 | C20H28O7 | 345.1701 | 7.98 | −1.9 | 345.1701, 327.2164, 299.1661, 283.1735, 137.0965, 97.0653 | Ketone formation | 1.2740 | + | + | |||
| M22 | C20H26O5 | 345.1704 | 8.23 | −1.0 | 345.1704, 327.2086, 299.1842, 283.0953, 149.0611, 123.0445 | Ketone formation | 0.4673 | + | + | |||
| M23 | C20H26O5 | 345.1702 | 8.44 | −1.6 | 345.1717, 327.2098, 299.1796, 283.1672, 163.0760 | Ketone formation | 1.0298 | + | + | |||
| M24 | C19H26O5 | 333.1689 | 24.48 | −5.4 | 333.1689, 315.1580, 287.1633, 271.1687, 165.0540, 123.0457 | Demethylation and oxidation | 1.3223 | + | ||||
| M25 | C20H26O5 | 333.1691 | 25.25 | −4.9 | 333.1691, 315.1671, 287.1503, 271.1730, 165.0931, 107.0431 | Demethylation and oxidation | 1.3234 | + | ||||
| M26 | C19H26O6 | 349.1632 | 8.62 | −6.0 | 349.1636, 331.1516, 303.1963, 287.1991 | Demethylation and di-oxidation | −0.6344 | + | ||||
| M27 | C19H26O6 | 349.1636 | 8.74 | −5.8 | 349.1636, 331.1516, 303.1963, 287.1991 | Demethylation and di-oxidation | 0.0368 | + | ||||
| M28 | C19H26O6 | 349.1650 | 8.83 | −1.9 | 349.1636, 331.1516, 303.1963, 287.1991 | Demethylation and di-oxidation | 0.6112 | + | ||||
| M29 | C19H28O4 | 319.1910 | 12.21 | −1.5 | 319.1913, 301.1800, 273.1723, 257.1903, 151.0537 | Demethylation and hydrogenation | 1.7158 | + | + | |||
| M30 | C19H28O4 | 319.1913 | 12.44 | −0.4 | 319.1913, 301.1800, 273.1723, 257.1903, 151.0537 | Demethylation and hydrogenation | 1.7158 | + | + | |||
| M31 | C20H30O6 | 365.1962 | 18.90 | −2.1 | 365.1962, 347.1867, 319.1932, 303.1956, 167.0678, 149.0620, 123.0446 | Oxidation and internal hydrolysis | 0.3359 | + | + | |||
| M32 | C20H30O7 | 381.1920 | 13.25 | 0.2 | 381.1920, 363.1791, 335.1438, 319.1531, 167.0665, 149.0613, 139.0387, 123.0436 | Di-oxidation and internal hydrolysis | −0.9506 | + | + | + | ||
| M33 | C21H30O4 | 345.2100 | 18.92 | 1.7 | 345.2100, 327.1601, 299.1634, 283.1699, 163.0399, 123.0439 | Methylation | 2.0116 | + | ||||
| M34 | C21H30O4 | 345.2101 | 19.87 | 1.7 | 345.2101, 327.1600, 299.1647, 283.1673, 149.0599 | Methylation | 1.9848 | + | ||||
| M35 | C20H28O7S | 411.1499 | 5.62 | 3.9 | 411.1499, 393.1781, 365.1366, 349.1960, 229.0632, 123.0420, 97.0665 | Sulfate conjugation | 1.1902 | + | * | |||
| M36 | C20H28O7S | 411.1490 | 5.75 | 1.6 | 411.1490, 393.1571, 365.2022, 349.1958, 149.0594, 123.0556 | Sulfate conjugation | 1.1812 | + | ||||
| M37 | C20H28O8S | 427.1424 | 10.66 | −2.0 | 427.1424, 409.2193, 381.1955, 365.2184, 165.0637, 123.0519 | Oxidation and sulfate conjugation | 1.1402 | + | ||||
| M38 | C26H38O9 | 493.2049 | 9.87 | −6.2 | 493.2049, 475.2261, 447.2853, 175.0731, 149.0589, 123.0546 | Demethylation and glucuronide conjugation | −0.6910 | + | * | |||
| Total | 7 | 25 | 18 | 17 | 7 | |||||||
3.6 Two blank groups for RIF experiment
By consulting the literature, we found that not a few rat intestinal flora hatching experiments only set up one blank group. Such a design was very unscientific and untrustworthy. In the study, two blank groups were applied.The Fig. 3(A) stood for rat intestinal flora (RIF) experimental group (100 μL GLA in culture medium fluid). To exclude the interference of other substances, we compared the RIF sample chromatogram with two blanks. The Fig. 3(B) stood for the blank B sample and the Fig. 3(C) stood for blank C sample. The blank B (100 μL methanol in culture medium fluid) was to eliminate the effects of solvents on metabolism. The blank C (100 μL GLA in anaerobic medium fluid) was to investigate whether there was a decomposition of the drug caused by non-intestinal flora in the anaerobic culture solution. By comparing the A, B, and C, the substances presented in the A but not in the B and C were truly caused by the action of RIF.
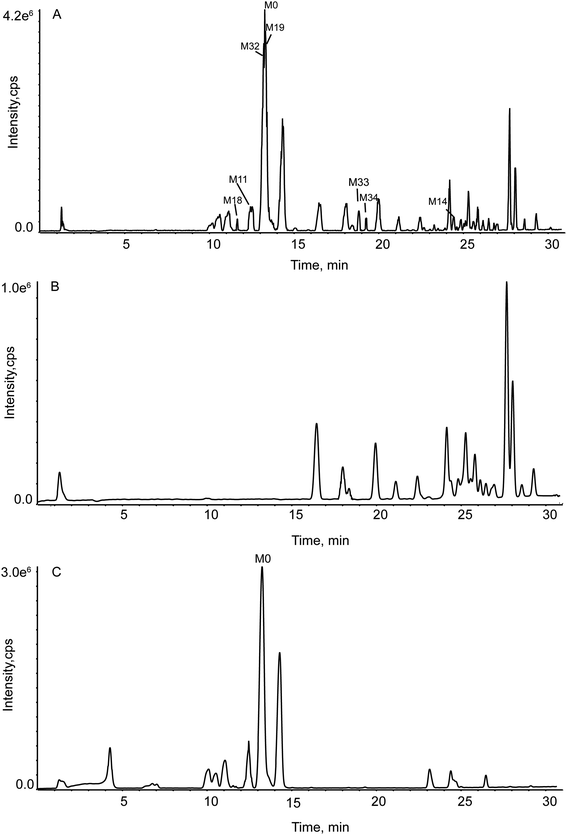 | ||
| Fig. 3 TIC for the group in vitro by DDA. (Panel A: the RIF sample group; Panel B: blank B group; Panel C: blank C group.) | ||
3.7 Comparison of metabolites in vitro and in vivo
Drug metabolism is an essential part of pharmacological mechanisms, pharmacokinetics research, new drug screening, and clinical application. In the study, we preliminary studied the metabolism in vivo (plasma, urine, bile, and faces) and in vitro (rat intestinal flora) in this work. A total of 38 metabolites in vivo while 7 metabolites in vitro were temporarily recognized. Moreover, 5 metabolites in vitro were also found in vivo, two methylation metabolites were only found in vitro. The above information suggested that the metabolism in vivo and in vitro had a huge difference in some ways. Based on the metabolite observed, this is important to further research on what enzymes may have played a role. After all, enzymes are the driving force for metabolism but it is very complicated.The total ion chromatogram (TIC) for the experimental sample group in vitro was shown in Fig. 3(A). Fig. 4 stands for TIC for the experimental sample groups in vivo.
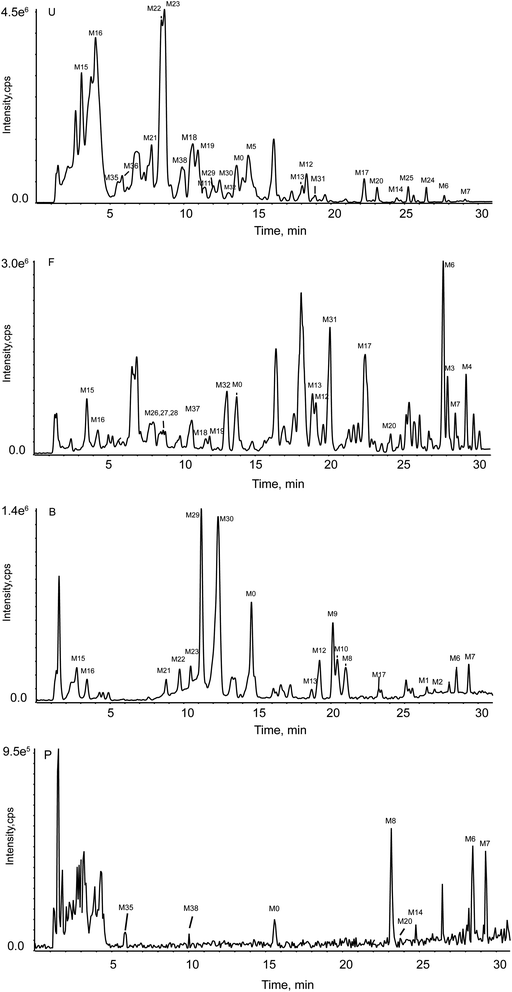 | ||
| Fig. 4 TIC for the experimental group in vivo. (Panel U: the group in urine by DDA; Panel F: the group in feces by DDA; Panel B: the group in bile by DDA; Panel P: the group in plasma by DIA.) | ||
The EIC and MS/MS spectra of metabolites in vitro were showed in Fig. 6. But the EIC of M33, M34 (C21H30O4) has many interfering substances. For a clear expression on how we got the metabolites, we introduced Fig. 7. The A, B, and C represented the experimental sample group, blank B, blank C, respectively. The EIC presented in A, but not presented in B and C were the metabolites.
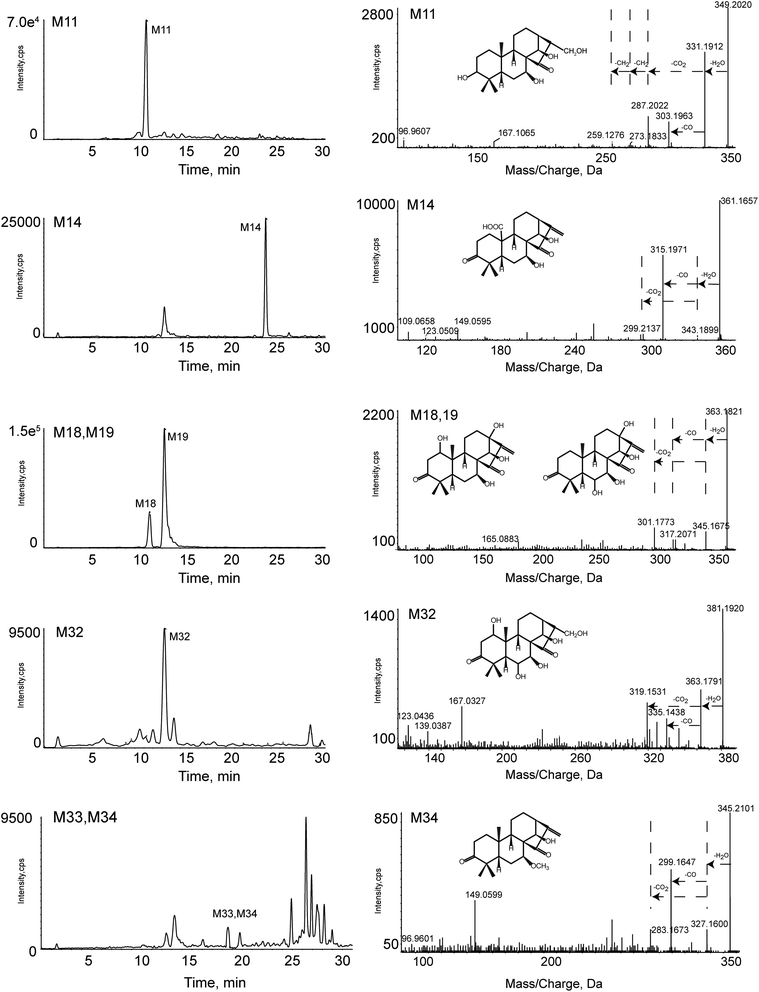 | ||
| Fig. 6 The EIC and MS/MS spectra of metabolites in vitro, including M11, M14, M18, M19, M32, M33, M34. | ||
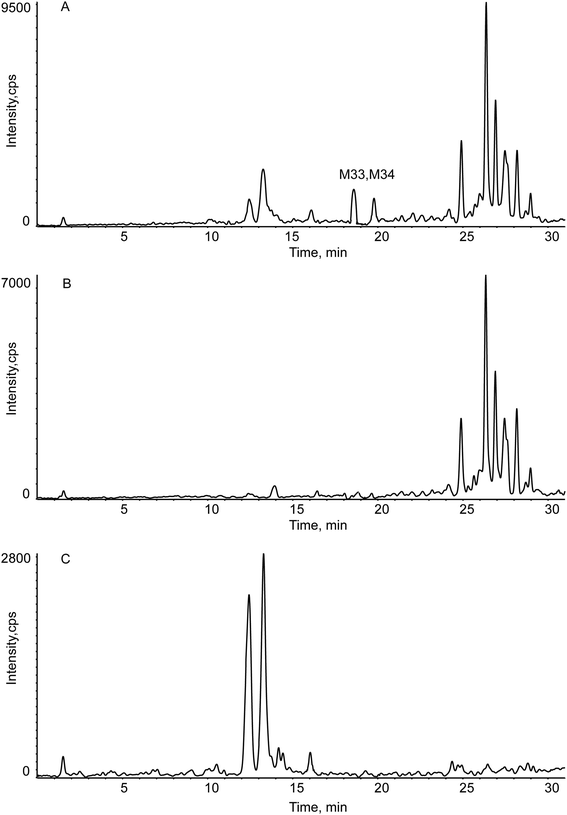 | ||
| Fig. 7 The EIC of M33, M34 in vitro (Panel A: the RIF sample group; Panel B: blank B group; Panel C: blank C group). | ||
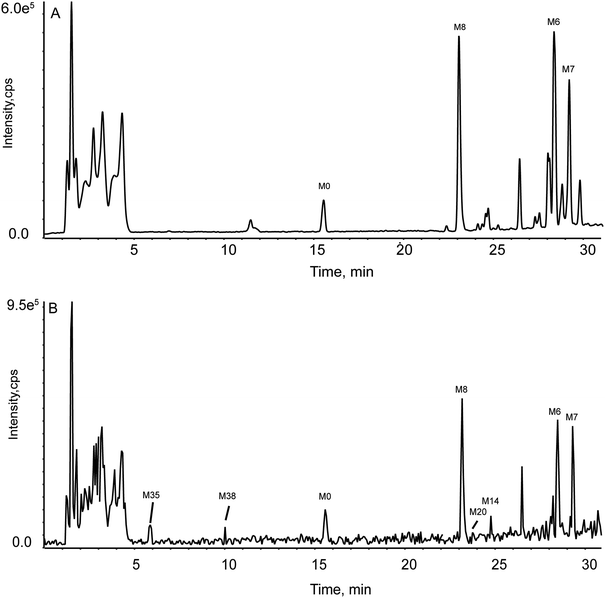 | ||
| Fig. 8 TIC for the experimental group in rat plasma by two acquisitions. (Panel A: by DDA mode; Panel B: by DIA mode.) | ||
4. Conclusions
By this novel metabolite identification strategy, 32 phase I metabolites and 6 phase II metabolites were temporarily identified in vitro and in vivo, 25, 18, 17 and 11 in rat urine, feces, bile, and plasma included, respectively. Besides, a total of 7 metabolites were detected under the action of intestinal flora. Characteristic metabolic profiles of phase I were oxidation, demethylation, hydrogenation, internal hydrolysis, desaturation, and ketone formation. Methylation, sulfate conjugation, oxidation and sulfate conjugation, and glucuronide conjugation belonged to metabolic routes of phase II. Regrettably, due to the trace amount of metabolic production, we cannot use nuclear magnetics for structural confirmation. Certainly, the role of these metabolites in human life activities requires further research. In a word, this study based on an innovative research strategy not only provided a reference for further study of the pharmacology and mechanism of GLA but also some value for studies of other ent-kauranoid diterpenoids even other herbs.Abbreviations
| UHPLC-Q-TOF-MS/MS | Ultra high performance liquid chromatography coupled with hybrid triple quadrupole time-of-flight mass spectrometry |
| GLA | Glaucocalyxin A |
| DDA | Data-dependent acquisition |
| DIA | Data-independent acquisition |
| KPIs | Key product ions |
| PCVG | Principal component variable grouping filter |
| DBS | Dynamic background subtraction |
| MMDF | Multiple mass defect filtering |
| MDF | Mass defect filter |
| EIC | Extracted ion chromatogram |
| TIC | Total ion chromatogram |
| PIF | Product ion filter |
| NLF | Neutral loss filtering |
| CMC-Na | Sodium carboxymethyl cellulose |
| RIF | Rat intestinal flora |
Conflicts of interest
The authors declare no conflict of interest.Acknowledgements
Our work supported by the National Natural Science Foundation of China (No. 81402894), the Hebei Education Department Key Project (No. ZD2017244), and the Natural Science Foundation of Hebei Province of China (H2019206562). Besides, thanks to my friends of Department of Pharmaceutical Analysis, Hebei Medical University.References
- Nanjing University of Chinese Medicine, HBR's 10 Must Reads on Managing Yourself, Shanghai Scientific & Technical Press, Shanghai, 2014, p. 2040 Search PubMed.
- W. Huang, X. Guan and Y. Lv, Simultaneous determination of glaucocalyxin A and glaucocalyxin B in rat plasma by LC-MS/MS and its application to a pharmacokinetic study after oral administration of Rabdosia japonica extract, Biomed. Chromatogr., 2018, 32, 4089 CrossRef.
- S. Han, X. Sheng and B. Quan, Diterpenoids from Isodon species and their biological activities, Nat. Prod. Rep., 2006, 23, 673–698 RSC.
- S. Hong, S. Lee, X. Han, C. Lee and D. Lee, Ent-kaurane diterpenoids from Isodon japonicus, J. Nat. Prod., 2008, 71, 1055–1058 CrossRef CAS PubMed.
- Z. Xiang, Y. Xu, Y. Shen, L. Jin, H. Wang and H. Chen, Diterpenoids from Rabdosia japonica, Asian J. Chem., 2009, 21, 2721–2725 CAS.
- L. Gao, J. Zhang, W. Yang, B. Wang and J. Wang, Glaucocalyxin A induces apoptosis in human leukemia HL-60 cells through mitochondria-mediated death pathway, Toxicol. In Vitro, 2011, 25, 51–63 CrossRef CAS PubMed.
- B. W. Kim, S. Koppula and S. S. Hong, Regulation of Microglia Activity by Glaucocalyxin-A: Attenuation of Lipopolysaccharide-Stimulated Neuroinflammation through NF-kappa B and p38 MAPK Signaling Pathways, PLoS One, 2013, 8, 1–11 CrossRef.
- X. Xiao, W. Cao, X. Jiang, W. Zhang, Y. Zhang, B. Liu, J. Cheng, H. Huang, J. Huo and X. Zhang, Glaucocalyxin A, a negative Akt regulator, specifically induces apoptosis in human brain glioblastoma U87MG cells, Acta Biochim. Biophys. Sin., 2013, 45, 946–952 CrossRef CAS PubMed.
- L. Tang, X. Jin, X. Hu, Z. Liu and L. Yu, Glaucocalyxin A inhibits the growth of liver cancer Focus and SMMC-7721 cells, Oncol. Lett., 2016, 11, 1173–1178 CrossRef CAS PubMed.
- M. Mao, T. Zhang, Z. Wang, H. Wang, J. Xu, F. Yin, G. Wang, M. Sun, Z. Wang, Y. Hua and Z. Cai, Glaucocalyxin A-induced oxidative stress inhibits the activation of STAT3 signaling pathway and suppresses osteosarcoma progression in vitro and in vivo, BBA, Mol. Basis Dis., 2019, 1865, 1214–1225 CrossRef CAS PubMed.
- Q. Su and Y. Zhang, Glaucocalyxin A attenuates angiotensin II-induced cardiac fibrosis in cardiac fibroblasts, Biochem. Biophys. Res. Commun., 2018, 503, 1949–1954 CrossRef CAS PubMed.
- W. Li, X. Tang, W. Yi, Q. Li, L. Ren, X. Liu, C. Chu, O. Yukio, J. Zhang and L. Zhu, Glaucocalyxin A inhibits platelet activation and thrombus formation preferentially via GPVI signaling pathway, PLoS One, 2013, 8, e85120 CrossRef PubMed.
- Z. Xiang, X. Wu, X. Liu and Y. Jin, Glaucocalyxin A: a review, Nat. Prod. Res., 2014, 28, 2221–2236 CrossRef CAS PubMed.
- T. Zhou, J. Zhuang, Z. Wang, Y. Zhou, W. Li, Z. Wang and Z. Zhu, Glaucocalyxin A as a natural product increases amyloid β clearance and decreases tau phosphorylation involving the mammalian target of rapamycin signaling pathway, Neuroreport, 2019, 30, 310–316 CrossRef CAS PubMed.
- L. Cao, Z. Chen, Y. Li, Y. Ma and R. Jin, Research RP-HPLC determination of glaucocalyxin A in rat plasma and its pharmacokinetic and excretion, Chin. J. Pharm. Anal., 2006, 26, 1534–1537 Search PubMed.
- L. Cao, Y. Li, Z. Chen and Y. Li, The metabolic study of glaucocalyxin A in rat in vivo and in vitro, West China, J. Pharm. Sci., 2006, 21(3), 227–229 CAS.
- M. Zhao, L. Du, J. Tao, D. Qian, J. Guo, S. Jiang, E. Shang, J. Duan and C. Wu, Ultra-performance liquid chromatography coupled with quadrupole time-of-flight mass spectrometry for rapid analysis of the metabolites of morroniside produced by human intestinal bacteria, J. Chromatogr. B: Anal. Technol. Biomed. Life Sci., 2015, 976, 61–67 CrossRef PubMed.
- Y. Li, G. Zhou, Y. Peng, P. Tu and X. Li, Screening and identification of three typical phenylethanoid glycosides metabolites from Cistanches Herba by human intestinal flora using UPLC/Q-TOF-MS, J. Pharm. Biomed. Anal., 2016, 118, 167–176 CrossRef CAS PubMed.
- Z. Huang, Y. Xu, Q. Wang and X. Gao, Metabolism and mutual biotransformations of anthraquinones and anthrones in rhubarb by human intestinal flora using UPLC-Q-TOF/MS, J. Chromatogr. B: Anal. Technol. Biomed. Life Sci., 2019, 1104, 59–66 CrossRef CAS PubMed.
- Y. Sun, L. Li, M. Liao, M. Su, C. Wan, L. Zhang and H. Zhang, A systematic data acquisition and mining strategy for chemical profiling of Aster tataricus rhizoma (Ziwan) by UHPLC-Q-TOF-MS and the corresponding anti-depressive activity screening, J. Pharm. Biomed. Anal., 2018, 154, 216–226 CrossRef CAS.
- W. W. Xie, Y. R. Jin, L. D. Hou, Y. H. Ma, H. J. Xu, K. R. Zhang, L. T. Zhang and Y. F. Du, A practical strategy for the characterization of ponicidin metabolites in vivo and in vitro by UHPLC-Q-TOF-MS based on nontargeted SWATH data acquisition, J. Pharm. Biomed. Anal., 2017, 145, 865–878 CrossRef CAS.
- X. Feng, Y. Li, C. Guang, M. Qiao, T. Wang, L. Chai and F. Qiu, Characterization of the in vivo and in vitro Metabolites of Linarin in Rat Biosamples and Intestinal Flora Using Ultra-High Performance Liquid Chromatography Coupled with Quadrupole Time-of-Flight Tandem Mass Spectrometry, Molecules, 2018, 23, 2140 CrossRef PubMed.
- Y. T. Chen, X. Feng, L. Y. Li, X. Zhang, K. Song, X. P. Diao, Y. P. Sun and L. T. Zhang, UHPLC-Q-TOF-MS/MS method based on four-step strategy for metabolites of hinokiflavone in vivo and in vitro, J. Pharm. Biomed. Anal., 2019, 169, 19–29 CrossRef CAS PubMed.
- F. R. Cao, L. Feng, L. H. Ye, L. S. Wang, B. X. Xiao, X. Tao and Q. Chang, Ganoderic Acid A Metabolites and their Metabolic Kinetics, Front. Pharmacol., 2017, 8, 101 Search PubMed.
- T. T. Tian, Y. R. Jin, Y. H. Ma, W. W. Xie, H. J. Xu, K. R. Zhang, L. T. Zhang and Y. F. Du, Identification of metabolites of oridonin in rats with a single run on UPLC-Triple-TOF-MS/MS system based on multiple mass defect filter data acquisition and multiple data processing techniques, J. Chromatogr. B: Anal. Technol. Biomed. Life Sci., 2015, 1006, 80–92 CrossRef CAS PubMed.
- B. Li, H. Zhou, G. Yang, F. Han, Y. Li, Y. Gao, J. Gao, F. Zhang and L. Sun, In vivo study of erysolin metabolic profile by ultra high performance liquid chromatography coupleded to Fourier transform ion cyclotron resonance mass spectrometry, J. Chromatogr. B: Anal. Technol. Biomed. Life Sci., 2018, 1072, 173–181 CrossRef CAS PubMed.
- X. Zhang, J. Yin, C. Liang, Y. Sun and L. Zhang, UHPLC-Q-TOF-MS/MS Method Based on Four-Step Strategy for Metabolism Study of Fisetin in vitro and in vivo, J. Agric. Food Chem., 2017, 65, 10959–10972 CrossRef CAS PubMed.
- C. J. Liang, X. Zhang, X. P. Diao, M. Liao, Y. P. Sun and L. Zhang, Metabolism profiling of nevadensin in vitro and in vivo by UHPLC-Q-TOF-MS/MS, J. Chromatogr. B: Anal. Technol. Biomed. Life Sci., 2018, 1084, 69–79 CrossRef CAS PubMed.
- X. Y. Fan, X. C. Liu, C. F. Meng, R. N. Liu, Z. J. Zhang and C. Y. Wang, Metabolites study on 5-O-methylvisammioside in vivo and in vitro by ultra high performance liquid chromatography coupled to quadrupole time-of-flight mass spectrometry, J. Sep. Sci., 2019, 42(12), 2107–2114 CrossRef CAS PubMed.
- J. T. Yin, Y. L. Ma, C. J. Liang, J. Gao, H. Wang and L. T. Zhang, A Systematic Study of the Metabolites of Dietary Acacetin in vivo and in vitro Based on UHPLC-Q-TOF-MS/MS Analysis, J. Agric. Food Chem., 2019, 67, 5530–5543 CrossRef CAS PubMed.
- K. B. Scheidweiler, M. J. Y. Jarvis and M. A. Huestis, Nontargeted SWATH acquisition for identifying 47 synthetic cannabinoid metabolites in human urine by liquid chromatography-high-resolution tandem mass spectrometry, Anal. Bioanal. Chem., 2015, 407, 883–897 CrossRef CAS PubMed.
| This journal is © The Royal Society of Chemistry 2020 |

