DOI:
10.1039/C9RA06478H
(Paper)
RSC Adv., 2020,
10, 236-243
Ab initio-enabled phase transition prediction of solid carbon dioxide at ultra-high temperatures
Received
19th August 2019
, Accepted 12th November 2019
First published on 24th December 2019
Abstract
Carbon dioxide is one of the fundamental chemical species on Earth, but its solid-phase behavior at high pressures is still far from well understood and some phases remain uncertain or unknown, which increases the challenge to predict its structures. The difficulty of theoretical prediction arises from the high cost of structure screening and the low accuracy of applicable methods. In this study, we employed an ab initio computational study on solid carbon dioxide phases I and VII at high pressure and predicted their structures, energies and phase transition using the second-order Møller–Plesset perturbation (MP2) theory. Compared to the classical force field method and density-functional theory (DFT), MP2 is capable of describing covalent, ionic, hydrogen-bonds, and dispersion interactions accurately. The equation of state, vibrational spectra and Gibbs free energy were calculated, which agree well with the experimental results. We reproduced the structure of phase VII and the predicted phase boundary between phases I and VII occupying the reasonable region in the phase diagram.
1. Introduction
Carbon dioxide (CO2) is an important chemical species in the Earth's atmosphere, and its solid state form, dry ice, has plenty of chemical applications. Despite its abundance on Earth and other planets in its solid form, major gaps in the understanding of the solid-phase behaviors of CO2 at high pressure still exist. Thus, in the past decades, many experimental and theoretical studies have been performed to determine the structures and stabilities of various phases of CO2.1–12 The crystal structure of solid carbon dioxide phase I was investigated by Mark and Pohland1 at ambient pressure in the mid-1920s using X-ray powder methods, followed by Simon and Peters5 at 1 bar, 150 K and Olinger13 at 296 K from 1 to 10 GPa. Early in 1985, a new high-pressure phase was detected by Hanson14 and this new structure was further identified as phase III by Aoki et al.8,15 via X-ray diffraction. Moreover, CO2 phase VII,16 which is distributed in a higher temperature and high pressure region of the phase diagram, was identified to have the same structure as phase III both in space group and in atomic arrangements. Similar with phase III, phase VII can be obtained by the high pressure compression of phase I.17 Sontising et al.18 suggested that phases III and VII were likely identical and the structure of phase III was problematic based on the quasi-harmonic electronic structure calculations. For phase VII, only one experimental work has been reported at 726 K and 12.1 GPa,16 but not further confirmed yet, which makes its structural and stability exploration warranted.
The extreme conditions limit the structural explorations in the laboratory12,16 but open a window for theoretical study. In recent decades, great advances have been made in electronic structure methods for predicting molecular structure and crystal energy.19,20 Density functional theory (DFT)21–24 has been the standard method for handling solids and liquids due to its efficiency. However, its accuracy depends on the choice of density functionals, and there is currently no general procedure to systematically improve existing density functionals. To improve the calculation accuracy, the development of fragment-based electronic structure methods greatly extends the power of correlated wave function methods25–28 (such as the second-order Møller–Plesset perturbation (MP2) theory, and the coupled cluster singles, doubles, and perturbative triples (CCSD(T)) theory), into pharmaceutical and other chemically relevant molecular crystals.29–32
Herein, we applied the MP2 algorithm, the simplest and most effective many-body theory, along with the electrostatically embedded generalized molecular fractionation (EE-GMF)-based quantum mechanical (QM) method to calculate the structures and Gibbs free energies of CO2 phases I and VII at various temperatures and high pressures. MP2 is capable of describing covalent, ionic, hydrogen-bonds, and dispersion interactions, which makes the structure and stability prediction more accurate than the classical force field method and density-functional theory (DFT). The structures, equations of state, Raman spectra of phases I and VII, and their solid–solid phase transition were systematically studied and compared. Our results suggest that the questioned structure of phase VII is correct and the predicted phase transition boundary between phases I and VII is consistent with the experiments, together with their lattice parameters and Raman spectra.
2. Results and discussion
2.1. Equations of state
Fig. 1 shows the crystal structures of solid carbon dioxide phases I5 and VII.16 For phases I and VII, their unit cells contain four ordered molecules, but the space group of phase I is Pa3 (atomic position: C(4a) = (0.000, 0.000, 0.000), O(8c) =(0.115, 0.115, 0.115)), while the space group of phase VII is Cmca (atomic position: C(4a) = (0.000, 0.000, 0.000), O(8c) =(0.000, 0.212, 0.109)). We applied EE-GMF-based MP2/aug-cc-pVDZ to optimize the two crystal structures at T = 0. The detailed data is shown in Table 1, where the calculated lattice constants agree well with the experiments. At 11.8 GPa, the calculated lattice constants of phase I are a = b = c = 4.934 Å, while at 12.1 GPa, the calculated lattice constants of phase VII are a = 4.703 Å, b = 4.328 Å, c = 5.982 Å.
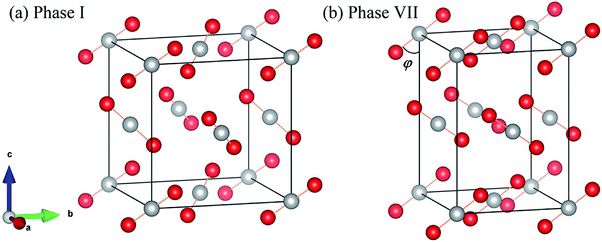 |
| | Fig. 1 Crystal structures of solid CO2 phases I (a) and VII (b). The red circles represent O atoms, while the white circles represent C atoms. | |
Table 1 Observed and calculated lattice constants of CO2 phases III and VII
| Parameter |
Expt. phase I15 at 11.8 GPa |
MP2 phase I at 11.8 GPa |
Expt. phase VII16 at 12.1 GPa |
MP2 phase VII at 12.1 GPa |
| a/Å |
4.939 |
4.934 |
4.746 |
4.703 |
| b/Å |
4.939 |
4.934 |
4.313 |
4.328 |
| c/Å |
4.939 |
4.934 |
5.948 |
5.982 |
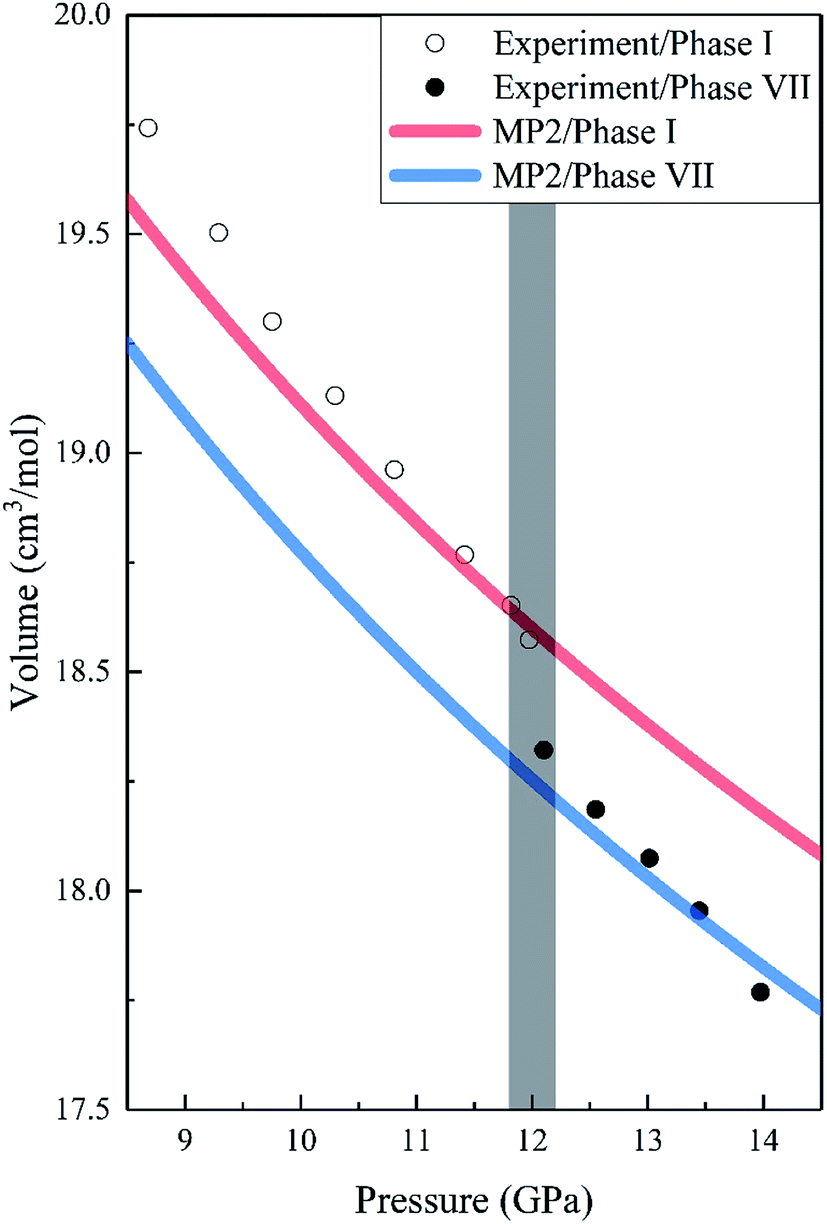
Fig. 2 shows the pressure-dependence volumes of phases I and VII compared to the experimental data. We noted that the predicted lattice volumes of both phases I and VII decrease as the pressure increases, in agreement with the experimental data. For phase I, MP2 with the aug-cc-pVDZ basis set predicted slightly more compact and stiffer solids than experiments, which may be due to the overestimation of the dispersion or quadrupole–quadrupole interactions or both in MP2. However, with an increase in pressure, the agreement between MP2 and experiments improves and becomes nearly exact. It is worth noting that there is a 1.44% volume reduction (the shade in Fig. 2) upon transition from phase I to phase VII, which is also consistent with the experimental data.16
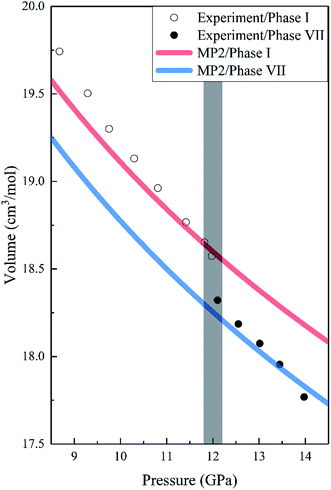 |
| | Fig. 2 Calculated pressure dependence of the volume of CO2 phases I and VII together with the experimental data. The red and blue curves are the calculated volumes of phases I and VII by EE-GMF-MP2/aug-cc-pVDZ, while the white and black dots are the experimental data of phases I and VII taken from Giordano et al., respectively.16 | |
2.2. Vibrational spectra
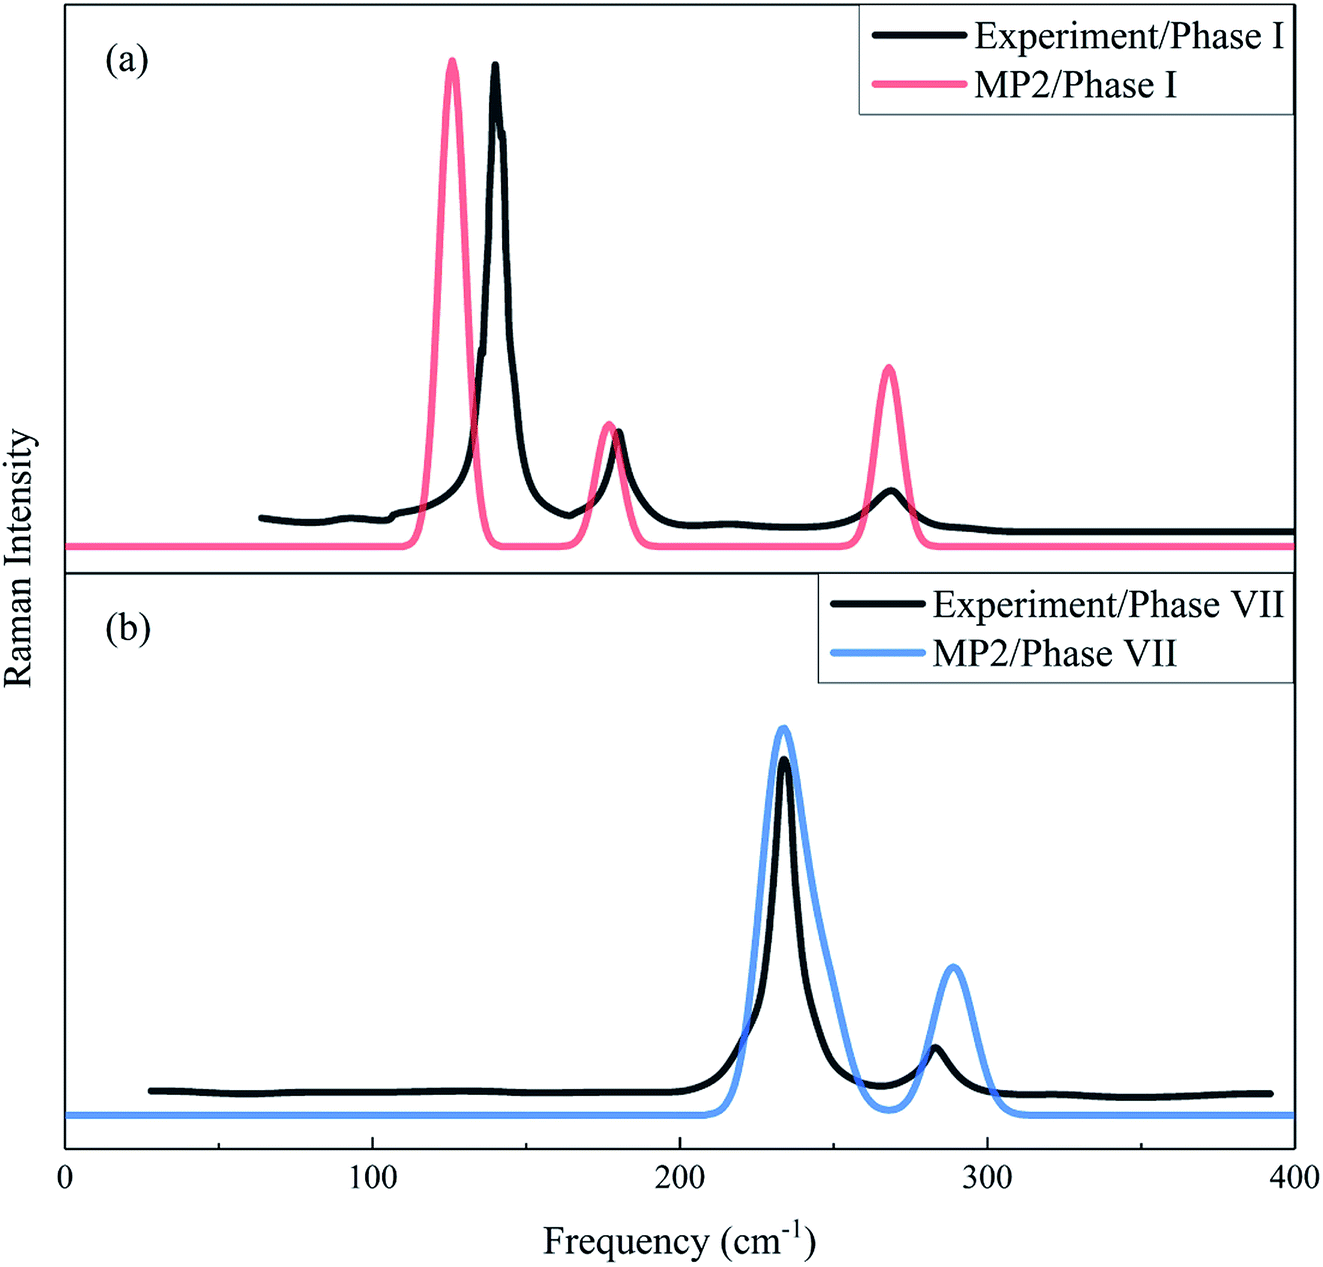
The Raman spectrum is a chemical fingerprint unique to a particular molecule or material and can be used to quickly distinguish different materials. Therefore, Raman spectroscopy provides detailed information on the molecular structure, morphology, crystallinity, and molecular interactions of a material. Fig. 3 shows the calculated and observed Raman spectra of phase I at 11.7 GPa and phase VII at 12.6 GPa in the librational region. For the experimental Raman spectrum of phase I, there are three peaks located at 136.8, 175.9 and 264.5 cm−1, while the observed phase VII has four modes (namely, 219.9, 233.5, 244.0 and 282.0 cm−1)16 in this region. The present calculation reproduced these vibrational peaks with slight shifts, which appear at 128.8, 179.2 and 273.4 cm−1 for phase I, and 205.6, 237.3, 250.2, and 293.0 cm−1 for phase VII, respectively. The three lowest frequency peaks of phase VII are close and form a unique band. In Fig. 3, the agreement in peak positions between theory and experiment is quantitative and the agreement in intensities is also satisfactory, which renders strong computational support for the reliability and accuracy of the EE-GMF-based MP2/aug-cc-pVDZ method.
 |
| | Fig. 3 Calculated and observed Raman spectra of phases I (a) and VII (b) in the librational region. The black curves denote the experimental Raman spectra for phase I at 11.7 GPa33 and phase VII at 12.6 GPa.16 Red and blue curves represent the calculated Raman spectra of phases I and VII, respectively, using the EE-GMF-MP2/aug-cc-pVDZ method. | |
The calculated and experimental Raman frequencies for phases I (red curves) and VIII (blue curves) are displayed in Fig. 4. The predicted Raman-active frequencies reproduce the experimental data with certain accuracy. For phase I, the three red Raman modes in Fig. 4 correspond to the three Raman peaks in Fig. 3(a). For all three Raman peaks of phase I, the biggest difference in frequency between theory and experiment is 5.9%, which slightly changed with pressure. For phase VII, the three lowest frequency peaks in Fig. 4 correspond to the lower band in Fig. 3(b), while the highest frequency lattice mode is assigned to the Raman peak at 282.0 cm−1. The biggest difference in frequency between theory and experiment is 6.5%.
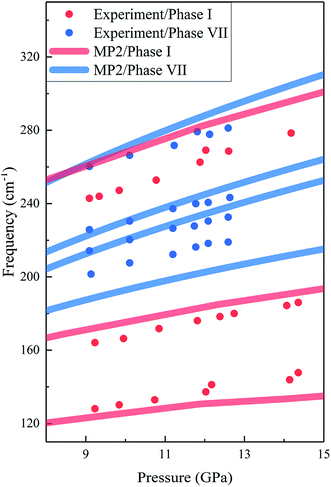 |
| | Fig. 4 Calculated and observed Raman frequencies of phases I and VII as a function of pressure. The red and blue curves are the predicted results by EE-GMF-MP2/aug-cc-pVDZ, while the red and blue dots are the experimental data from Olijnyk et al.33 and Giordano et al.,16 respectively. | |
2.3. Gibbs free energy
We further calculated the Gibbs free energies of phases I and VII. Fig. 5 plots the free energy surfaces of phases I and VII. Fig. 6 shows the temperature dependence of the Gibbs free energy difference between phases I and VII with different pressures. In the low temperature region, the free energy of phase I (red) is lower and its structure is more stable than that of phase VII, as shown in Fig. 5. While at high temperature, the structure of phase VII is more stable. Specifically, the Gibbs free energy difference equals 0 at 11.0 GPa when the temperature reaches 822 K. When the pressure increases to 11.3 GPa, the phase transition temperature decreases to 726 K accordingly. Further increasing the pressure to 11.5, 11.7, and 12.0 GPa (as shown in Fig. 6), the phase transitions between CO2 phases I and VII take place at 664, 602, and 506 K, respectively.
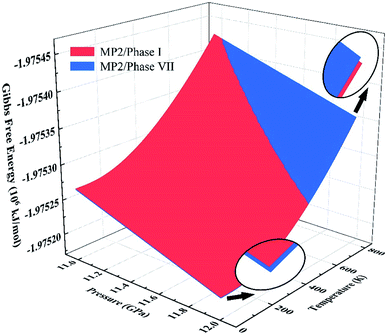 |
| | Fig. 5 Gibbs free energy surfaces of phases I (red) and VII (blue) from 11 to 12 GPa at 0–800 K. The intersection of red and blue surfaces denotes the phase transition boundary between phase I and phase VII, calculated by EE-GMF-MP2/aug-cc-pVDZ. | |
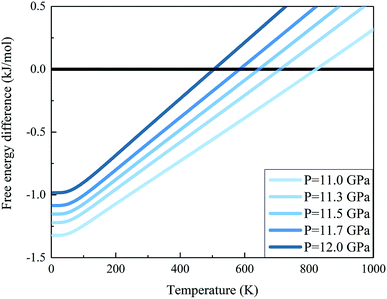 |
| | Fig. 6 Gibbs free energy difference between carbon dioxide phases I and VII (free energy of the phase I minus that of phase VII). The positive value means that phase VII is more stable. The calculations are performed at the EE-GMF-MP2/aug-cc-pVDZ level. | |
2.4. Phase transition
Given the accurate structures and Gibbs free energy calculations of CO2 phases I and VII, we predicted the phases transition as a function of temperature. Fig. 7 shows the phase diagram of solid CO2, where the black curves are the experimental data and the green curve is the predicted phase boundary between phases I and VII by the EE-GMF-MP2/aug-cc-pVDZ method. Below 500 K, the free energy of phase I is always lower than that of phase VII within 0–10 GPa, which means that the low pressure and low temperature region in solid CO2 phase diagram is occupied by phase I. However, at a higher pressure (∼11–14 GPa), phase VII, replacing the phase I, becomes a stable structure at high temperature (∼600–800 K). The predicted phase transition boundary between phases I and VII has a small temperature dependence, that is, the nearly vertical phase boundary takes places at 11.3 GPa and 726 K, 11.5 GPa at 664 K and 11.7 GPa at 602 K, respectively. Considering the good agreement between theory and experiment, the predicted phase transition boundary for phases I–VII falls within a reasonable region of the phase diagram.
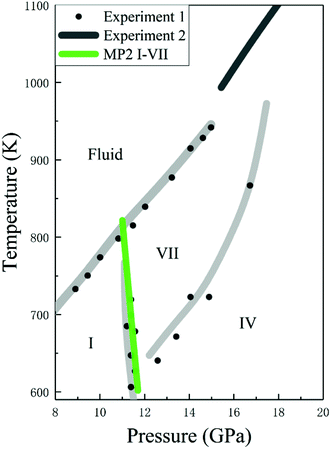 |
| | Fig. 7 Calculated phase boundaries between CO2 phases I and VII, together with the experimental phase diagram of CO2 (experimental data are from Iota et al.,10,17 Giordano et al.16,34 and Litasov et al.35). | |
3. Conclusions
The phase diagram of solid carbon dioxide exhibits a substantial array of stable and meta-stable crystalline phases, along with some undetermined structures, which make it necessary to find the phase boundaries of different phases accurately. We studied the carbon dioxide phases I and VII at various pressures between 0–20 GPa based on the EE-GMF-MP2/aug-cc-pVDZ method. The optimized structural parameters and phonon spectra were computed at the MP2 level with the aug-cc-pvDZ basis set. The compressions of phases I and VII were shown to have similar behavior to experimental data. We reproduced quantitatively the lattice constants, equation of state, and vibrational spectra of carbon dioxide phases I and VII, which match the experimental data very well. In this study, the predicted phase transitions based on the EE-GMF-MP2/aug-cc-pVDZ method are in excellent agreement with experiment. This study helps to elucidate the structural changes that carbon dioxide may go through at ambient and high pressure.
4. Methods
4.1. Free energy calculation
The Electrostatically Embedded Generalized Molecular Fractionation (EE-GMF) method was applied for the energy calculation of the molecular crystal, where each CO2 molecule is assigned as a fragment. The energy of each fragment and the two-body interaction energy between two fragments that are spatially in close contact were computed by the QM method, whereas the interaction energies between two distant fragments were treated via pairwise charge–charge Coulomb interactions. According to the EE-GMF scheme, the energy per unit cell of the molecular crystal can be expressed as follows31,36–39| |
 | (1) |
where n is a three-integer index of a unit cell, S is the number of neighboring unit cells treated by QM, Ei(n) is the energy of the ith molecule in the nth unit cell and Ei(0)j(n) is the energy of the dimer consisting of the ith molecule in the central (0th) unit cell and the jth molecule in the nth unit cell. The QM energy calculations of monomer i(0) and dimer i(0)j(n) were performed in the embedded electrostatic fields of the rest of the system, represented by the Coulomb field of atomic charges, to account for the electronic polarization effect from the surrounding environment. Ẽ in eqn (1) denotes the sum of the self-energy of the fragment along with the interaction energy between the fragment and background charges of the remaining system.
The first term in eqn (1) includes the energy of each molecule in the central unit cell, and the second term is the local two-body QM interactions if the nearest distance between any two molecules in the central unit cell is less than or equal to a predefined distance threshold, λ (λ was set to 4 Å in this study).31,36–39 For the interactions between the central unit cell and the neighboring unit cells, we also calculated the local two-body QM interactions if any molecule in the central unit cell has close contact with other molecules in the neighboring unit cell, as expressed in the third term of eqn (1). In the case that the nearest distance between two molecules is larger than λ, these long-range interactions were approximately described through charge–charge Coulomb interactions (EDC, which is doubly counted in the previous three terms of eqn (1)31,36–39).
The dimers with dimensions of 3 × 3 × 3 unit cells (interaction with one CO2 molecule in the central unit cell) were treated quantum mechanically when the distance between the dimer was within the distance threshold λ. All QM calculations were performed at the EE-GMF-MP2/aug-cc-pVDZ level, in the electrostatic field of the rest of the crystal represented by the electrostatic potential (ESP) charges self-consistently determined through the EE-GMF approach at the HF/aug-cc-pVDZ level. We considered the background charges within the 11 × 11 × 11 supercell (i.e., S = 5 in eqn (1)). In addition, the last term of eqn (1) (ELR) represents the long-range interactions within the 41 × 41 × 41 supercell through Coulomb interactions for the central unit cell. All QM calculations were carried out using the Gaussian09 program.40
The EE-GMF method for periodic molecular crystals is similar to the binary-interaction method (BIM).30,31,41 The major difference in the BIM method is that in EE-GMF, the distant two-body interaction is treated by classical Coulomb interactions to achieve a linear scale for high-level ab initio calculation. The Gibbs free energy per unit cell, G, at temperature T was calculated by,
| | |
G = E + PV + Uv − TSv
| (2) |
where
E,
V,
Uv,
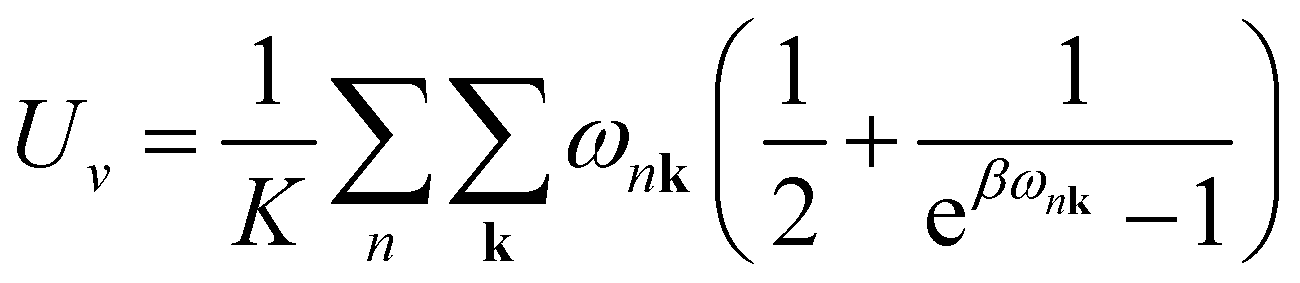
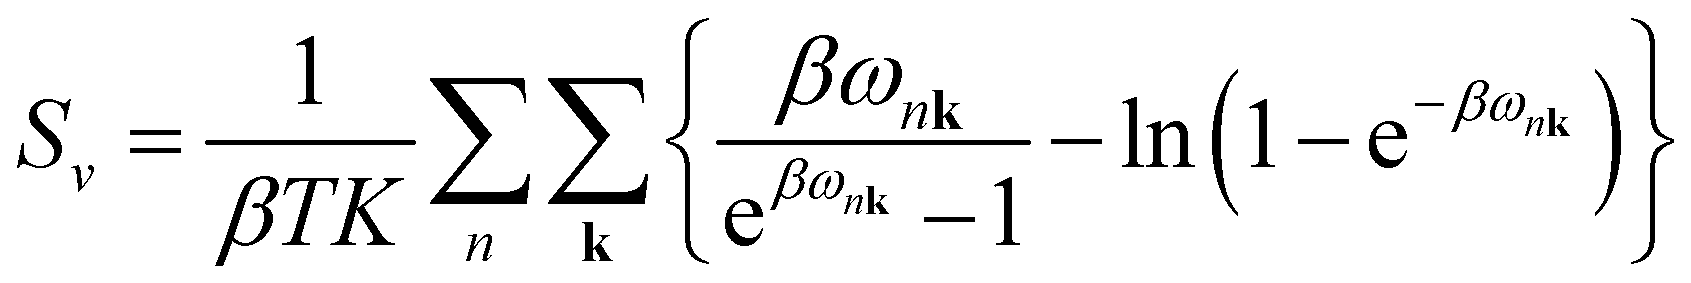
Sv are the internal electronic energy, volume, zero-point vibrational energy and vibrational entropy per unit cell, respectively. For a molecular crystal,
Uv and
Sv were obtained using
eqn (3) and
(4) with the harmonic approximation,
| |
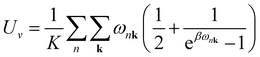 | (3) |
| |
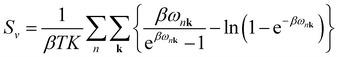 | (4) |
where
β = (
kBT)
−1,
kB is the Boltzmann constant, and
ωnk is the frequency of the phonon in the
nth phonon branch with the wave vector
k. The product over
k must be taken over all
K evenly spaced grid points of
k in the reciprocal unit cell. In this study, the
k-grid of 21 × 21 × 21 was used (
K = 9261).
4.2. Raman intensity calculation
In this study, the molecular crystal structures were optimized by employing the quasi-Newton algorithm. The BFGS procedure was adopted to update the approximate Hessian matrix. Moreover, we obtained the second derivative of the energy per unit cell with respect to the atomic positions of the optimized molecular crystal as| |
 | (5) |
The dynamical force constant matrix of a periodic system can be expressed as
| |
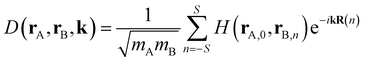 | (6) |
where
k defines a given point in the Brillouin zone, and
H(
rA,0,
rB,n) stands for the second-order derivative of the total energy per unit cell with respect to atom A in the 0th cell and atom B in the
nth cell at the equilibrium geometry, which could be obtained from
eqn (5). In addition,
mA and
mB represent the mass of atom A and atom B, respectively. The number of neighboring unit cells was truncated at
S = 5, and the number of k-points was set to 10 in each of the
x,
y,
z dimensions. Once the dynamical matrix of a periodic system is available, one can obtain the vibrational frequencies as well as the corresponding normal modes by diagonalizing
D(
rA,
rB,
k). In simulating the Raman spectra, only the Raman-active vibrations at
k = 0 can be treated. Therefore, the force-constant matrix
D(0) of the central unit cell was used for the vibrational frequency calculation of the Raman spectra, and the Raman intensity was calculated using the expressions below
| |
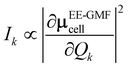 | (7) |
| |
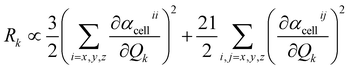 | (8) |
The dipole moment μEE-GMFcell and the polarizability αcellij of the central unit cell were also derived based on the EE-GMF31 approach.
Conflicts of interest
There are no conflicts to declare.
Acknowledgements
The authors are grateful for the financial support provided by the National Natural Science Foundation of China (No. 51672176, 21901157, 21922301, 21761132022, and 21703289), the National Key R&D Program of China (No. 2016YFA0501700), the Intergovernmental International Scientific and Technological Cooperation of Shanghai (No. 17520710200), the Shanghai Municipal Natural Science Foundation (No. 18ZR1412600), the Young Top-Notch Talent Support Program of Shanghai, and the NYU-ECNU Center for Computational Chemistry at NYU Shanghai. We thank Professor So Hirata (from the University of Illinois at Urbana-Champaign) for his support and guidance on this project.
References
- H. Mark and E. Pohland XVI, Das Gitter des festen Kohlendioxyds, Z. Kristallogr. - Cryst. Mater., 1925, 61, 293–298 CAS.
- N. Jacobi and O. Schnepp, Empirical intermolecular potentials for N2 and CO2 from crystal data, J. Chem. Phys., 1973, 58, 3647–3651 CrossRef CAS.
- T. G. Gibbons and M. L. Klein, Thermodynamic properties for a simple model of solid carbon dioxide: Monte Carlo, cell model, and quasiharmonic calculations, J. Chem. Phys., 1974, 60, 112–126 CrossRef CAS.
- K. Kobashi and T. Kihara, Molecular librations of solid CO2 under high pressure based on Kihara core potentials, J. Chem. Phys., 1980, 72, 3216–3220 CrossRef CAS.
- A. Simon and K. Peters, Single-crystal refinement of the structure of carbon dioxide, Acta Crystallogr., Sect. B: Struct. Sci., 1980, 36, 2750–2751 CrossRef.
- R. C. Hanson and L. H. Jones, Infrared and Raman studies of pressure effects on the vibrational modes of solid CO2, J. Chem. Phys., 1981, 75, 1102–1112 CrossRef CAS.
- H. Olijnyk, H. Däufer, H. J. Jodl and H. D. Hochheimer, Effect of pressure and temperature on the Raman spectra of solid CO2, J. Chem. Phys., 1988, 88, 4204–4212 CrossRef CAS.
- R. D. Etters and B. Kuchta, Static and dynamic properties of solid CO2 at various temperatures and pressures, J. Chem. Phys., 1989, 90, 4537–4541 CrossRef CAS.
- R. J. Hemley, H.-K. Mao and O. Tschauner, New transformations of CO2 at high pressures and temperatures, Phys. Rev. Lett., 2001, 87, 075701 CrossRef PubMed.
- V. Iota, C.-S. Yoo, J.-H. P. Klepeis, Z. Jenei, W. J. Evans and H. Cynn, Six-fold coordinated carbon dioxide VI, Nat. Mater., 2007, 6, 34–38 CrossRef CAS PubMed.
- J. A. Montoya, R. Rousseau, M. Santoro, F. A. Gorelli and S. Scandolo, Mixed threefold and fourfold carbon coordination in compressed CO2, Phys. Rev. Lett., 2008, 100, 163002 CrossRef PubMed.
- C.-S. Yoo, A. Sengupta and M. Kim, Phase diagram of carbon dioxide: update and challenges, High Pressure Res., 2011, 31, 68–74 CrossRef CAS.
- B. Olinger, The compression of solid CO2 at 296 K to 10 GPa, J. Chem. Phys., 1982, 77, 6255–6258 CrossRef CAS.
- R. C. Hanson, A new high-pressure phase of solid CO2, J. Chem. Phys., 1985, 89, 4499–4501 CrossRef CAS.
- K. Aoki, H. Yamawaki, M. Sakashita, Y. Gotoh and K. Takemura, Crystal structure of the high-pressure phase of solid CO2, Science, 1994, 263, 356–358 CrossRef CAS PubMed.
- V. Giordano and F. Datchi, Molecular carbon dioxide at high pressure and high temperature, Europhys. Lett., 2007, 77, 46002 CrossRef.
- V. Iota and C.-S. Yoo, Phase diagram of carbon dioxide: evidence for a new associated phase, Phys. Rev. Lett., 2001, 86, 5922–5925 CrossRef CAS PubMed.
- W. Sontising, Y. N. Heit, J. L. Mckinley and G. J. O. Beran, Theoretical predictions suggest carbon dioxide phases III and VII are identical, Chem. Sci., 2017, 8, 7374–7382 RSC.
- X. He, T. Zhu, X. Wang, J. Liu and J. Z. H. Zhang, Fragment quantum mechanical calculation of proteins and its applications, Acc. Chem. Res., 2014, 47, 2748–2757 CrossRef CAS PubMed.
- S. Hirata, K. Gilliard, X. He, J. Li and O. Sode, Ab initio molecular crystal structures, spectra, and phase diagrams, Acc. Chem. Res., 2014, 47, 2721–2730 CrossRef CAS PubMed.
- S. Grimme, Accurate description of van der Waals complexes by density functional theory including empirical corrections, J. Comput. Chem., 2004, 25, 1463–1473 CrossRef CAS PubMed.
- A. v. Lilienfeld, I. Tavernelli, U. Rothlisberger and D. Sebastiani, Optimization of effective atom centered potentials for london dispersion forces in density functional theory, Phys. Rev. Lett., 2004, 93, 153004 CrossRef PubMed.
- I.-C. Lin, M. D. Coutinho-Neto, C. Felsenheimer, A. v. Lilienfeld, I. Tavernelli and U. Rothlisberger, Library of dispersion-corrected atom-centered potentials for generalized gradient approximation functionals: elements H, C, N, O, He, Ne, Ar, and Kr, Phys. Rev. B: Condens. Matter Mater. Phys., 2007, 75, 1–5 Search PubMed.
- O. Karalti, X. Su, W. A. Saidi and K. D. Jordan, Correcting density functionals for dispersion interactions using pseudopotentials, Chem. Phys. Lett., 2014, 591, 133–136 CrossRef CAS.
- L. Maschio, D. Usvyat, F. R. Manby, S. M. Casassa, C. Pisani and M. Schutz, Fast local-MP2 method with density-fitting for crystals I. Theory and algorithms, Phys. Rev. B: Condens. Matter Mater. Phys., 2007, 76, 075101 CrossRef.
- D. Usvyat, L. Maschio, F. R. Manby and S. M. Casassa, Fast local-MP2 method with density-fitting for crystals. II. Test calculations and application to the carbon dioxide crystal, Phys. Rev. B: Condens. Matter Mater. Phys., 2007, 76, 075102 CrossRef.
- M. D. Ben, J. Hutter and J. VandeVondele, Second-order Møller-Plesset perturbation theory in the condensed phase: an efficient and massively parallel Gaussian and plane waves approach, J. Chem. Theory Comput., 2012, 8, 4177–4188 CrossRef PubMed.
- M. D. Ben, J. Hutter and J. VandeVondele, Electron correlation in the condensed phase from a resolution of identity approach based on the Gaussian and plane waves scheme, J. Chem. Theory Comput., 2013, 9, 2654–2671 CrossRef PubMed.
- A. Hermann and P. Schwerdtfeger, Ground-state properties of crystalline ice from periodic Hartree-Fock calculations and a coupled-cluster-based many-body decomposition of the correlation energy, Phys. Rev. Lett., 2008, 101, 183005 CrossRef PubMed.
- S. Hirata, Fast electron-correlation methods for molecular crystals: an application to the alpha, beta(1), and beta(2) modifications of solid formic acid, J. Chem. Phys., 2008, 129, 204104 CrossRef PubMed.
- X. He, O. Sode, S. S. Xantheas and S. Hirata, Second-order many-body perturbation study of ice Ih, J. Chem. Phys., 2012, 137, 204505 CrossRef PubMed.
- O. Sode and S. Hirata, Second-order many-body perturbation study of solid hydrogen fluoride under pressure, Phys. Chem. Chem. Phys., 2012, 14, 7765–7779 RSC.
- H. Olijnyk and A. P. Jephcoat, Vibrational studies on CO2 up to 40 GPa by Raman spectroscopy at room temperature, Phys. Rev. B: Condens. Matter Mater. Phys., 1998, 57, 879–888 CrossRef CAS.
- V. Giordano, F. Datchi and A. Dewaele, Melting curve and fluid equation of state of carbon dioxide at high pressure and high temperature, J. Chem. Phys., 2006, 125, 054504 CrossRef PubMed.
- K. D. Litasov, A. F. Goncharov and R. J. Hemley, Crossover from melting to dissociation of CO2 under pressure: implications for the lower mantle, Earth Planet. Sci. Lett., 2011, 309, 318–323 CrossRef CAS.
- J. Liu, L. Qi, J. Z. H. Zhang and X. He, Fragment quantum mechanical method for large-sized ion-water clusters, J. Chem. Theory Comput., 2017, 13, 2021–2034 CrossRef CAS PubMed.
- J. Liu, X. He, J. Z. H. Zhang and L. Qi, Hydrogen-bond structure dynamics in bulk water: insights from ab initio simulations with coupled cluster theory, Chem. Sci., 2017, 9, 2065–2073 RSC.
- J. Liu, X. He and J. Z. H. Zhang, Structure of liquid water – a dynamical mixture of tetrahedral and 'ring-and-chain' like structures, Phys. Chem. Chem. Phys., 2017, 19, 11931–11936 RSC.
- J. Liu and X. He, Accurate prediction of energetic properties of ionic liquid clusters using a fragment-based quantum mechanical method, Phys. Chem. Chem. Phys., 2017, 19, 20657–20666 RSC.
- M. J. Frisch, G. W. Trucks, H. B. Schlegel, G. E. Scuseria, M. A. Robb, J. R. Cheeseman, G. Scalmani, V. Barone, B. Mennucci, G. A. Petersson, H. Nakatsuji, M. Caricato, X. Li, H. P. Hratchian, A. F. Izmaylov, J. Bloino, G. Zheng, J. L. Sonnenberg, M. Hada, M. Ehara, K. Toyota, R. Fukuda, J. Hasegawa, M. Ishida, T. Nakajima, Y. Honda, O. Kitao, H. Nakai, T. Vreven, J. A. Montgomery Jr, J. E. Peralta, F. Ogliaro, M. J. Bearpark, J. Heyd, E. N. Brothers, K. N. Kudin, V. N. Staroverov, R. Kobayashi, J. Normand, K. Raghavachari, A. P. Rendell, J. C. Burant, S. S. Iyengar, J. Tomasi, M. Cossi, N. Rega, N. J. Millam, M. Klene, J. E. Knox, J. B. Cross, V. Bakken, C. Adamo, J. Jaramillo, R. Gomperts, R. E. Stratmann, O. Yazyev, A. J. Austin, R. Cammi, C. Pomelli, J. W. Ochterski, R. L. Martin, K. Morokuma, V. G. Zakrzewski, G. A. Voth, P. Salvador, J. J. Dannenberg, S. Dapprich, A. D. Daniels, Ö. Farkas, J. B. Foresman, J. V. Ortiz, J. Cioslowski, and D. J. Fox, Gaussian 09 C.01, Gaussian, Inc., Wallingford, CT, USA, 2009 Search PubMed.
- J. Li, O. Sode, G. A. Voth and S. Hirata, A solid–solid phase transition in carbon dioxide at high pressures and intermediate temperatures, Nat. Commun., 2013, 4, 141–155 Search PubMed.
|
| This journal is © The Royal Society of Chemistry 2020 |
Click here to see how this site uses Cookies. View our privacy policy here. 
 Open Access Article
 This Open Access Article is licensed under a Creative Commons Attribution-Non Commercial 3.0 Unported Licence
 *bc and
Jinjin Li
*bc and
Jinjin Li