 Open Access Article
Biomethane generation from biogas upgrading by means of thin-film composite membrane comprising Linde T and fluorinated polyimide: optimization of fabrication parameters
Norwahyu Jusoh *ab,
Yin Fong Yeongb,
Serene Sow Mun Lockbc,
Li Sze Laid and
Malik Shoaib Sulemane
aCentre for Contaminant Control & Utilization (CenCoU), Chemical Engineering Department, Universiti Teknologi PETRONAS, 32610 Bandar Seri Iskandar, Perak, Malaysia. E-mail: norwahyu.jusoh@utp.edu.my; Fax: +605-3656176; Tel: +605-3687614
bCO2 Research Centre (CO2RES), Chemical Engineering Department, Universiti Teknologi PETRONAS, 32610 Bandar Seri Iskandar, Perak, Malaysia
cChemical Engineering Discipline, School of Engineering, Monash University Malaysia, Jalan Lagoon Selatan, 47500 Bandar Sunway, Selangor, Malaysia
dChemical and Petroleum Engineering Department, Faculty of Engineering, Technology and Built Environment, UCSI University Kuala Lumpur Campus, Jalan Mandarina Damai 1, 56000 Bandar Cheras, Kuala Lumpur, Malaysia
eDepartment of Chemical Engineering, Sharif College of Engineering & Technology, Jati Umrah, Raiwind Road, Lahore, Pakistan
First published on 22nd January 2020
Abstract
Generation of biogas from organic substances is an attractive evolution of energy generation from fossil-based energy supply to renewable resources. In order to exhibit viability in terms of technical execution while being economically feasible, successful purification strategies for biomethane formation must be applicable to industrial gas streams at realistic pressures and temperatures. Membrane-based upgrading technologies have great potential to promote biogas processes because they involve less energy and low maintenance. However, the development of membranes with good polymer-filler contact and minimum defects remains a great challenge. Hitherto, researchers have been making many attempts at developing an established route to fabricate thin-film composite membranes. In the present work, an innovative coupling between Linde T and fluorinated polyimide was employed for biogas upgrading. A facile technique for membrane fabrication was proposed via optimization of the fabrication parameters. The results indicated that composite membrane fabricated with 2 hours of total dispersion duration demonstrated a homogeneous distribution of Linde T particles in the fluorinated polyimide matrix and improved the separation characteristics by up to 172% in upgrading biomethane quality. Thus, the fabricated membrane is feasible to be employed for large-scale and lucrative production with enhanced performance in biogas purification via the feasible fabrication method employed in this work.
1 Introduction
The current alarming phenomenon in the shortage of the global energy market has diverted attention towards increasing the production of renewable energy from geothermal, wind, waste, biomass and solar sources in order to meet the needs of global energy consumption.1 As a result of the soaring costs of conventional fuels, anaerobic digestion of biological resources is identified as a promising alternative energy carrier as it is clean, environmentally benign and cheap.2 Biogas generated via anaerobic digestion normally consists of 50–70% of CH4, 25–50% of CO2 and other gases including N2, H2S, siloxane and halides.3 Efficiency of current biogas production processes is restricted due to gas streams being produced with dilute content of CH4. Thus, biogas enrichment is a critical downstream stage which accounts for the overall production success. The biogas upgrading process comprises the removal of CO2 and other impurities to afford biomethane with higher CH4 concentration and heating value that can be subsequently utilized for combined heat and power engines and natural gas substitution.4In industrial practice, biogas purification can be accomplished using available technologies including adsorption, cryogenic, absorption and membrane separations. The shortcomings of large footprint, high cost consumption, solvent flow problems and high energy required by absorption, adsorption and cryogenic processes have provoked interest in membrane technology as an alternative means of recovery of biomethane.5 The first establishment of membranes for biogas enrichment plant was commercialized in 1990 and the application of membranes in upgrading biogas has led to more researchers to explore membrane materials with advanced gas transport properties for the purification process, which ultimately favors environmental and energy-related processes as an end result.6
For biogas upgrading processes, membrane materials that demonstrate good mechanical strength as well as superior gas permeability and gas pair selectivity are anticipated. Membranes are commonly prepared through a combination of polymeric materials, e.g. polysulfone, cellulose triacetate, and polycarbonate, and inorganic materials such as silica, zeolite, carbon molecular sieves and metal organic frameworks.7 Despite the advantage that a polymeric membrane is easy to form that has a cost benefit, this material suffers from a universal trade-off relationship between gas permeability and selectivity as discovered by Robeson.8 In addition, inorganic membranes have also been examined for gas separation due to their promising characteristics such as high permeability and selectivity, and good thermal and chemical stability. Nevertheless, inorganic membranes are expensive and complicated to fabricate and scale up in comparison to polymeric membranes.9 Hence, researches have been devoted to fabrication of membrane materials which could preserve the good traits of both polymeric and inorganic membranes.
Composite membranes have been developed by incorporating dispersed fillers into the polymer phase to overcome the aforementioned drawbacks and also to enhance separation performances of the membranes which can be subsequently employed for industrial applications including biogas cleaning.10,11 The selections of polymer and filler are crucial to ensure a good polymer-filler compatibility which can subsequently improve gas separation performance of the resultant composite membranes in biogas purification. The utilization of polyimides as a continuous phase in the fabrication of composite membranes has been increasing steadily owing to their excellent physicochemical and mechanical behaviors.12 Present trends show that fluorinated polyimide is an attractive material for fabrication into composite membranes because of its remarkable separation performance including high chemical, mechanical and thermal stability and solvent resistance attributes.13 The presence of bulky methyl groups and –C(CF3)2– in the backbone of the polymer hinders local segmental mobility and impedes interchain packing, which result in the enhancement of separation performance through bigger free channels for gas transport.14,15
Zeolites are inorganic fillers, which have been widely studied by researchers for biogas purification processes.7,16–18 Zeolites are porous crystalline compounds, containing elements of Al and Si with cations like Ca, K, Na and Mg, which are arranged in a tetrahedral structure. The properties of zeolites, such as uniform charge distribution, well-defined pore size, high porosity and high specific area, make them appealing candidates for the removal of CO2 from raw biogas.19,20 A-type zeolites, Faujasite (zeolite X and Y), Zeolite Socony Mobil-5 (ZSM-5), and SAPO-34 are types of zeolites which have been widely used in the fabrication of composite membranes for biogas purification. For instance, Sen et al.21 reported the enhancement of CO2/CH4 selectivity from 23.6 to 37.6 by embedding 30% of zeolite 4A into a polycarbonate polymer phase. Furthermore, Amooghin et al.22 found that by embedding 5% of zeolite Y in a Matrimid®5218 membrane, both CO2 permeability and CO2/CH4 selectivity were enhanced in comparison to the pristine membrane. Furthermore, the amalgamation of SAPO-34 into a polysulfone matrix has been reported by Junaidi et al.23 They discovered that a membrane composed of 5 wt% SAPO-34 particles significantly improved selectivity in removing CO2 from raw biogas of up to 30% relative to a pure polysulfone membrane.
Even though the separation performances of zeolite-based composite membranes were improved, most of the reported performances are still unable to meet expectation with regards to tradeoff between permeability and selectivity.24–26 Hence, to address these bottlenecks, it is crucial to explore a new combination of zeolite and polymer matrix. Linde T has been identified as one of the potential materials for biogas upgrading due to its desirable traits including great tolerance towards acids and solvents, good thermal stability, and ability to interact with adsorbates at low pressure or concentration.27 In addition, the presence of heterogeneous cations in Linde T offers a stronger interaction for CO2 because it exhibits higher quadrupole moment and polarizability as compared to biomethane, which consequently leads to a higher affinity for the CO2 adsorption process.28 Moreover, the Linde T structure is made up of 8-membered oxygen rings, which contribute to a small pore size of 0.36 nm × 0.51 nm, further contributing to greater separation of gases including CO2 from biomethane.29 For example, Mirfendereski et al.30 reported a selectivity for a Linde T membrane of up to 70.8 in removing CO2 from CH4. Hence, the promising reported separation performance for Linde T has motivated the present work to further elucidate the potential of Linde T as an inorganic filler in the fabrication of composite membranes for capturing CO2 from raw biogas.
In addition, although enhancement of gas separation performance has been reported via application of zeolite-based composite membranes, the distribution of fillers in the polymer phase remains a severe challenge in producing membranes, requiring further understanding of the fabrication parameters. Indeed, most of the researches reported on composite membranes have been dedicated to merely studying the enhancement of permeability and selectivity of the membranes,31–33 whereas studies on finding an appropriate approach for the formation of zeolite-based composite membranes via optimization of the fabrication parameters have been scarce. A thorough attempt at examining the fabrication variables in detail can have a substantial influence on the formation of membranes. This is because fabrication of composite membranes with excellent quality involves stringent settings during processing, meaning that the approaches to fabricate composite membranes are relatively tiresome, tedious, and normally not economically viable. Thus, these challenges need to be overcome in order to obtain the preferred membrane characteristics of high reproducibility and to improve gas separation properties for biogas upgrading processes.
Hence, elucidation of the basic parameters, which include dispersion duration of filler in solvent and polymer solution during fabrication of composite membranes, is discussed in the present work. The physicochemical properties of the resulting composite membranes were analyzed using various analytical tools. Furthermore, permeation properties of the resultant membranes in upgrading biomethane were also examined. To the best of our knowledge, studies on the combination of Linde T and fluorinated polyimide polymer for biogas upgrading are yet to be reported.
2 Experimental method
2.1 Materials
Synthesis of Linde T required potassium hydroxide (KOH, 85 wt%, Merck), precipitated silica (SiO2, 99.8 wt%, Aldrich), sodium hydroxide (NaOH, 99 wt%, Merck), deionized water and sodium aluminate (NaAlO2, BDH [Na2O, 41 wt% + Al2O3, 54 wt%], Aldrich). All these chemicals were utilized without further purification. Meanwhile, for the preparation of fluorinated polymer, 4,4′-(hexafluoroisopropylidene)diphthalic anhydride (99% purity, Sigma-Aldrich), N-methyl-2-pyrrolidone (NMP) and 2,3,5,6-tetramethyl-p-phenylenediamine (99% trace metal basis, Sigma-Aldrich) were refined by vacuum sublimation, vacuum distillation and re-crystallization from methanol, respectively. Triethylamine (TEA, ≥99% purity, Merck), propionic anhydride (PA, ≥98% purity, Merck), dichloromethane (DCM, ≥99.8% purity, Sigma-Aldrich) solvent and methanol (≥99.9% purity, Merck) were used as received. All pure gases including methane (CH4, 99.99%) and carbon dioxide (CO2, 99.99%) as well as gas mixtures (CO2 50 vol% + CH4 50 vol%) for permeation experiments were acquired from Gas Walker Sdn Bhd and utilized as received.2.2 Synthesis of fluorinated polyimide
Fluorinated polyimide was synthesized using the chemical imidization method.34 Equimolar purified monomers were dissolved in refined NMP under nitrogen purge after stirring for 24 h to form polyamic acid (PAA) solution. For the chemical imidization process, TEA and PA with a molar ratio of 1![[thin space (1/6-em)]](https://www.rsc.org/images/entities/char_2009.gif) :
:![[thin space (1/6-em)]](https://www.rsc.org/images/entities/char_2009.gif) 4 were added slowly into the PAA solution. Then, the solution was further stirred for 24 h to form a polymer solution. The resultant polymer solution was suspended in methanol in order to remove unreacted monomers. The polymer was then washed with methanol prior to drying at 150 °C in a vacuum oven for 24 h. The reaction scheme for synthesizing fluorinated polyimide polymer and the chemical structure of the resultant polymer are shown in Fig. 1.35 The inherent viscosity and number-average molecular weight (Mn) of the synthesized fluorinated polymer were 0.64 dL g−1 and 59 000
4 were added slowly into the PAA solution. Then, the solution was further stirred for 24 h to form a polymer solution. The resultant polymer solution was suspended in methanol in order to remove unreacted monomers. The polymer was then washed with methanol prior to drying at 150 °C in a vacuum oven for 24 h. The reaction scheme for synthesizing fluorinated polyimide polymer and the chemical structure of the resultant polymer are shown in Fig. 1.35 The inherent viscosity and number-average molecular weight (Mn) of the synthesized fluorinated polymer were 0.64 dL g−1 and 59 000![[thin space (1/6-em)]](https://www.rsc.org/images/entities/char_2009.gif) g mol−1, respectively, which is in good agreement with the reported results in previously published literature.36
g mol−1, respectively, which is in good agreement with the reported results in previously published literature.36
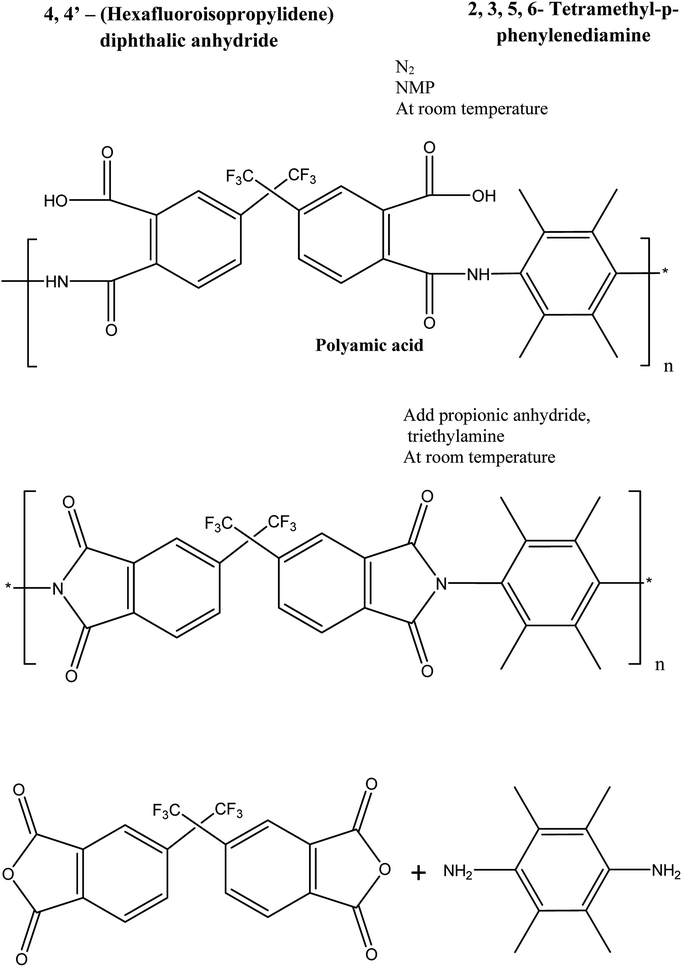 | ||
| Fig. 1 Schematic showing the formation of fluorinated polymer.35 | ||
2.3 Preparation of Linde T crystals
Linde T crystals were synthesized using a gel of SiO2![[thin space (1/6-em)]](https://www.rsc.org/images/entities/char_2009.gif) :
:![[thin space (1/6-em)]](https://www.rsc.org/images/entities/char_2009.gif) 0.04Al2O3
0.04Al2O3![[thin space (1/6-em)]](https://www.rsc.org/images/entities/char_2009.gif) :
:![[thin space (1/6-em)]](https://www.rsc.org/images/entities/char_2009.gif) 0.26Na2O
0.26Na2O![[thin space (1/6-em)]](https://www.rsc.org/images/entities/char_2009.gif) :
:![[thin space (1/6-em)]](https://www.rsc.org/images/entities/char_2009.gif) 0.09K2O
0.09K2O![[thin space (1/6-em)]](https://www.rsc.org/images/entities/char_2009.gif) :
:![[thin space (1/6-em)]](https://www.rsc.org/images/entities/char_2009.gif) 14H2O composition via hydrothermal growth coupled with ultrasonic irradiation. Firstly, deionized water was utilized to dissolve sodium hydroxide and potassium hydroxide. Later on, sodium aluminate was added into the solution before being stirred for 1 h. Precipitated silica was subsequently added into the solution progressively while being stirred for another 24 h. After that, ultrasonic treatment at a frequency of 40 kHz (SOLTEC, Model 2400 EP) was utilized to pretreat the solution for 1 h, prior to transferring the solution into a Teflon-lined stainless steel autoclave reactor. Inside the reactor, the solution was treated at 120 °C for 1 day to achieve hydrothermal growth. Finally, solid particles were collected through centrifugation and washed using deionized water prior to drying at 120 °C in an oven.
14H2O composition via hydrothermal growth coupled with ultrasonic irradiation. Firstly, deionized water was utilized to dissolve sodium hydroxide and potassium hydroxide. Later on, sodium aluminate was added into the solution before being stirred for 1 h. Precipitated silica was subsequently added into the solution progressively while being stirred for another 24 h. After that, ultrasonic treatment at a frequency of 40 kHz (SOLTEC, Model 2400 EP) was utilized to pretreat the solution for 1 h, prior to transferring the solution into a Teflon-lined stainless steel autoclave reactor. Inside the reactor, the solution was treated at 120 °C for 1 day to achieve hydrothermal growth. Finally, solid particles were collected through centrifugation and washed using deionized water prior to drying at 120 °C in an oven.
2.4 Preparation of virgin fluorinated polyimide membrane
Virgin fluorinated polyimide flat sheet membrane was fabricated by preparing a 2% (w/v) polymer solution using the solution casting method.37 Initially, the synthesized polymer was dissolved in DCM and left stirring which was completed within 1 h. Then, the mixture was filtered using a 1.0 μm PTFE membrane filter to eliminate any undesirable contaminants and debris. The solution was then cast in a Petri dish and covered with a glass plate to induce slow solvent evaporation. The membrane was dried in a conventional oven at 60 °C for 24 h prior to vacuum drying. In the vacuum oven, a drying protocol involving increasing the temperature to 250 °C utilizing a heating rate of 25°C h−1 was carried out, followed by annealing at 250 °C for 24 h.2.5 Fabrication of Linde T/fluorinated polyimide composite membranes
A composite membrane with 1 wt% Linde T in fluorinated polyimide phase was used as a benchmark for the study on the manipulation of dispersion duration of Linde T in DCM suspension under different stirring and sonication periods. The total filler dispersion duration was varied from 2 h to 8 h. Firstly, solutions of both fluorinated polyimide and Linde T were formulated in two separate vials. 1 wt% of Linde T crystals were added into DCM, stirred and sonicated successively for 1–4 h to disperse Linde T in DCM solution. In order to ensure consistency in the experimental works, the stirring process was conducted using a WiseStir MSH-20D magnetic stirrer with a 1.8 cm in length and 0.4 cm in diameter stirring bar, whereas sonication was conducted in an ultrasonication water bath operated at 40 kHz and 120 W throughout the experiments. Meanwhile, fluorinated polyimide was dissolved in DCM and the solution was filtered to eliminate any insoluble particles and undesirable impurities. Then, 10 wt% of fluorinated polyimide solution was primed into Linde T particle solution before stirring and sonification treatment. Subsequently, the stirring and sonification procedure was further continued for another 1–4 h after addition of the remaining bulk polyimide solution into the mixture. The mixture was then vigorously stirred before pouring the casting solution into a leveled and clean glass Petri dish. The speed of stirring and vigorous stirring for the preparation of all solutions were maintained consistent throughout the experiment. The formed membrane film was peeled off from the Petri dish with care before being sent for heat treatment, which has been elaborated in Section 2.4 describing the preparation of virgin fluorinated polyimide membrane. The composite membranes that were obtained by means of manipulation of fabrication parameters are summarized in Table 1.| Membrane sample | Filler dispersion duration | ||||
|---|---|---|---|---|---|
| Linde T in DCM | Linde T in fluorinated polyimide solution | Total dispersion duration (h) | |||
| Stirring (h) | Sonication (h) | Stirring (h) | Sonication (h) | ||
| S1 | 0.5 | 0.5 | 0.5 | 0.5 | 2 |
| S2 | 1 | 1 | 1 | 1 | 4 |
| S3 | 1 | 1 | 2 | 2 | 6 |
| S4 | 2 | 2 | 1 | 1 | 6 |
| S5 | 2 | 2 | 2 | 2 | 8 |
2.6 Characterization of fluorinated polyimide polymer, Linde T particles and membranes
The molecular weight of the synthesized fluorinated polyimide polymer was determined using gel permeation chromatography (GPC). A Waters HPLC 1500 series system equipped with a 2414 refractive index detector and Styragel HR columns was employed to perform GPC measurements. Tetrahydrofuran with a flow rate controlled at 1.0 mL min−1 was utilized as the solvent. A standard polystyrene sample of 0.004 wt% was used to calibrate the column. The value obtained for standard polystyrene was employed as a benchmark to determine molecular weights (g mol−1) of other solutions through comparison of retention time within the column via a calibration curve. In addition, an Ubbelohde-type capillary viscometer immersed in a water bath was used to obtain inherent viscosities of the synthesized polymers by transparent thermostats (Schott, CT 72). A sampling solution was obtained through dissolution of 0.25 g of polymer in 50 mL of NMP. The inherent viscosity is determined through eqn (1) as follows:38
 | (1) |
The physicochemical properties of the synthesized Linde T particles were analyzed via Brunauer–Emmett–Teller (BET) physisorption analysis, field emission scanning electron microscopy (FESEM), X-ray diffraction (XRD), Fourier transform infrared (FTIR) spectroscopy and thermogravimetric analysis (TGA). The surface area of synthesized particles was examined using a BET physisorption analyzer (BELSORP Mini II). The samples were degassed for 24 h in vacuum before measurement. FESEM (Zeiss Supra 55 VP operated at 10 kV) was employed to monitor the morphology and particle size of Linde T. Prior to analysis, a double-sided carbon tape was used to ensure the crystals were adhered to the top of the holder. A Bruker (USA) D8 Advance diffractometer equipped with a Cu Kα radiation source at a wavelength of 1.54059 Å was utilized to examine the crystalline structure of the crystals. The XRD pattern was acquired in the 2 theta range of 5°–30° with a step size of 0.02°. The chemical functionalities of Linde T particles were investigated via FTIR analysis using a PerkinElmer Spectrum One. The particles in powder form were homogenized with potassium bromide (KBr) before being compressed into pellet form at 10 MPa. The analytical technique was performed in transmittance mode, which ranged from 400 cm−1 to 4000 cm−1, using 50 scans, during which the temperature was maintained constant at room temperature. With regards to the thermal stability of Linde T particles, they were examined utilizing a PerkinElmer STA6000 TGA instrument. 15–20 mg of sample was positioned on an alumina pan prior to heating under air environment at a rate of 10°C min−1 from 50 °C to 800 °C.
In addition, the fabricated membranes were also analyzed by FESEM, energy dispersive X-ray (EDX), XRD, attenuated total reflection (ATR) FTIR spectroscopy, TGA and differential scanning calorimetry (DSC). The phase structure of membranes was determined by cutting the membrane samples into small portions and inspecting using XRD, adopting identical parameters to those used for the Linde T particle analysis as formerly explained. In addition, FESEM and EDX were employed to evaluate the morphology of the developed membranes through obtaining images of cross-sectional views and investigation of elemental compositions of the resultant membranes respectively. Cross sections of the membranes were obtained by submerging the samples in liquid nitrogen for several minutes before fracturing the film in order to prevent morphology distortion. All the membrane samples were subsequently sputter-coated with platinum using a Quorum Q150R S coater under vacuum condition for 60 s prior to imaging. The coating process was aimed at impeding charging of the membrane sample which could happen during analysis. In addition, the elemental compositions and distributions of Linde T particles in the membranes were ascertained using Oxford Instrument Inca (EDX).
Thermal stability of the membranes was investigated using TGA with the same instrument as described for Linde T particle analysis. For DSC, a TA Instruments DSC Q2000 was utilized to measure the glass transition temperature (Tg) of membrane samples. Two heating regimes were employed, which were (1) increasing the temperature at a heating rate of 10 °C min−1 to up to 450 °C under nitrogen environment and (2) initially quenching at a rate of 10°C min−1 followed by reheating at 10°C min−1 to complete the second heating run. The first cycle was conducted to erase all previous thermal history as well as to relax any molecular orientation captured during membrane formation. On the other hand, the second cycle of heating was used to obtain Tg profiles of the membrane samples. The functional groups in the membranes were investigated using FTIR spectroscopy operated in the ATR mode equipped with a diamond crystal, with 50 scans in the wavelength range of 650–4000 cm−1 in the transmission mode.
2.7 Biogas permeation measurements
The membrane samples were examined for biogas permeation including CO2 and CH4 single gas permeation and mixed gas comprising CH4 and CO2 at 30 °C and 3.5 bar by using an in-house gas permeation test rig. A detailed explanation pertaining to the setup of the permeation rig has been outlined in our previous work.39 The temperature and pressure were set based upon common operating conditions reported in the literature for ease of comparison.For each run, a membrane with effective area of 1.77 cm2 was mounted onto the membrane test cell. To ensure reproducibility, at least 3 membrane films were tested for gas permeation data, which were obtained from 3 independently cast membranes respectively. Before each permeation test, the film was vacuumed overnight after the membrane was placed onto the test cell. This was aimed at fully degassing the system before proceeding with the experiment in order to ensure high accuracy of the obtained data. The procedures for biogas permeation testing were repeated three times in order to evaluate the repeatability of the gas separation performance of the membrane. The permeabilities of CH4 and CO2 single gases were then calculated through eqn (2), as follows:40
 | (2) |
The ideal selectivity of the membrane was calculated using eqn (3) as follows:41
 | (3) |
The membrane with optimum separation performance in single gas permeations was further tested in mixed biogas separation and plasticization study. To perform CO2 plasticization study, CO2 permeability was examined through incremental feed pressure which was periodically elevated from 3.5 to 25 bar. Since the current study addresses high-pressure conditions, non-ideal gas effects should be considered. The driving force for this case is described as the distinction in fugacity from the high to low end across the membrane. A non-ideal equation of state has been employed to compute fugacity of CO2 through adaptation of Thermosolver software according to the Peng–Robinson equation of state.42,43 Thus, the permeability of CO2 was determined based on eqn (4) as follows:39
 | (4) |
Furthermore, mixed biogas permeation of composite membranes was carried out using 64% CO2 and 36% CH4 mixtures at temperature and pressure of 30 °C and 3.5 bar, respectively. In this test, the feed, permeate and retentate gas streams were injected into a gas chromatograph, PerkinElmer model 2103, which was furnished with a thermal conductivity detector for composition analysis. Prior to measurement, the gas chromatograph was calibrated with known compositions of CO2/CH4 gas mixture in order to obtain the gas peak area ratio as a function of gas mole fractions. The permeability of CO2 and CH4 in biogas mixture was determined based on the eqn (5) and (6) as follows:9
 | (5) |
 | (6) |
The selectivity for mixed biogas measurement was then assessed based on eqn (7) as follows:44
 | (7) |
3 Results and discussion
3.1 Characterization of virgin fluorinated polyimide membrane and Linde T-based composite membranes
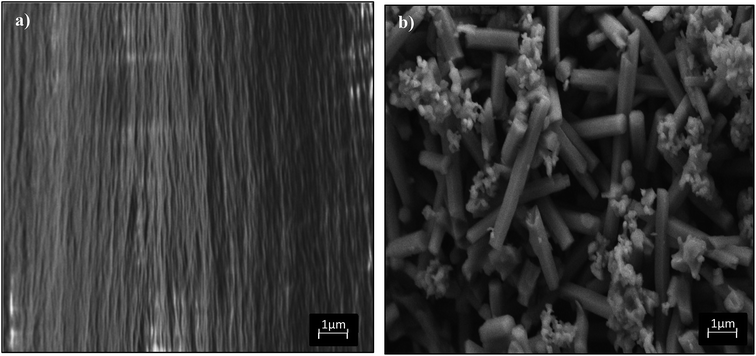 | ||
| Fig. 3 FESEM images of (a) virgin fluorinated polyimide membrane and (b) Linde T crystals prepared in the current research. | ||
Fig. 4 and 5 show the cross-section and bottom-layer images of the resultant Linde T/fluorinated polyimide composite membranes fabricated using different fabrication parameters, respectively. Meanwhile, Fig. 6 demonstrates the EDX mapping from the cross sections of the membranes. Since Linde T particles mainly consist of silicon element, the EDX analysis was conducted by mapping the occurrence of Si element in the membranes, which is representative of the distribution of Linde T particles in the polymer phase. Referring to Fig. 4 and 5, the FESEM images of all the composite membrane samples demonstrate that the Linde T crystals are embedded in the fluorinated polyimide phase.
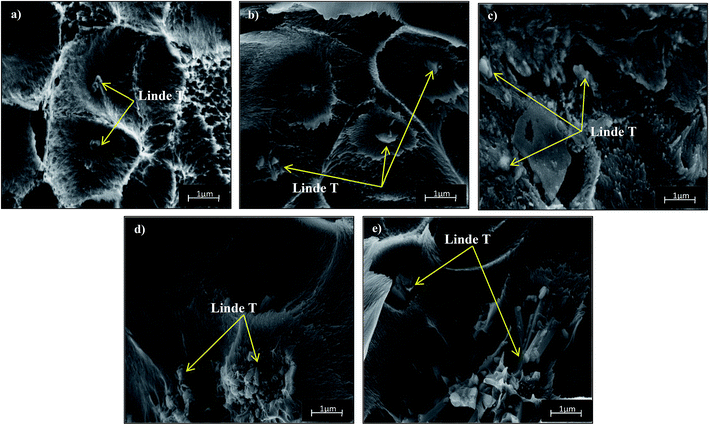 | ||
| Fig. 4 Cross-section images of Linde T/fluorinated polyimide composite membranes fabricated with different filler dispersion durations: (a) S1, (b) S2, (c) S3, (d) S4 and (e) S5. | ||
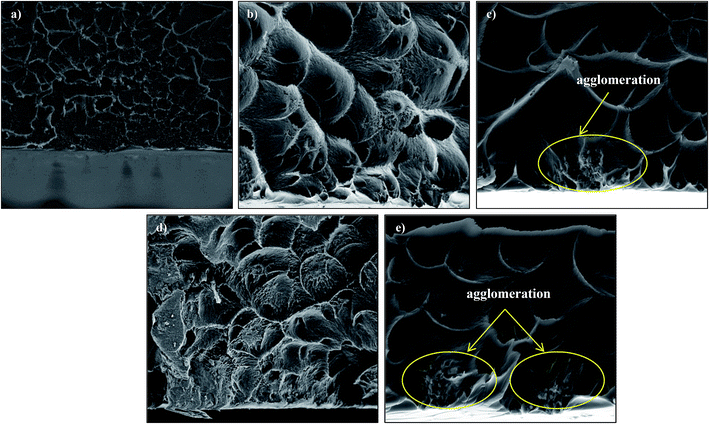 | ||
| Fig. 5 Bottom-layer FESEM images of Linde T/fluorinated polyimide composite membranes fabricated with different filler dispersion durations: (a) S1, (b) S2, (c) S3, (d) S4 and (e) S5. | ||
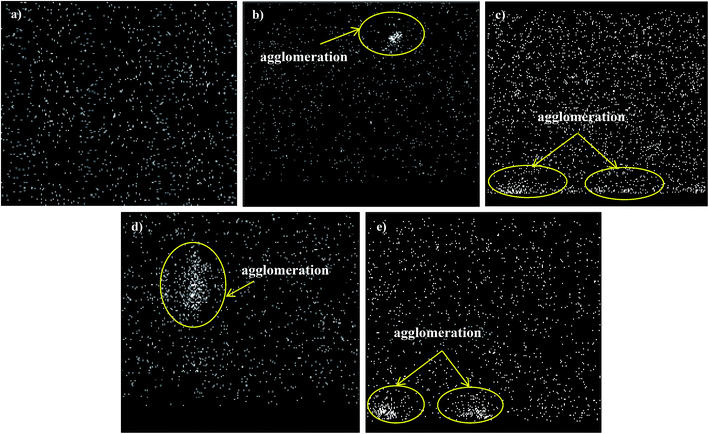 | ||
| Fig. 6 EDX mapping for Si element from the cross sections of Linde T/fluorinated polyimide composite membranes: (a) S1, (b) S2, (c) S3, (d) S4 and (e) S5. | ||
Based on the FESEM image of S1 sample in Fig. 4(a), it is revealed that Linde T particles are uniformly dispersed in the polymeric matrix. This suggests that an excellent compatibility between Linde T and fluorinated polyimide phase has been attained. This finding was further confirmed by the homogeneous dispersion of Si element in EDX mapping as demonstrated in Fig. 6(a). Nevertheless, as the duration of filler dispersion rises from 2 h to 4 h (S2), the FESEM image of S2 membrane in Fig. 4(b) exhibits the occurrence of small-scale particle clumping phenomenon due to the aggregation of Linde T particles in the polymeric phase. The existence of void space between Linde T particles and fluorinated polyimide matrix is also not pronounced in the resultant membrane. Even though formation of voids and sedimentation are not found in the FESEM images shown in Fig. 4 and 5, slight agglomeration of Linde T particles in the polymer matrix can be seen in the EDX mapping image in Fig. 6(b). The minor agglomeration of Linde T particles in S2 membrane is anticipated because of the ripening effect, which is attributed to sonication during membrane fabrication. During the course of sonication, the collapse of cavitation bubbles leads to shockwave impacts and interparticle collisions that can lead to particle breakage and particle size reduction.47 Subsequently, this phenomenon induces the dissolution of smaller particles and increase the tendency of small particles to clump together and form larger particles as an ultimate result.48 Therefore, it is expected that two processes, sonofragmentation and Ostwald ripening, might occur simultaneously when the duration of sonication increases.49,50
In addition, prolonging the duration of stirring and sonication to 6 h increases the aggregation of Linde T particles with the confirmation shown in Fig. 4(c) and (d) for S3 and S4 membranes, respectively. In fact, this observation is intuitively reasonable since an increase in the duration of stirring and sonication customarily induces the formation of particle clumps and larger particles due to the ripening effect as elaborated earlier. In addition, based on EDX mapping images in Fig. 6(c) and (d), it could be observed that a small amount of Linde T particles are moved, clustered and settled at the bottom layer of S3; meanwhile, the agglomeration of Linde T particles in the polymer phase can be seen in S4. These results demonstrate a comparatively reduced particle dispersion of Linde T particles in the fluorinated polyimide phase for S3 and S4 membranes.
Nevertheless, when the filler dispersion duration increases to 8 h (S5), apparent agglomeration and sedimentation of the Linde T particles in the fluorinated polyimide polymer phase are observed with the appearance of pinholes and voids in the membrane as shown in Fig. 4(e) and 5(e). This result is evidence of heterogeneous distribution of Linde T particles in the polymer matrix, which could subsequently form channels for unselective gas transport. Furthermore, a poor dispersion of Linde T particles in the polymer matrix is further demonstrated in Fig. 6(e) through EDX mapping image. Overall, based on the results obtained, 2 h duration of filler dispersion creates better blending and homogeneity of Linde T in the polymer phase than the longer durations of stirring and sonication.
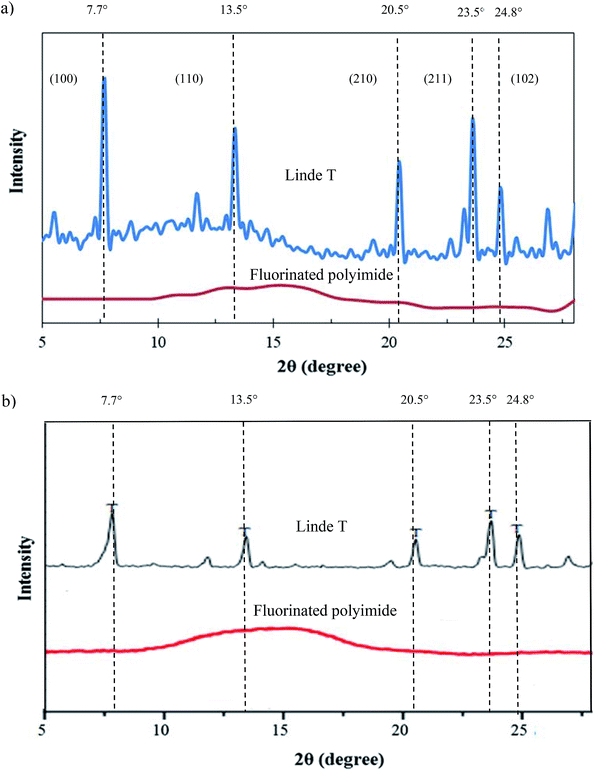 | ||
| Fig. 7 XRD patterns of Linde T particles and virgin fluorinated polyimide membrane (a) fabricated in the current work and (b) reported in the literature.53,54 | ||
Fig. 8 demonstrates the FTIR spectrum of Linde T particles and ATR-FTIR spectra for virgin fluorinated polyimide and Linde T-based composite membranes fabricated at different filler dispersion durations. Based on Fig. 8, Linde T particles demonstrate characteristic peaks at 720–775 cm−1 and 1040–1150 cm−1. The peaks in the region of 720–775 cm−1 represent the symmetric stretching vibrations of double ring for the Linde T structure.54 On the other hand, asymmetric stretching vibrations are characterized by the peaks at 1040–1150 cm−1.55 The characteristic peaks of Linde T particles observed in this research were in good accordance with FTIR result revealed for Linde T structure in the published literature.56
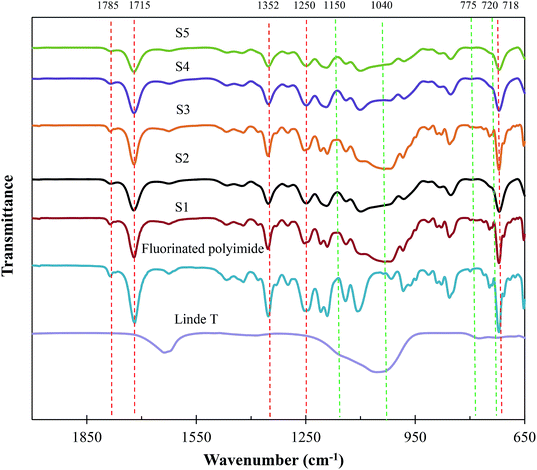 | ||
| Fig. 8 ATR-FTIR analysis of Linde T particles, virgin fluorinated polyimide membrane and Linde T/fluorinated polyimide composite membranes fabricated at different filler dispersion durations (S1–S5). | ||
Meanwhile, it can be observed from Fig. 8 that the ATR-FTIR spectrum for virgin fluorinated polyimide membrane exhibits peaks at 718 cm−1, 1250 cm−1, 1352 cm−1, 1715 cm−1 and 1785 cm−1. The peak at 718 cm−1 is attributed to the imide ring or the imide carbonyl group. Meanwhile, imide group C–N stretch and C–F stretch in CF3 group are characterized by the peaks at 1352 cm−1 and 1250 cm−1, respectively. In addition, the C![[double bond, length as m-dash]](https://www.rsc.org/images/entities/char_e001.gif) O symmetric and asymmetric stretch of imide group are indicated by the bands at 1715 cm−1 and 1785 cm−1, respectively. The characteristic peaks of fluorinated polyimide membrane are in agreement with those IR peaks recorded in the literature for the fluorinated polyimide structure.34,57,58
O symmetric and asymmetric stretch of imide group are indicated by the bands at 1715 cm−1 and 1785 cm−1, respectively. The characteristic peaks of fluorinated polyimide membrane are in agreement with those IR peaks recorded in the literature for the fluorinated polyimide structure.34,57,58
On the other hand, the spectra of the composite membranes exhibit the characteristics of both Linde T and fluorinated polyimide with no apparent changes in absorption bands as compared to the Linde T particles and virgin fluorinated polyimide membrane. This outcome demonstrates that the fabrication of composite membranes at different filler dispersion durations did not alter the interaction between functional groups of Linde T particles and polymer matrix in the resultant composite membranes.
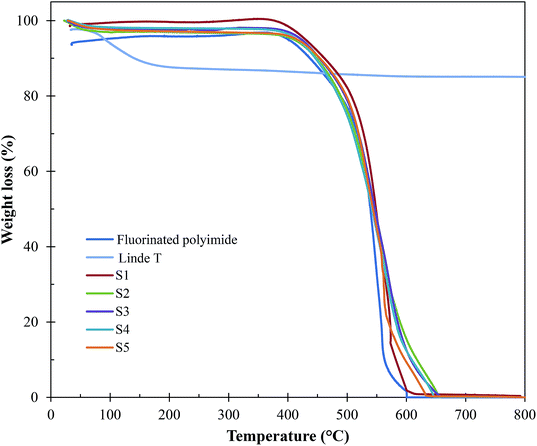 | ||
| Fig. 9 TGA curves of Linde T particles, virgin fluorinated polyimide membrane and Linde T/fluorinated polyimide composite membranes fabricated at different filler dispersion durations (S1–S5). | ||
| Membrane | Decomposition temperature, Td (°C) | Glass transition temperature, Tg (°C) |
|---|---|---|
| Virgin fluorinated polyimide | 512.50 | 410 |
| S1 | 518.75 | 425 |
| S2 | 515.10 | 423 |
| S3 | 516.20 | 420 |
| S4 | 515.63 | 420 |
| S5 | 515.95 | 420 |
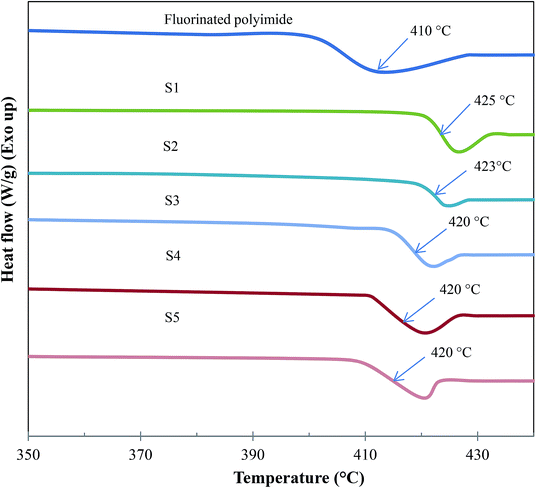
Based on Fig. 9 and Table 2, all the composite membranes (S1–S5) displayed thermal stability up to ∼500 °C. The decomposition of the composite membranes is contributed by Linde T particle framework and fluorinated polyimide matrix. A rapid weight loss between 500 °C and 600 °C is noticed by virtue of the decomposition of fluorinated polyimide polymer. In addition, all the prepared composite membranes (S1–S5) demonstrate minor shifts in the decomposition temperature (∼515–519 °C). This finding indicates that prolonging the filler dispersion duration from 2 h to 8 h did not influence the thermal stability of the membrane. In addition, it is also observed that the changes in final weight residues of the membranes are negligible. This is mainly due to the similar loading of Linde T particles (1 wt%) amalgamated into the fluorinated polyimide polymer for all the membranes.
The DSC curves and glass transition temperatures (Tg) of the resultant membranes are shown in Fig. 10 and Table 2, respectively. The average Tg value of each membrane was obtained by conducting at least 3 measurements. The standard deviation of the acquired Tg values from DSC measurements was about ±1 °C. Referring to Fig. 10 and Table 2, the Tg of virgin fluorinated polyimide membrane is 410 °C, which is in good agreement with the reported literature data.14 Meanwhile, all composite membranes show greater Tg value of up to 425 °C than the virgin membrane, indicating that the Linde T particles have altered the packing structure of the polymer membrane. When the total stirring and sonication duration is enhanced from 2 h to 8 h, the value of Tg decreases from 425 °C to 420 °C (S1–S5), signifying an increase of polymer chain flexibility and a reduction in membrane rigidity.62
3.2 Biogas permeation tests
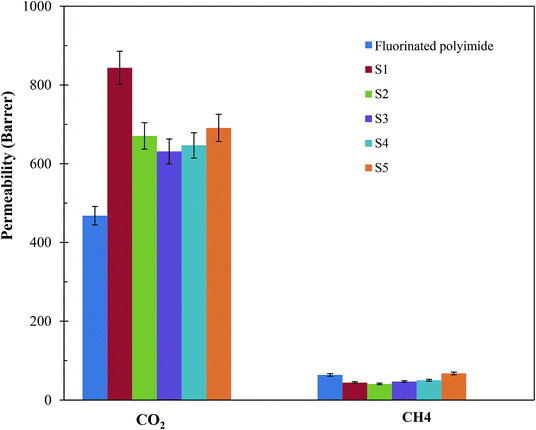
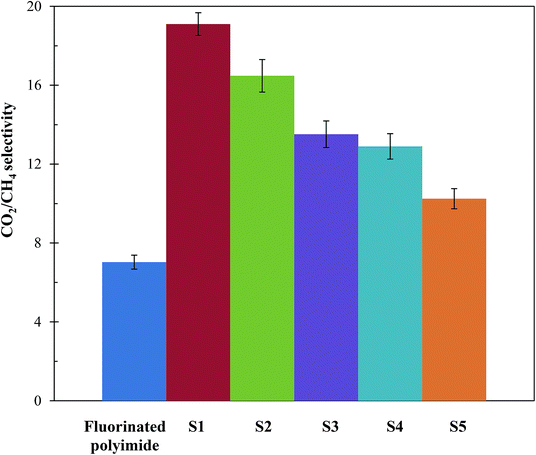
Fig. 11 and 12 show the CH4 and CO2 permeabilities and CO2/CH4 selectivities of the resultant membranes, respectively, which are critical elements in biogas upgrading. Referring to Fig. 11, all the resultant composite membranes display greater CO2 permeability and smaller CH4 permeability in comparison to the virgin fluorinated polyimide membrane. The composite membranes demonstrate CO2 permeability of 843.60 Barrer, 670.72 Barrer, 631.21 Barrer, 646.64 Barrer and 690.95 Barrer for S1, S2, S3, S4 and S5, respectively, while a CO2 permeability of 468.01 Barrer is exhibited by the virgin membrane. With respect to CH4 permeability, all the composite membranes, except S5, exhibit a lower value in comparison to the virgin fluorinated polyimide membrane. Moreover, viewing from the aspect of CO2/CH4 selectivity as shown in Fig. 12, all the composite membranes demonstrate higher values ranging from 10.3 to 19.1 than the virgin fluorinated polyimide membrane with a selectivity of only 7.03.The improved gas performance of the composite membranes prepared in this research is mainly attributed to the incorporation of Linde T particles in the fluorinated polyimide polymer phase. The inclusion of Linde T particles affects the polymer chain packing and subsequently boosts the free volume that acts as pathway for diffusion of gas penetrants.38 Moreover, the gas permeation of the Linde T/fluorinated polyimide composite membranes could be enhanced by the presence of Linde T pores (0.36 nm × 0.51 nm), which allow passage of CO2 with smaller kinetic diameter (3.3 Å) compared to the larger kinetic diameter of CH4 (3.8 Å).63 Thus, it can be stated that the presence of Linde T particles in fluorinated polyimide enhanced the diffusivity of gas and subsequently improved the CO2 gas permeability of the resultant composite membranes. On the other hand, the enhancement of CO2/CH4 separation performance might be attributed to CO2 adsorption coverage on Linde T pore walls. In addition, CO2 may be transported with less restriction through the Linde T pores since Linde T surface can promote greater electrostatic interaction with CO2 in comparison with CH4.63,64 Furthermore, the existence of hexafluoropropane linkage in fluorinated polyimide might also lead to limited rotation of neighboring phenyl rings, augmenting interaction with non-polar CO2 and stiffer backbones, which subsequently all resulted in enhanced gas separation performance.65
Furthermore, it can be observed from Fig. 11 that the enhancement of filler dispersion duration from 2 h (S1) to 8 h (S5) leads to a decrease in CO2 permeability from 843.60 Barrer to 670.72 Barrer. Meanwhile, the shortest stirring and sonication duration of 2 h (S1) also leads to the greatest advancement in terms of CO2 permeability and CO2/CH4 selectivity. In comparison to the virgin fluorinated polyimide membrane, S1 membrane displayed 80% increase in CO2 permeability and 44% reduction in CH4 permeability, while an improvement of CO2/CH4 selectivity of as high as 172% is attained. The improvement in CO2 permeability and CO2/CH4 selectivity of S1 is also confirmed through EDX mapping and FESEM images as demonstrated in Fig. 4–6, whereby a good dispersion of Linde T particles and absence of interfacial voids between polymer phase and particles were observed for S1. In addition, as shown in Table 2, the highest Tg value is also obtained for S1 membrane, which is associated with its higher gas separation performance.66 The increase of Tg can be linked to the enhancement of microvoid formation, which leads to the increase of permeability. Furthermore, the improvement of permeability with regards to Tg can also be explained by using eqn (8), where Tg is directly proportional to permeability:66
 | (8) |
Moreover, the enhancement of Tg also signifies the reduction of polymer chain flexibility, for which the increase of chain rigidity leads to a greater difference between the diffusion coefficients of smaller, CO2, and larger, CH4, penetrants. Consequently, CO2/CH4 selectivity improved. Nevertheless, prolonging the duration of filler dispersion from 2 h to 8 h contributed to the improvement of CH4 permeability from 44.16 Barrer to 67.43 Barrer, respectively. This could be due to presence of pinholes and significant agglomeration of Linde T particles within the polymeric phase, which ultimately lead to permeation of CH4 with greater critical size through the membrane matrix.
Besides that, it is observed in Fig. 11 and 12 that membranes fabricated with longer filler dispersion durations (S2–S5) display reduced CO2 permeability and CO2/CH4 selectivity relative to S1. The decrease of permeability might be due to partial pore blockage of filler by polymer chains.12 Although it is not easy to block Linde T pores with polymeric chains, it may potentially affect a portion of the pores by covering the particle surfaces.62,67 In addition, the decrease in selectivity might be because of the existence of voids occluded by the agglomerates of Linde T particles, as shown in Fig. 4–6, which reduces the gas separation performance as an end observation. Thus, in the current research, it can be summarized that a stirring and sonication duration of 2 h is the optimum filler dispersion period for fabricating Linde T/fluorinated polyimide composite membranes for CO2/CH4 separation performance, which resulted in CO2 permeability of 843.6 Barrer, CH4 permeability of 44.2 Barrer and CO2/CH4 selectivity of 19.1.
3.3 Mixed biogas permeation measurement and CO2-induced plasticization resistance tests
Since sample S1 showed the optimal single gas permeation performance among the composite membranes, mixed biogas permeation and CO2-induced plasticization tests of up to 25 bar were conducted using that membrane. Table 3 demonstrates the permeability and selectivity for biogas using sample S1. The fabricated membrane successfully removed >96% of CO2 from the mixed biogas. Thus, this membrane has a great potential in upgrading biogas to biomethane as a renewable substitute for natural gas. Based on Table 3, S1 membrane displays higher gas separation performance under single gas condition as compared to mixed biogas measurement. The reduction in permeability and selectivity in mixed biogas condition is anticipated because of the competitive effect between CO2 and CH4 penetrants in mixed gas. Moreover, the CH4 may occupy the pore apertures of Linde T and subsequently impede the movement of CO2 in penetrating through the membranes.68 Furthermore, it could also be attributed to gas polarization effect and non-ideality of gas phase.69| Measurement | Permeability | CO2/CH4 selectivity | |
|---|---|---|---|
| CO2 | CH4 | ||
| Pure gas | 843.6 | 44.2 | 19.1 |
| Mixed gas | 582.4 | 48.6 | 12.0 |
Furthermore, membranes with antiplasticization attribute are vital in order to maintain a consistent promising separation performance over long service periods, and therefore a CO2-induced plasticization test was conducted. Fig. 13 shows the curves of CO2-induced plasticization of virgin fluorinated polyimide and S1 membranes. Based on Fig. 13, it can be noticed that CO2 permeability of virgin fluorinated polyimide membrane declines with increasing pressure up to 5 bar. The lowest CO2 permeability of the virgin membrane at 5 bar indicates its plasticization pressure.70 On the other hand, the permeability of CO2 starts to increase when the pressure is further increased above the plasticization pressure because local segmental motion promoted by the plasticizing agent, CO2, loosens free chains.71
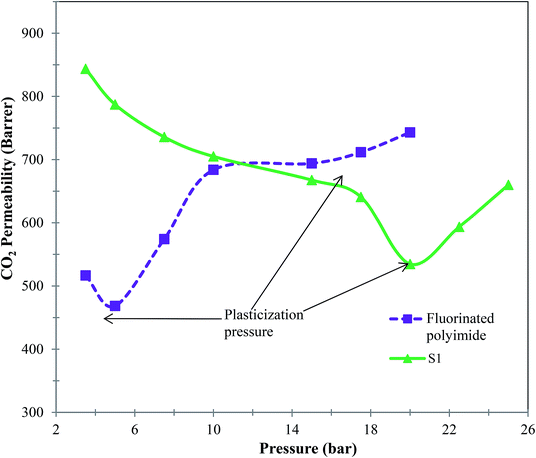 | ||
| Fig. 13 CO2-induced plasticization behavior of virgin fluorinated polyimide membrane and Linde T/fluorinated polyimide composite membrane at a temperature of 30 °C. | ||
The S1 membrane demonstrates a similar decrease in CO2 permeability with increasing pressure up to 20 bar. Obviously, the incorporation of Linde T into the fluorinated polyimide polymer matrix has successfully enhanced the resistance to CO2 plasticization of up to 300% compared to the virgin fluorinated polyimide membrane of merely 5 bar. This improvement might be attributed to greater molecular interactions between the particles and polymer phase that reduce the likelihood of polymeric chains slipping over each other with sorption of CO2 since they are held more tightly together. Furthermore, the increase in plasticization resistance might be due to the reinforcement and constraining effect of the rigid Linde T particles on molecular movement of polymeric chains.72 Incorporation of particles within the polymeric matrix may limit the flexibility of the polymer, which further increases the CO2 plasticization pressure of resulting composite membranes, which has been supported as well in previously published literature.73
3.4 Comparison of fabricated composite membranes with literature data
The separation performance of the Linde T/fluorinated polyimide composite membranes in the present work was compared with the Robeson upper bound limit, with the results being summarized in Fig. 14. As illustrated in Fig. 14, it can be observed that the performance of the virgin fluorinated polyimide membrane lies below the 1991 Robeson upper bound limit.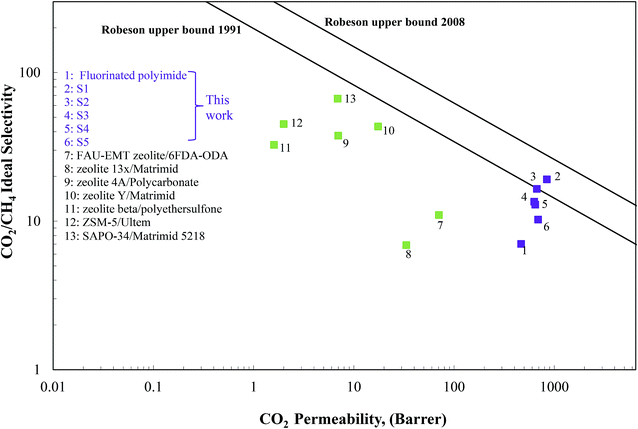 | ||
| Fig. 14 Gas separation performance of Linde T/fluorinated polyimide composite membranes compared with the CO2/CH4 Robeson upper bounds. | ||
Although the addition of Linde T in the fluorinated polyimide polymer phase has demonstrated success in increasing both CO2 permeability and CO2/CH4 selectivity compared to the virgin fluorinated polyimide membrane, none of the composite membranes are able to surpass the 2008 Robeson upper bound line. However, S1 membrane successfully transcends the 1991 limit and approaches close towards the 2008 Robeson trade-off line. In addition, Fig. 14 also compares the values of CO2 permeability and CO2/CH4 selectivity of the Linde T/fluorinated polyimide composite membranes with previously published literature, relating to different types of zeolite-based composite membranes.16,22,24,74–77 Based on Fig. 14, it is shown that the composite membranes prepared in the current work show higher performance as compared to the zeolite-based composite membranes reported in the literature. This finding shows that the Linde T/fluorinated polyimide membranes are potential candidates for use in upgrading raw biogas.
4 Conclusions
Biogas generated from waste can be refined to biomethane as a sustainable substitute for natural gas. The utilization of membrane separation for on-site biogas purification has emerged as an interesting approach to remove CO2 before commercial utilization of biomethane. In this work, composite membranes comprising Linde T and fluorinated polyimide phase were prepared using a facile fabrication method and their performance was evaluated in biogas upgrading. The results indicated that the composite membrane fabricated using 2 h of filler dispersion duration exhibited good dispersion of Linde T in the fluorinated polyimide phase without the presence of interfacial voids between fillers and polymeric matrix. In addition, the membrane displayed the highest value of CO2 permeability and CO2/CH4 selectivity as compared to other membranes as well as exhibiting an increased CO2 plasticization pressure of 300% compared to the virgin polyimide membrane. Furthermore, the fabricated membrane also successfully removed >96% CO2, which met the biomethane quality requirement for vehicle fuel utilization. Overall, the present work has contributed significantly to the study of determining the optimized parameters for fabrication of Linde T/fluorinated polyimide composite membranes, which is vital in finding a feasible method for the fabrication of a new composite membrane. Moreover, the successful development of this membrane material is of great importance for the industrial employment of composite membranes in CO2 removal, which is beneficial for the biomethane production industry.Conflicts of interest
There are no conflicts to declare.Acknowledgements
The technical and financial supports provided by Centre for Contaminant Control & Utilization (CenCoU) under YUTP grant (grant no. 015LCO-113) and CO2 Research Centre (CO2RES) research group, Universiti Teknologi PETRONAS are duly acknowledged.References
- D. Hedberg, S. Kullander and H. Frank, Ambio, 2010, 39(suppl 1), 1–10 CrossRef.
- H. Ma, Y. Guo, Y. Qin and Y.-Y. Li, Bioresour. Technol., 2018, 269, 520–531 CrossRef CAS PubMed.
- M. Tabatabaei and H. Ghanavati, Biogas Fundamentals, Process and Operation, Springer, 2018 Search PubMed.
- Y.-M. Wu, J. Yang, X.-L. Fan, S.-F. Fu, M.-T. Sun and R.-B. Guo, Bioresour. Technol., 2017, 231, 124–128 CrossRef CAS.
- N. Jusoh, Y. F. Yeong, K. K. Lau and A. M. Shariff, Procedia Eng., 2016, 148, 1259–1265 CrossRef CAS.
- N. E. Joseph, Msc thesis, Teri University, 2015.
- N. Jusoh, Y. F. Yeong, T. L. Chew, K. K. Lau and A. M. Shariff, Sep. Purif. Rev., 2016, 45, 321–344 CrossRef CAS.
- L. M. Robeson, J. Membr. Sci., 2008, 320, 390–400 CrossRef CAS.
- S. Escorihuela, L. Valero, A. Tena, S. Shishatskiy, S. Escolastico, T. Brinkmann and J. M. Serra, Membranes, 2018, 8, 1–18 CrossRef PubMed.
- M. Simcik, M. C. Ruzicka, M. Karaszova, Z. Sedlakova, J. Vejrazka, M. Vesely, P. Capek, K. Friess and P. Izak, Sep. Purif. Technol., 2016, 167, 163–173 CrossRef CAS.
- M. Kárászová, J. Vejražka, V. Veselý, K. Friess, A. Randová, V. Hejtmánek, L. Brabec and P. Izák, Sep. Purif. Technol., 2012, 89, 212–216 CrossRef.
- L. K. Chua, N. Jusoh and Y. F. Yeong, Journal of Applied Science and Agriculture, 2015, 10, 215–221 Search PubMed.
- X. Y. Chen, H. Vinh-Thang, D. Rodrigue and S. Kaliaguine, Ind. Eng. Chem. Res., 2012, 51, 6895–6906 CrossRef CAS.
- M. Askari and T.-S. Chung, J. Membr. Sci., 2013, 444, 173–183 CrossRef CAS.
- V. Nafisi and M.-B. Hagg, ACS Appl. Mater. Interfaces, 2014, 6, 15643–15652 CrossRef CAS PubMed.
- D. Sen, H. Kalipcilar and L. Yilmaz, Desalination, 2006, 200, 222–224 CrossRef CAS.
- Y. Zhang, K. J. Balkus Jr, I. H. Musselman and J. P. Ferraris, J. Membr. Sci., 2008, 325, 28–39 CrossRef CAS.
- J. M. Duval, B. Folkers, M. H. V. Mulder, G. Desgrandchamps and C. A. Smolders, J. Membr. Sci., 1993, 80, 189–198 CrossRef CAS.
- A. A. S. Alomair, PhD dissertation, University of Manchester, 2013.
- J. V. d. Bergh, W. Zhu, J. Gascon, J. A. Moulijn and F. Kapteijn, J. Membr. Sci., 2008, 316, 35–45 CrossRef.
- D. Sen, PhD dissertation, Middle East Technical University, 2008.
- A. E. Amooghin, RSC Adv., 2015, 5, 8552–8565 RSC.
- M. U. M. Junaidi, C. P. Leo, A. L. Ahmad, S. N. M. Kamal and T. L. Chew, Fuel Process. Technol., 2014, 118, 125–132 CrossRef CAS.
- H. H. Yong, H. C. Park, Y. S. Kang, J. Won and W. N. Kim, J. Membr. Sci., 2001, 188, 151–163 CrossRef CAS.
- M. F. A. Wahab, A. F. Ismail and S. J. Shilton, Journal of Chemical and Natural Resources Engineering, 2008, 2, 108–122 Search PubMed.
- O. Bakhtiari, S. Mosleh, T. Khosravi and T. Mohammadi, J. Membr. Sci. Technol., 2011, 1, 1–8 Search PubMed.
- F. R. Ribeiro, Zeolites: Science and Technology, Springer, Netherlands, 2012 Search PubMed.
- M. Qureshi and K. G. Varshney, Inorganic Ion Exchangers in Chemical Analysis, Taylor & Francis, 1991 Search PubMed.
- N. Y. Chen, T. F. Degnan and C. M. Smith, Molecular Transport and Reaction in Zeolites: Design and Application of Shape Selective Catalysis, John Wiley & Sons, 1994 Search PubMed.
- S. M. Mirfendereski, T. Mazaheri, M. Sadrzadeh and T. Mohammadi, Sep. Purif. Technol., 2008, 61, 317–323 CrossRef CAS.
- N. Azizi, T. Mohammadi and R. Mosayebi Behbahani, Chem. Eng. Res. Des., 2017, 117, 177–189 CrossRef CAS.
- F. Banihashemi, M. Pakizeh and A. Ahmadpour, Sep. Purif. Technol., 2011, 79, 293–302 CrossRef CAS.
- G. Clarizia, C. Algieri, A. Regina and E. Drioli, Microporous Mesoporous Mater., 2008, 115, 67–74 CrossRef CAS.
- S. L. Liu, R. Wang, Y. Liu, M. L. Chng and T. S. Chung, Polymer, 2001, 42, 8847–8855 CrossRef CAS.
- V. Nafisi and M.-B. Hägg, Sep. Purif. Technol., 2014, 128, 31–38 CrossRef CAS.
- R. Wang, Y. Cao, R. Vora and R. J. Tucker, J. Appl. Polym. Sci., 2001, 82, 2166–2173 CrossRef CAS.
- S. N. Wijenayake, N. P. Panapitiya, S. H. Versteeg, C. N. Nguyen, S. Goel, K. J. Balkus, I. H. Musselman and J. P. Ferraris, Ind. Eng. Chem. Res., 2013, 52, 6991–7001 CrossRef CAS.
- Y. F. Yeong, H. Wang, K. Pallathadka Pramoda and T.-S. Chung, J. Membr. Sci., 2012, 397–398, 51–65 CrossRef CAS.
- N. Jusoh, K. K. Lau, A. M. Shariff and Y. F. Yeong, Int. J. Greenhouse Gas Control, 2014, 22, 213–222 CrossRef CAS.
- M. Mubashir, Y. F. Yeong, K. Lau, T. Chew and N. Jusoh, Sep. Purif. Technol., 2018, 199, 140–151 CrossRef CAS.
- N. Jusoh, Y. F. Yeong, K. K. Lau and A. M. Shariff, J. Cleaner Prod., 2017, 149, 80–95 CrossRef CAS.
- D. Q. Vu, W. J. Koros and S. J. Miller, Ind. Eng. Chem. Res., 2001, 41, 367–380 CrossRef.
- S. D. Kelman, Crosslinking and Stabilization of High Fractional Free Volume Polymers for the Separation of Organic Vapors from Permanent Gases, University of Texas at Austin, 2008 Search PubMed.
- S. Lock, K. Lau, A. Shariff, Y. Yeong, M. Bustam, N. Jusoh and F. Ahmad, J. Nat. Gas Sci. Eng., 2018, 57, 135–154 CrossRef CAS.
- N. Jusoh, Y. F. Yeong, M. Mohamad, K. K. Lau and A. M. Shariff, Ultrason. Sonochem., 2017, 34, 273–280 CrossRef CAS PubMed.
- M. D. Rad, S. Fatemi and S. M. Mirfendereski, Chem. Eng. Res. Des., 2012, 90, 1687–1695 CrossRef CAS.
- J. Jordens, T. Appermont, B. Gielen, T. Van Gerven and L. Braeken, Cryst. Growth Des., 2016, 16, 6167–6177 CrossRef CAS.
- J. A. Thompson, K. W. Chapman, W. J. Koros, C. W. Jones and S. Nair, Microporous Mesoporous Mater., 2012, 158, 292–299 CrossRef CAS.
- F. Franco, L. A. Pérez-Maqueda and J. L. Pérez-Rodríguez, J. Colloid Interface Sci., 2004, 274, 107–117 CrossRef CAS PubMed.
- D. Gandhi, Effect of Ostwald ripening on particle breakage in saturated solutions, 2007 AlChe Annual Meeting Proceedings, San Francisco, 2007 Search PubMed.
- R. Zhou, L. Hu, Y. Zhang, N. Hu, X. Chen, X. Lin and H. Kita, Microporous Mesoporous Mater., 2013, 174, 81–89 CrossRef CAS.
- X. Chen, J. Wang, D. Yin, J. Yang, J. Lu, Y. Zhang and Z. Chen, AIChE J., 2013, 59, 936–947 CrossRef CAS.
- A. Mahmoudi, M. Namdari, V. Zargar, G. Khanbabaei and M. Asghari, Int. J. Nano Dimens., 2014, 5, 83–89 Search PubMed.
- W. Mozgawa, M. Krol and K. Barczyk, Chemik, 2011, 65, 667–674 CAS.
- S. Yang and N. P. Evmiridis, Microporous Mater., 1996, 6, 19–26 CrossRef CAS.
- X.-L. Zhang, L.-F. Qiu, M.-Z. Ding, N. Hu, F. Zhang, R.-F. Zhou, X.-S. Chen and H. Kita, Ind. Eng. Chem. Res., 2013, 52, 16364–16374 CrossRef CAS.
- L. Shao, T.-S. Chung, S. H. Goh and K. P. Pramoda, J. Membr. Sci., 2004, 238, 153–163 CrossRef CAS.
- W.-H. Lin, R. H. Vora and T.-S. Chung, J. Polym. Sci., Part B: Polym. Phys., 2000, 38, 2703–2713 CrossRef CAS.
- S. Basu, A. Cano-Odena and I. F. J. Vankelecom, Sep. Purif. Technol., 2011, 81, 31–40 CrossRef CAS.
- L. Shao, T.-S. Chung and K. P. Pramoda, Microporous Mesoporous Mater., 2005, 84, 59–68 CrossRef CAS.
- T. R. Crompton, in Thermo-oxidative degradation of polymers, Smithers Rapra, Akron, 2010, vol. 1, pp. 51–78 Search PubMed.
- Y. Li, T.-S. Chung, C. Cao and S. Kulprathipanja, J. Membr. Sci., 2005, 260, 45–55 CrossRef CAS.
- Y. Cui, H. Kita and K.-i. Okamoto, J. Mater. Chem., 2004, 14, 924–932 RSC.
- Q. Jiang, J. Rentschler, G. Sethia, S. Weinman, R. Perrone and K. Liu, Chem. Eng. J., 2013, 230, 380–388 CrossRef CAS.
- S. Banerjee, Handbook of Specialty Fluorinated Polymers: Preparation, Properties, and Applications, Elsevier Science, 2015 Search PubMed.
- Y. P. Yampolskii, Y. Kamiya and A. Y. Alentiev, J. Appl. Polym. Sci., 2000, 76, 1691–1705 CrossRef CAS.
- T. T. Moore, R. Mahajan, D. Q. Vu and W. J. Koros, AIChE J., 2004, 50, 311–321 CrossRef CAS.
- T. Visser, N. Masetto and M. Wessling, J. Membr. Sci., 2007, 306, 16–28 CrossRef CAS.
- S. Velioğlu, M. G. Ahunbay and S. B. Tantekin-Ersolmaz, J. Membr. Sci., 2012, 417–418, 217–227 CrossRef.
- A. Bos, I. G. M. Pünt, M. Wessling and H. Strathmann, J. Polym. Sci., Part B: Polym. Phys., 1998, 36, 1547–1556 CrossRef CAS.
- H. Eslami, M. Kesik, H. A. Karimi-Varzaneh and F. Müller-Plathe, J. Chem. Phys., 2013, 139, 124902 CrossRef PubMed.
- X. Wang, Q. Su, J. Shan and J. Zheng, Polym. Compos., 2016, 37, 1705–1714 CrossRef CAS.
- S. Shahid and K. Nijmeijer, J. Membr. Sci., 2014, 459, 33–44 CrossRef CAS.
- A. M. W. Hillock, S. J. Miller and W. J. Koros, J. Membr. Sci., 2008, 314, 193–199 CrossRef CAS.
- M. Peydayesh, S. Asarehpour, T. Mohammadi and O. Bakhtiari, Chem. Eng. Res. Des., 2013, 91, 1335–1342 CrossRef CAS.
- Y. Li, T.-S. Chung, Z. Huang and S. Kulprathipanja, J. Membr. Sci., 2006, 277, 28–37 CrossRef CAS.
- T.-H. Bae, J. Liu, J. S. Lee, W. J. Koros, C. W. Jones and S. Nair, J. Am. Chem. Soc., 2009, 131, 14662–14663 CrossRef CAS PubMed.
| This journal is © The Royal Society of Chemistry 2020 |

