
 Open Access Article
 This Open Access Article is licensed under a
 Creative Commons Attribution 3.0 Unported Licence
Study on non-bioparticles and Staphylococcus aureus by dielectrophoresis†
Qiaoying Chena,
Zhongqing Cao*b and
Yong J. Yuan *a
*a
aLaboratory of Biosensing and MicroMechatronics, School of Materials Science and Engineering, Southwest Jiaotong University, Chengdu, Sichuan, China. E-mail: yongyuan@swjtu.edu.cn
bSchool of Mechanical Engineering, Southwest Jiaotong University, Chengdu, Sichuan, China. E-mail: zqcao@swjtu.edu.cn
First published on 15th January 2020
Abstract
This article demonstrated a chip device with alternating current (AC) dielectrophoresis (DEP) for separation of non-biological micro-particle and bacteria mixtures. The DEP separation was achieved by a pair of metal electrodes with the shape of radal-interdigital to generate a localized non-uniform AC electric field. The electric field and DEP force were firstly investigated by finite element methods (FEM). The mixed microparticles such as different scaled polystyrene (PS) beads, PS beads with inorganic micro-particles (e.g., ZnO and silica beads) and non-bioparticles with bacterial Staphylococcus aureus (S. aureus) were successfully separated at DEP-on-a-chip by an AC electric field of 20 kHz, 10 kHz and 1 MHz, respectively. The results indicated that DEP trapping can be considered as a potential candidate method for investigating the separation of biological mixtures, and may well prove to have a great impact on in situ monitoring of environmental and/or biological samples by DEP-on-a-chip.
1. Introduction
Dielectrophoresis (DEP) forces1 are flexible and can be modified simply by changing frequencies, which showed some advantages over other methods, i.e., label-free, ease of handling, high precision and being high speed. DEP has attracted a great deal of attention to control particles due to its high selectivity and rapidity in manipulation.2 It is based upon the fact that particles with different electrical characteristics will behave diversely in a non-uniform electric field. It has been used not only for trapping processes,3 but also for aligning,4–6 isolating and separation various sized particles,7,8 and applied in a wide range of medical research,9,10 biological11–14 and environmental15 applications to analyze particles of interest. The particles should be trapped in a detection region before analysis, as the position of the particle has a big impact on the accuracy of the measurement results. DEP-on-a-chip16 will be key to developing a rapid, accurate, portable, simple-use and cost-effective microfluidic device with a promising impact in multi-particle manipulating, microfluidics, immune analysis, and micro-total analysis systems (μTAS).PS beads with stable physicochemical properties are used as numerical analysis objects in this area,17 especially to normalize the trapping, enrichment and separation by DEP. Freedman et al.18 extended tracked 1 μm PS beads at the conditions to DNA trapping, and demonstrated the distinct forces observed for both DEP and electrothermal flow (ETF). Saucedo-Espinosa and Lapizco-Encinas19 designed an iDEP device, and illustrated the effects of particle size and shape on DEP trapping by employing 1 and 2 μm PS beads and E. coli cells. The results showed that PS beads size and flow speed have a significant effect on the magnitude, location, and shape of DEP trapping regions. In 2017, Allen et al.20 demonstrated both positive DEP (pDEP) and negative DEP (nDEP) using silver-coated hollow glass spheres and PS beads with the isomotive DEP (isoDEP) devices, respectively. Both alternating current (AC) and direct current (DC) electric fields can trap PS beads by nDEP at approximately 95–100% of trapping efficiency. Moreover, PS beads are often used in a biochemistry field because its sizes are tunably close to cells such as bacteria (0.8–2 μm),21 red blood cells (7–8 μm),22 liver cells (20–30 μm) and many cancer cells (10–30 μm),23 which can provide significant references for manipulation of biological particles. The separation of two groups with a similar size was hard with a fixed frequency.24 Su and Voldman8 then developed an automated system and presented characterization of the method with 6 and 10 μm PS beads and HL-60 cells, as well as its application to rapidly discriminating neutrophils with different activation states. They used 6 and 10 μm carboxyl-modified PS beads for model validation and calibration. The system accumulated large DEP separation datasets of different cells and label-free applications.
A wide range of frequencies has been investigated from 1 kHz to 500 MHz. Interdigital electrodes and circular electrode arrays were used in literature. The key challenges in DEP are to separate multi-particles at a time. The radial-interdigital electrodes proposed has great potential of separating multi-particles by DEP-on-a-chip. Because of the gradient variation in an electric field, different particles can be in different regions by DEP forces. The intention of this work was to in situ examine the interplay between PS beads with inorganic micro-particles and bio-particles, by determining DEP trapping percentages over a broad spectrum of frequencies. Experiments were carried out in the orientation of particles in frequency-selectable directions.25 In the whole process, the vibration of the particle chain is very small due to Brownian motion.26
Here, we presented a device with AC electric fields by a non-uniform microelectrode array, along the direction of electric-field intensity by much lower frequencies and applied voltages to pattern and separate particles. It was demonstrated respectively in separation of colloidal PS beads by size, PS beads and inorganic micro-particle (silica and ZnO beads) and bio-particles (S. aureus). It will provide a new method of diagnosis of S. aureus in a complex environmental sample without separation, purification and cell-culture processes. It can also improve the purity of S. aureus, by avoiding the pollution of particles during operation.
2. Theory
2.1. DEP force
Unlike DC,27 AC electric fields can be used to manipulate many types of particles in different media by simply adjusting AC parameters (i.e., magnitude, frequency, wave shape, wave symmetry and phase, etc.), while eliminating the influence of linear electrokinetic phenomenon including the traditional electrophoresis and electroosmosis. DEP induces chaining of similar particles parallel to the local field direction, independent of whether particles exhibit pDEP or nDEP.4,6 The DEP force for particles with spherical geometries is given by| FDEP = 2πrp3εmRe[K(ω)]∇E2 | (1) |
 | (2) |
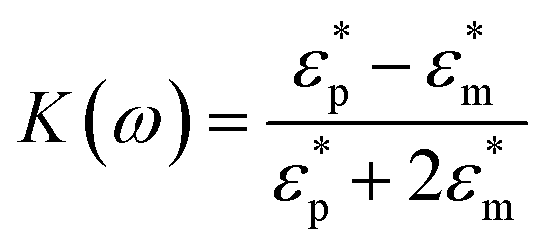
The Clausius–Mossotti (CM) factor K(ω) is related to the electric field frequency (ω = 2πf), the conductivity (σ) and complex permittivity (ε*) of particles and suspending medium (ε* = ε − jσ/ω, j2 = −1), subscripts p and m mean particles and suspending medium, respectively.28 The K(ω) can theoretically have a value from −0.5 to 1.0. According to the above equations, the sign of the K(ω) determines whether a particle is repelled from or attracted to regions of high electric field strength. A positive factor indicates attraction, generally referred to as pDEP.
The basic principle of DEP depending on the extent of polarization is described. In time averaged translational DEP, both K(ω) and DEP force are frequency-dependent. The crossover frequency (COF) is that frequency at which a particle subjected to DEP transitions from pDEP to nDEP or from nDEP to pDEP.7 Thus, the crossover angular frequency, ωc, is calculated by letting Re(K) = 0 for εp < εm and σp < σm, which may be defined as:29
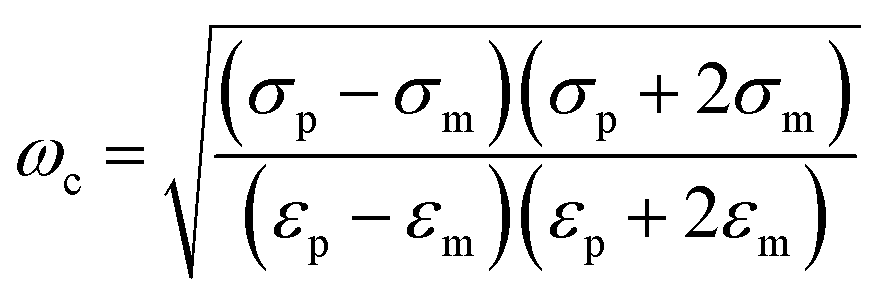 | (3) |
For low permittivity particles in aqueous media (e.g., deionized (DI) water), particles move toward the high field region at ω < ωc, referred to as pDEP and toward the low field region at ω > ωc, referred to as nDEP. For particles in water, nDEP occurs when the permittivities of the system dominate due to the large ε = 79 of water compared to nearly all other substances. The COF is given by
 | (4) |
Here, fCOF is known as the crossover frequency where DEP force is zero (Re(K) = 0). The key parameter, electrical conductivity of a solid homogeneous PS bead, can be expressed as
 | (5) |
The value of Ks has a linear relationship with the PS bead diameter if the permittivities of suspending medium and PS beads are constantly undergoing fCOF. The surface conductance has been calculated for PS beads of different diameters.34 In DEP separation, the variables of voltage, frequency and buffer conductivity need to be considered.35 This study focused on the characterization of particles in behaviors by frequency.
2.2. Particle geometry factor
Because of the different characteristics of PS particles and cells, there are significant differences in morphology and dielectric properties, as shown in Fig. 5A. PS particles are homogeneous particles while cells are heterogeneous particles. The conventional inorganic particles can be equivalent to the single shell model with radius rp. Cells are different from the conventional inorganic particles, and they need to be regarded as multi-shell models. Thus, S. aureus can be regarded as an equivalent sphere with bilayer membrane structure36 (radius is rp): cell plasma membrane thickness δ1 is 8 nm, cell wall thickness is 20 nm.2.3. Conductivity factor
The frequency is one of the important factors to ensure the polarizability of PS beads, while the voltage determines the stable and sufficient DEP forces being applied to the induced dipole moment, which depend on the voltage and electrode geometry. Since the DEP technique directly affects cell physiology, several electro-physiological effects need to be considered when designing the electrode geometry.Theoretical predictions of suspension media's conductivity dependency (0.2 mS m−1, 0.5 mS m−1 and 1 mS m−1) of Re[K(ω)] is shown in Fig. 1, frequency ranges were from 1 kHz to 10 MHz while electric potentials applied at 8 V peak-to-peak (Vpp) amplitude. Other parameters were summarized in Table 1.
 | ||
| Fig. 1 (A) Illustration of homogeneous particle and inhomogeneous cell. Re[K] of different particles as a function of frequency in media with conductivities of 0.2 mS m−1 (B), 0.5 mS m−1 (C) and 1 mS m−1 (D), respectively. | ||
| Particles | Diameter (μm) | Density (g cm−3) | Conductivities (mS m−1) | Relative permittivity |
|---|---|---|---|---|
| PS-1 (ref. 37) | 1 | 1.05 | 4 | 2.55 |
| PS-10 | 10 | 1.05 | 0.47 | 2.55 |
| Silica38 | 1–2 | 2.2 | — | 3.9 |
| ZnO39 | 1 | 5.606 | 5 | 1.7 |
| S. aureus (live)40,41 | ∼1 | ∼1 | 0.75 (cytoplasm), 2.5 × 10⁻⁴ (membrane) | 60 (cytoplasm), 6 (membrane) |
| S. aureus (dead)42,43 | ∼1 | ∼1 | 0.75 (cytoplasm), 1 (membrane) | 60 (cytoplasm), 6 (membrane) |
| Suspension | 0.2 (DI water), 0.5 (sucrose), 1 (sucrose) | 78 | ||
The spectra are very different for live/dead bacteria, reflecting their morphological and dielectric specific properties. Based on the calculation in Fig. 1B, pDEP (Re[K(ω)]>0) for 1 μm PS beads was predicted below 1 MHz, while 10 μm PS beads below 100 kHz. The pDEP behavior of ZnO beads occurred approximately below 1 GHz, while S. aureus was expected between 10 kHz and 60 MHz. If medium conductivity was 0.5 mS m−1 as shown in Fig. 1C, the pDEP behaviors of both 1 μm PS and ZnO beads were almost the same as the situation of 0.2 mS m−1 as shown in Fig. 1B. The pDEP behavior of S. aureus was slightly narrowed between 60 kHz and 60 MHz. When the medium conductivity was further increased to 1 mS m−1 in Fig. 1D, the pDEP behaviors of both 1 μm PS and ZnO beads were very close to that of Fig. 1B and C, except for lowering Re[K(ω)] magnitudes of 1 μm PS beads.
The pDEP behavior of S. aureus was expected to be between 90 kHz and 60 MHz as shown in Fig. 1D, and the nDEP behaviors of PS beads were predicted by energizing an electric field at 1 MHz frequency as determined by negative values of theoretical Re[K(ω)] calculated. If the frequency was set to above 1 MHz, a strong pDEP force could be obtained for S. aureus bacteria trapping, which eliminating PS beads due to their nDEP behaviors. The relative negative polarizability of induced dipole is enhanced due to a decrease in particle surface conductivity, thus increasing the magnitude of nDEP force field. The overall comparison of the calculated results of Re[K(ω)] provides a separation possibility of biological mixtures.
3. Simulation and experiments
3.1. Design and simulation
Microelectrode architecture is one of the important factors to ensure stable and sufficient DEP forces being applied to the induced dipole of the target particles suspended in the liquid medium. The geometry of microelectrodes was designed for specific investigation purpose. A numerical simulation was created to find estimation of the field intensity and the location of electric field maxima, and then verifying the cell trapping locations predicted. Here, a 3D AC/DC electrostatic model of a non-uniform electric field in aqueous solution was performed for analysis of electric field distribution and prediction of trapping location of different particles by finite element multiphysics software COMSOL Multiphysics 4.2a (Burlington, MA, USA). As shown in Fig. 2, microelectrodes were radial-interdigital strips of 60 μm wide and 800 μm long, separated by gaps from 50 to 200 μm. The red vectors in Fig. 2A show the direction of DEP forces (not in scale). The gap between electrode strips generates a powerful nDEP force due to the Laplace equations with fixed potential. The direction of the nDEP force is downward (as shown by red arrows), which drives particles to get stuck at the bottom. The electric field and contour of DEP forces for 1 μm PS beads (f = 10 kHz) were shown in Fig. 2B. The gap between electrode strips and the middle of them are dominated by nDEP, while pDEP occurs near the strips' edges. | ||
| Fig. 2 Simulation of electric field and direction of DEP forces for 1 μm PS beads. (A) The electric field distribution and direction of DEP forces for 1 μm PS beads (f = 10 kHz) in z axis. (B) The contours of the squared electric field distribution (m2 kg2 (s6 A2)−1) in cross section, and the highest value occurred near electrode's edge. | ||
The electric field distribution in a non-uniform field was initially derived from Laplace's equation. By taking the gradient of the square of electric field intensity, the relative strength of the DEP force was calculated. The electrode gap was designed to generate low electric fields so as to move the particles to the gap by nDEP.44 In addition, the strength of the DEP force was also affected by the conductivity and permittivity of particles and media.
3.2. Device fabrication and assembly
The DEP chip was microfabricated using a standard photolithography on a 3-inch glass wafer for its transparency and low-cost. The wafers were cleaned by surfactant solution for 30 min and then hot piranha solution (70% sulfuric acid, H2SO4 and 30% hydrogen peroxide, H2O2) for 6 h. A 400 nm layer of Al was deposited in an electron-beam evaporator. Al-coated wafers were vapor-primed with hexamethyldisilazane (HMDS) for 30 min, followed by spin-coating of 1.2 μm positive photoresist (AZ 1500, AZ Electronic Materials Co., Ltd., Shizuoka, Japan) with a spin coater (WS-400B-6NPP-LITE, Laurell, Mycro Technologies, Wuhan, China) for 30 s at 3000 rpm. The photoresist coated wafer was then pre-baked for 90 s at 100 °C and cooled for 2 min before UV light exposure by a mask-aligner (DS-URE-2000/25-1, Chengdu Institute of Optic and Electronics, Chengdu, China) followed by post-baking for 60 s at 120 °C. After the post-bake process, the wafer then underwent a developing process where the whole wafer was immersed inside a developer. The uncovered Al film was then etched using wet-etching (H3PO4![[thin space (1/6-em)]](https://www.rsc.org/images/entities/char_2009.gif) :HAc:HNO3:H2O = 19:1:1:2, v/v) for 5 min. The micro-electrodes on the wafer were realized after soaking with acetone in an ultrasonic bath. The wafers were diced (ADT 7100, Advanced Dicing Technology, Inc., Yokneam, Israel) and cleaned with DI water before dried with nitrogen. DEP-on-a-chip assembled in a holder, micro-electrodes were connected externally to a function generator (Agilent 33250A, Agilent Technologies, Inc., Santa Clara, CA, USA) via copper tape. The particles were suspended in solution and subjected to AC electric field induced by Al micro-electrodes.
:HAc:HNO3:H2O = 19:1:1:2, v/v) for 5 min. The micro-electrodes on the wafer were realized after soaking with acetone in an ultrasonic bath. The wafers were diced (ADT 7100, Advanced Dicing Technology, Inc., Yokneam, Israel) and cleaned with DI water before dried with nitrogen. DEP-on-a-chip assembled in a holder, micro-electrodes were connected externally to a function generator (Agilent 33250A, Agilent Technologies, Inc., Santa Clara, CA, USA) via copper tape. The particles were suspended in solution and subjected to AC electric field induced by Al micro-electrodes.
3.3. Chemicals and materials
Monodispersed PS beads of various sizes (diameter 1–10 μm) were purchased from Spherotech Inc. (Chicago, IL, USA). DI water (Omni Analytic Inc.) was used in preparation of all aqueous solutions. 1 μm ZnO and silica beads were purchased from Buhan Chemical Technology Inc (Shanghai, China). S. aureus was from Jiangsu Provincial for Disease Control and Prevention (Nanjing, China). S. aureus cells were cultured on Colombian sheet blood plate in an incubator (Thermo Fisher 3111, Thermo Fisher Scientific Inc., Marietta, OH, USA) and allowed to grow overnight at 35 °C.The evaluation of suspension medium conductivity σm was conducted by adding sucrose (99%, Sigma-Aldrich, Saint Louis, MO, USA) to PS beads suspensions. The conductivity was varied from 0.2 to 1 mS m−1 (added by several microliters 2 mM PBS buffer), measured by a conductivity meter (HI8733, Hanna, Italy). The particle mixture of Sam-A was prepared by suspending 1 and 10 μm PS beads in DI water with a final concentration of ∼107 particles per mL. Sam-B was prepared by suspending 1 μm PS beads, ZnO and silica beads in DI water (∼107 particles per mL). The bio-mixture of Sam-C was prepared by suspending S. aureus cells and Sam-B in DI water (∼107 particles per mL).
Live S. aureus cells were heated at 80 °C for 30 min to be programmed cell death. Live and dead cells were stained using methylthionine chloride45 (Nobleryder, Beijing, China), respectively. In addition, 5 μL dye was mixed with 500 mL bacterial suspension, incubated at room temperature in the dark for 10 min. The mixture was centrifuged for 4 min at 1500 rcf, washed two times, and then suspended in 0.1 mM PBS buffer to achieve target concentrations of approximately 107 cells per mL. The total amount of cells was counted by a blood counting chamber. The final conductivity was 0.2 mS m−1.
The manipulation process was monitored and recorded by upright optical microscopy (DM 2500, Leica, Germany) equipped with a CCD camera (7100, Leica, Germany). The motion of particles and cells was recorded at 10 frames per second in horizontal direction, and the average levitation heights for beads were measured by calibration of a microscope focus dial. Labeled bacteria were introduced into the DEP chip by pipetting 10 μL of particles suspension. If the applied voltage was higher than 6 V (meanwhile f < 1 kHz), electrochemical dissolution of Al electrodes would occur.
4. Results and discussion
All DEP data were obtained under standardized operating conditions. A functional generator was used to trigger a sine wave of 8 V peak-to-peak (Vpp) voltage. The manipulation for a duration of 5 min was repeated from 100 Hz to 70 MHz. The particles were trapped at the electrode edges or gaps at several frequencies per decade, and DEP spectra were thus obtained.4.1. Electric-field distribution and DEP force orientation
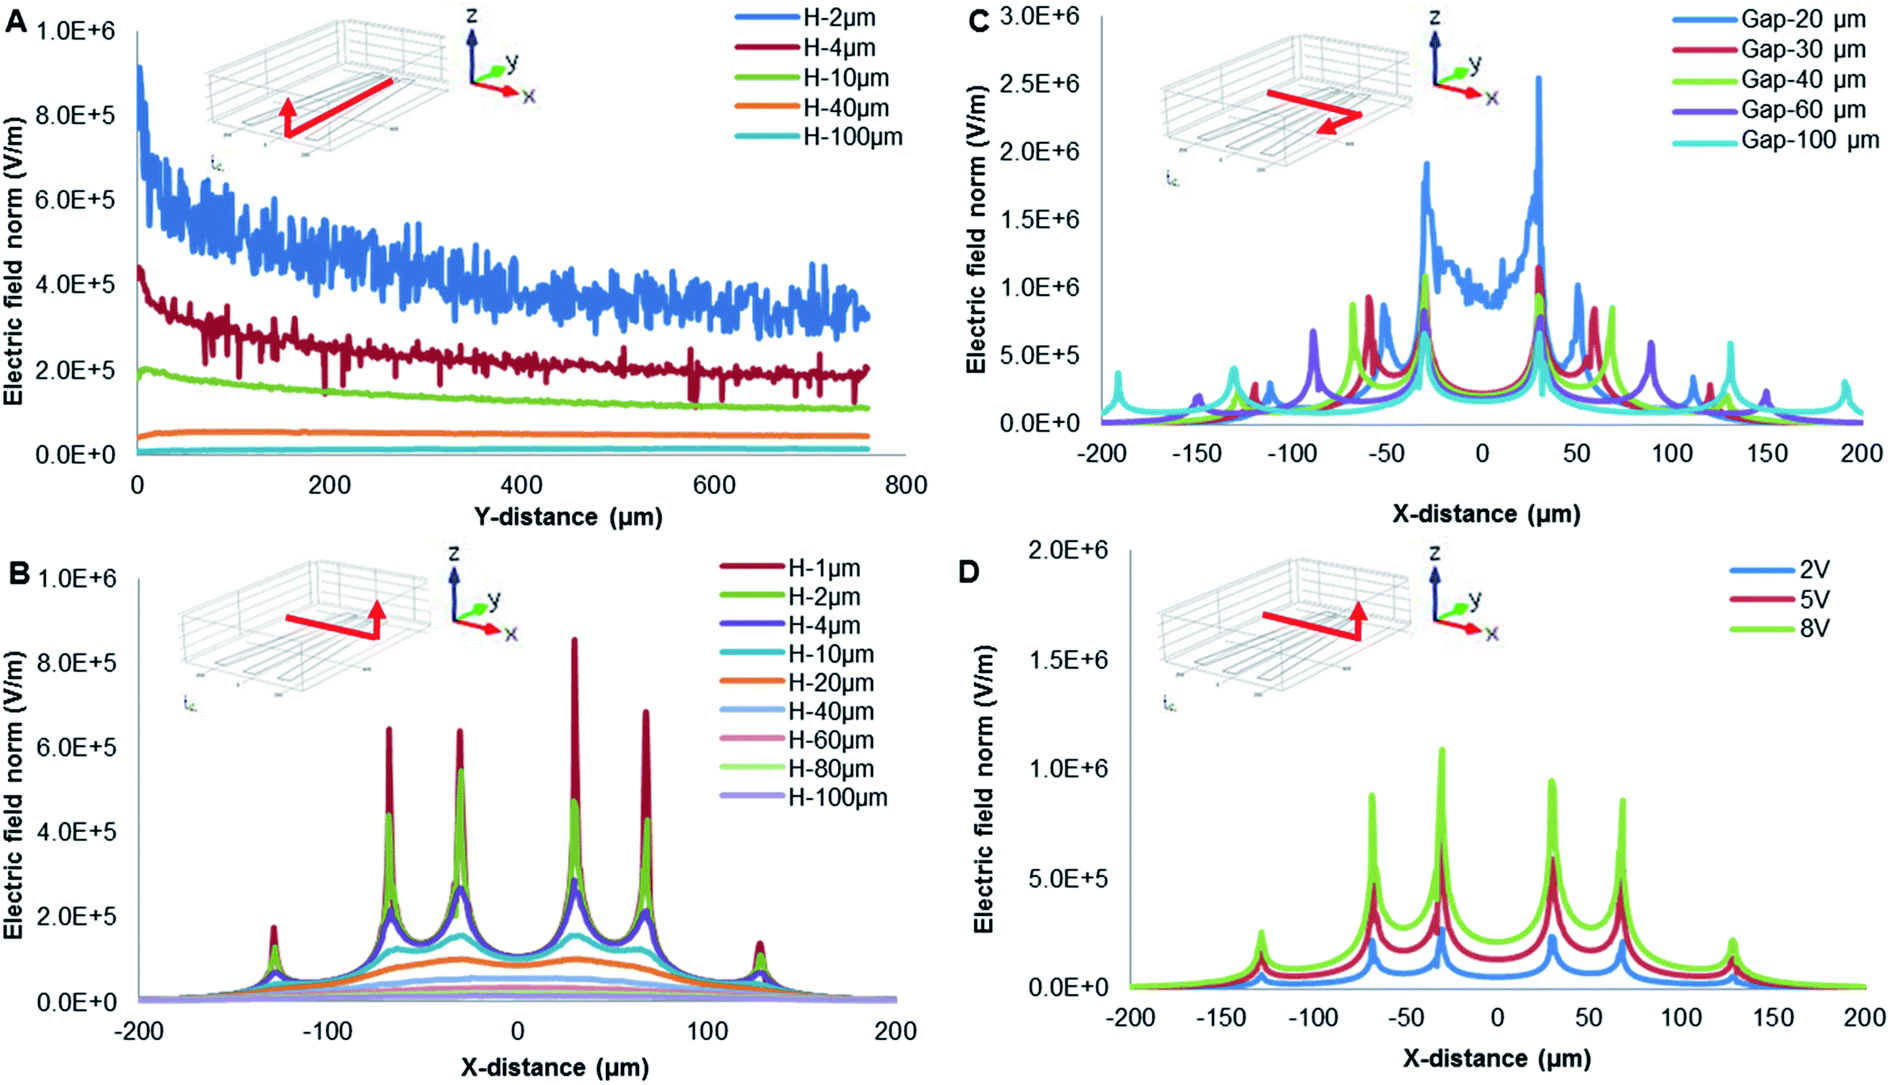 | ||
| Fig. 3 Electric field configurations of DEP simulation. (A) Electric-field distribution on the Z-axis in the Y-direction; (B) electric-field distribution on the Z-axis with gaps in the X-direction; (C) electric-field distribution on the Y-axis in the X-direction; (D) electric-field distribution on the Z-axis different voltages applied at 200 μm gap in the X-direction. | ||
In addition, DEP focusing behavior is mainly dominated by a high magnitude of voltages. The particles on a DEP chip could be manipulated to repel away from electrodes by varying the potential.
As presented in Fig. 4, calculations of DEP force for three typical cases (A) 1 μm PS beads, (B) 10 μm PS beads and (C) S. aureus were frequency dependent as predicted at 8 V. The conductivity and permittivity values of the different cell compartments deduced are in broad agreement with those found in literature.36 The relative parameters used of target particles and media were summarized in Table 1. The sharp peaks in the DEP force occurred at the edges of electrodes, coinciding with the location of the high field intensity gradients. The 1 μm PS beads experienced the strongest pDEP force at the frequency of ∼1 kHz, with 10 μm PS beads behaving nDEP force. Interestingly, S. aureus was provided with both pDEP and nDEP forces. It is exhibited the strongest pDEP force at ∼1 MHz, with the strongest nDEP force at ∼1 kHz. The frequency spectra are very different due to distinguishable characteristics of both PS beads and S. aureus, especially reflecting their morphological and dielectric specific properties. The Maxwell–Wagner theory is applicable for a diluted system of homogenous spherical particles, which is very sensitive to the cell membrane permittivity and conductivity. PS bead is a homogeneous particle, while S. aureus is a heterogeneous particle. The multi-shell model has been often considered for theoretical estimation of the CM factor for micro-organisms such as S. aureus. Charges could therefore be induced by an external electric field along a conductivity and/or permittivity gradient (either structural interfaces or inhomogeneous material). Since both induced charge and applied electric-field oscillate at the same frequency of the voltage signal, their product has a non-zero time-averaged value, resulting in a net DEP force being proportional to the field strength squared even in an AC field.
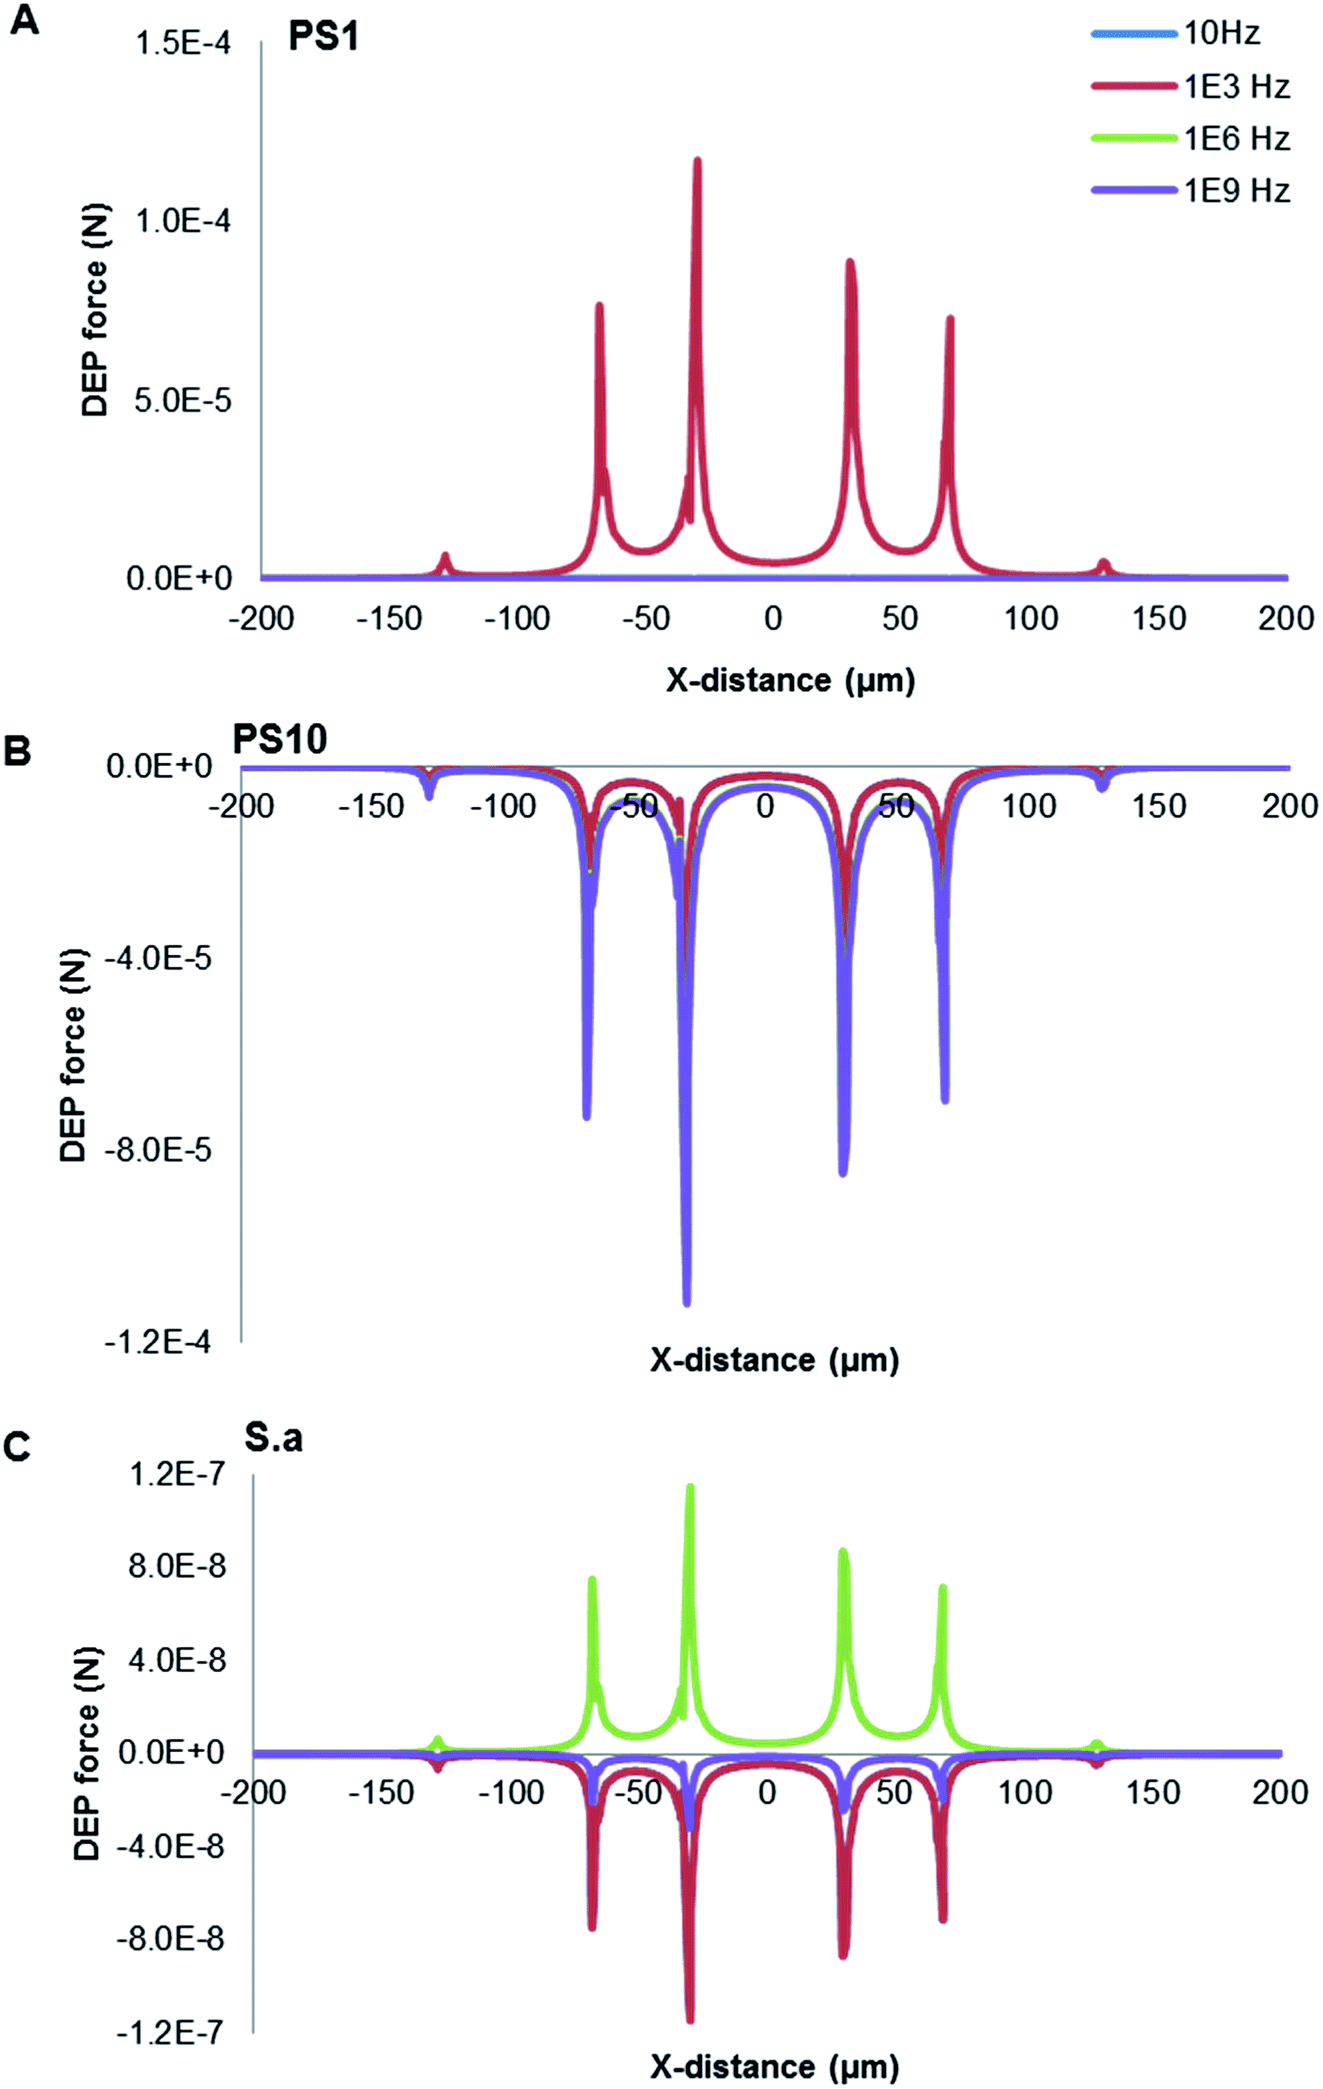 | ||
| Fig. 4 DEP force distribution over the electrode plane at different frequency in the X-direction distance. (A) 1 μm PS beads; (B) 10 μm PS beads; (C) S. aureus. | ||
4.2. The characterization of particle motion
The DEP direction of particle motion depends on polarization properties of both particles and suspend medium. Trajectories of particle motion are very important to conduct particle separation. The characterization of particle motion can be further classified into two categories, such as rotation and levitation, as shown in Fig. 5A.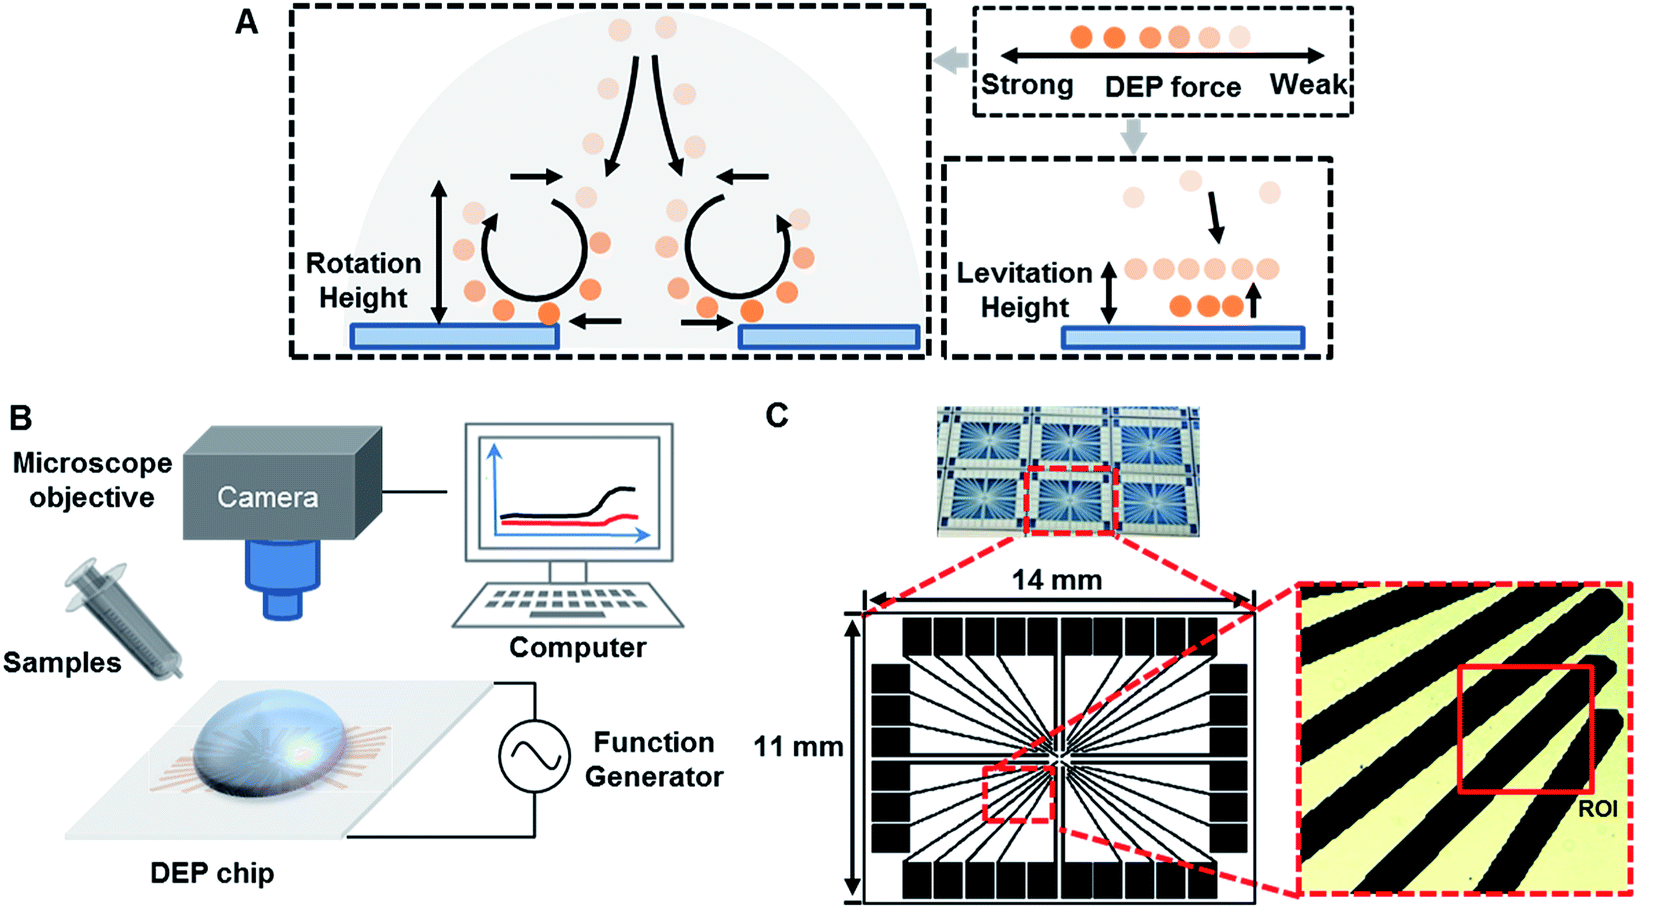 | ||
| Fig. 5 (A) Schematic diagrams of the mechanism of particles trajectories in the lateral direction. (B) Schematic diagram of a DEP-setup system. (C) Images of micro-electrodes fabricated and regions of interest (ROI) on a DEP chip. | ||
Initially, the appearance of the low frequency dispersion is surprising since the DEP force saturates in this frequency range to a constant value. The reduction in particle trapping occurs for the onset of ACEO by further examination, which is the origin of the dispersion. In this case, the particles showed the induced vortices by ACEO above the electrode edges, due to move from regions of high electric field (i.e., at the edges of the electrodes) to regions of low electric field (i.e., in the middle of the electrodes). The reduction in attractive pDEP force then makes it easier to shear the particles away from the electrode array, resulting in a decreased trapping amount.48
 | ||
| Fig. 6 Particle-motion behaviours (n = 4). (A) The rotation height of PS beads (10 μm, 6 μm, 1 μm), silica (1 μm) and ZnO beads (1 μm); (B) the levitation height of PS beads (10 μm, 6 μm, 1 μm), silica (1 μm) and ZnO beads (1 μm); (C) comparison of mathematical and experimental results at different conductivities of 0.2 mS m−1, 0.5 mS m−1, 1 mS m−1; (D) the velocity of different particles in ROI (8Vpp, 0.5 mS m−1). | ||
| f | PS-1 | PS-10 | Silica | ZnO | S. aureus |
|---|---|---|---|---|---|
| 1 kHz | pDEP + ACEO | nDEP | nDEP | nDEP + ACEO + gravity | nDEP |
| 10 kHz | pDEP + ACEO | nDEP | nDEP | pDEP + ACEO + gravity | pDEP + ACEO |
| 100 kHz | nDEP | nDEP | nDEP | pDEP + gravity | pDEP |
| 1 MHz | nDEP | nDEP | nDEP | pDEP + gravity | pDEP |
| 10 MHz | nDEP | nDEP | nDEP | pDEP + gravity | pDEP |
| 100 MHz | nDEP | nDEP | nDEP | pDEP + gravity | nDEP |
The rotation height of PS beads is inversely proportional to particle size under 5 kHz. Compared with 1 μm PS beads, the lower rotation height of 10 μm PS beads may be due to the low DEP force produced by weak polarization. It is likely that the bulk conductivity of the particle plays a more significant role in the total conductivity than that of just the surface as suggested in the literature. In addition, buoyancy and gravity were canceled out.38,52 A similar relationship exists between PS beads and silica: the rotation height of silica is smaller than that of PS beads because of the gravity acted on opposite direction. The rotation height of PS beads and ZnO particles in opposite directions were mainly due to the direction of DEP, as shown in Table 3.
| f = 1 kHz (pN) | PS-1 | PS-10 | Silica | ZnO | S. aureus |
|---|---|---|---|---|---|
| H-2μm | 365.84 | −250056.68 |
— | 522.23 | −250.89 |
| H-10 μm | 27.21 | −18596.53 |
— | 38.84 | −18.66 |
| H-40 μm | 6.68 | −4563.45 | — | 9.53 | −4.58 |
| H-100 μm | 0.52 | −291.61 | — | 0.61 | −0.29 |
| Gravity (pN) | 4.40 | 4400 | 23.5 | 73.7 | 4.61 |
The levitation height of particles as a function of frequency was shown in Fig. 6B. In addition, 10 μm PS beads were elevated up to 80 μm at 1 kHz and then moved away from the electrodes. Furthermore, 5.6 μm PS beads were levitated to 88 μm if the frequency was increased up to 100 kHz. Then, 1 μm PS beads were further levitated up to 100 μm (a highest point) at 100 kHz. When the size of PS beads was decreased, levitation was enhanced due to nDEP. With increasing particle size, the relative negative polarizability of induced dipole is enhanced due to a decrease in particle surface conductivity, thus increasing the magnitude of nDEP force field. A larger vertical distance from the electrode surface is therefore required for achieving a force balance, due to the gravity being affected by size. The utilization of a force balance between nDEP force and downward gravity can derive an analytical solution for the field squared divergence needed for realizing a steady particle stagnation.
By contrast, the levitation height of silica beads was increased with increasing frequency. ZnO beads were not levitated, and they are mainly due to gravity and the direction of DEP force. When the frequency ranged from 100 Hz to 1 GHz, ZnO beads experienced pDEP, as indicated in Table 2. The pDEP feature of ZnO beads would result in a non-levitation effect. The DEP force acting on gravity therefore levitates different particles to respective heights, potentially providing a vertical-separation. Depending on their vertical locations, the particles ultimately would result in practical horizontal-separation by DEP-on-a-chip architectures.
Distinct COF plays a key role in separating particles. Increasing suspending conductivity (σm) can increase COF value, even reverse its sign at low frequencies from positive to negative. However, Al substrate of DEP micro-electrodes experienced electrochemical corrosion at high conductivity solution. The suspending medium with conductivity of 0.5 mS m−1 was chosen for further experimental study. In DI water, COFs of 10 μm PS, 1 μm PS 1 μm silica and ZnO beads were, respectively, ∼3 kHz, 20–80 kHz, 5–10 kHz and 50–70 kHz. The COF of live cells was 70 kHz and 40 MHz, it experienced pDEP in the frequency range of 70 kHz to 40 MHz. The COF of dead cells was ∼60 kHz and 10 MHz, experiencing pDEP in the frequency range of ∼60 kHz to 10 MHz.
The PS beads' assembly rate increased as the frequency increased from 100 Hz to 8 kHz, then increased from negative to positive as the frequency increased from 8 kHz to 20 kHz referring to pDEP, and finally decreased as the frequency higher than 20 kHz by nDEP. By contrast, velocity of silica particles was increased when the frequency up to 1 kHz by pDEP, and then decreased dramatically with increasing frequency. The overall comparison of both PS beads and silica particles of their velocity and frequency indicates a similar trend.53 However, ZnO beads presented stable velocity by pDEP. As discussed in the significances of pDEP and nDEP, particles' horizontal-separation by DEP-on-a-chip architectures could be achieved due to practical manipulation of particles' flow velocity. The magnitude of DEP force (pN) was very large near the surface (H = 0–2 μm), and the rotation occurs dominantly by pDEP and ACEO if the frequency is below 10 kHz.
4.3. The separation of particles
All particles would sediment at the bottom surface of a micro-electrodes array or dissipate in a suspending medium, respectively, due to gravity or the Brownian motion without applying an electric field. Different particles in size are supposed to have individual DEP force as indicated in eqn (1) as a cubed radius term. Based on the polarization properties, particles can be separated by either positive, negative or using both DEP. | ||
| Fig. 7 Images of DEP phenomena. The AC signal frequency range 10 kHz to 40 MHz with amplitude of 8Vpp. (A) The frequency-sequenced separation of 1 and 10 μm PS beads, (a) 2 kHz, 1 μm PS beads moving to the electrode center, (b) 20 kHz, 1 μm PS beads concentrated at the electrode center, (c) 70 kHz, PS beads moved away from electrodes. Multimedia view: Fig. 7A.avi;† (B) the frequency-sequenced separation of 1 μm PS beads, ZnO and silica beads, (a) 2 kHz, PS and ZnO beads moved to the electrode center, while silica beads moved away from electrodes, (b) 10 kHz, PS beads concentrated at the electrode center, ZnO beads rotating around the electrode edge, (c) 70 kHz, all non-bioparticles moved away from electrodes. The white scale bar indicates 50 μm. Multimedia view: Fig. 7B.avi.† | ||
The local response of PS beads depends on their polarization with respect to the surrounding medium, as represented by Re[K(ω)].7 This dependency changes the response of PS beads at varied frequencies. The number of PS beads through their volume is proportional to the volume of PS beads.55 The conductivity of PS beads/liquid interface is usually different from that of bulk liquid or bulk particle, which is usually higher. The conductivity of PS beads is the sum of these volumes and surface contributions. The conductivity of PS beads therefore depends on the surface volume ratio of particles, and usually increasing with the increase of surface volume ratio. The small PS beads (1 μm) of a given material are usually more conductive than large PS beads (10 μm).
The aggregation of PS beads influences the overall behavior of the system, resulting in “less than ideal” separating efficiencies. Nevertheless, in the vicinity of microelectrode tips, this issue was alleviated since the 10 μm PS beads were either repelled toward the outer region of the electric field, or retained above the microelectrodes at low levitation heights, or trapped between the tips. The dimensions of used PS beads are similar to those of prokaryotic (∼1 μm)56 and eukaryotic cells (∼10 μm).4 The offered system has therefore a great potential for biological applications.
Silica beads are expected to have nDEP over 1 kHz, and moved away from micro-electrodes when frequency increased, as illustrated in Fig. 6A. At f = 10 kHz, zinc oxide beads were all rotated near the edge of micro-electrodes, while PS beads were still at the center of micro-electrodes, as shown in Fig. 7B(b). When the frequency was increased to 70 kHz, PS beads all moved away from micro-electrodes by nDEP; ZnO beads only stay on the edge of micro-electrodes as shown in Fig. 7B(c). PS beads and non-bioparticles were separated successfully at frequency of 10 kHz (see Fig. 7B.avi in ESI†). Zhao and Li27 previously utilized a nano-orifice based microfluidic device to separate PS beads and sliver-coated hollow glass beads by DC DEP (>120 V). Here, organic and inorganic beads (Sam-B) were therefore separated successfully, especially offering certain advantages of being mild process conditions.
The measured crossover frequency of the three types of particles were investigated in Honegger's experiment, but there is no suitable microelectrode chip to separate the three particles at the same time.38 According to different crossover frequency, three different types of particles can be separated at the same time in our work.
4.4. DEP manipulation of S. aureus
 | ||
| Fig. 8 The frequency-sequenced separation of PS beads and S. aureus by DEP utilizing transmission (A) and reflection (B) of optical microscopy. The samples with concentrations of 4.6 × 10⁷ particles per mL. The AC signal frequency range 10 kHz to 40 MHz with amplitude of 8Vpp. The effective frequency to separate S. aureus cells from non-bioparticles is from 70 kHz to 1 MHz for pDEP. The white scale bar indicates 50 μm. Multimedia view: Fig. 8.avi.† A(a) and B(a): 10 kHz, ZnO beads rotating around the electrode edge of, PS beads concentrated at the electrode center, while silica beads moved away from electrodes. A(b) and B(b): 70 kHz, ZnO beads still rotating around the electrode edge, most of PS beads and all silica beads moved away from electrodes. In contrast, S. aureus cells were to attract to the electrode gap. A(c) and B(c): 1 MHz, ZnO beads still rotating around the electrode edge, all of PS and silica beads moved away from electrodes. In contrast, more and more S. aureus cells concentrated at the electrode gap. A(d) and B(d): 40 MHz, all of non-bioparticles moved away from electrodes, while some S. aureus cells moved away from the gap. | ||
Beads and bioparticles (1 μm sized live S. aureus) were suspended in DI water and separated by varied frequencies. PS beads were trapped at the electrode center if frequency was 10 kHz as shown in Fig. 8A(a) and B(a), while silica beads moved away from micro-electrodes. S. aureus cells and ZnO beads were to be concentrated around the edge of micro-electrodes, where the electric field is strongest. S. aureus cells started to be concentrated in the gap of micro-electrodes, as shown in Fig. 8A(b). While PS beads were from the center to the edge of micro-electrodes at 70 kHz, as shown Fig. 8B(b). ZnO beads were still at the edge of micro-electrodes. The motion was presented in Fig. 8.avi of ESI.† One of the main reasons could be due to the gravity of ZnO beads being much greater than that of cells, as shown in Table 2. Another possible reason could be due to polarization of cells forming chains with adjacent cells. Up to 1 MHz, S. aureus was aligned in the gap (Fig. 8A(c)) and less dense on the micro-electrodes (Fig. 8B(c)), while non-bioparticles moved away from micro-electrodes. More and more S. aureus cells were aggregated at the gap. At 1 MHz, S. aureus was dominated by pDEP, polarized and distributed at the electrode edge where the electric field is strongest. As a result, S. aureus reaches the highest rate of aggregation at the edge of the electrode. As the frequency continues to increase, there is not much increase in S. aureus at the edge of the electrode. Finally, S. aureus was released at 40 MHz from the gap to the center of micro-electrodes, as indicated in Fig. 8A(d) and B(d).
The frequency of separation S. aureus from non-biological beads could be estimated from 70 kHz to 1 MHz. This phenomenon was in good agreement with the results by Shangguan et al.,57 for which S. aureus was enriched between the electrodes when the frequency was from 10 kHz to 10 MHz by pDEP. Here, the images of transmission and reflection provide valuable evidence regarding how S. aureus and non-biological beads locate themselves. Trapping usually comes from pDEP, but there is also a contribution from aggregated S. aureus cells on top of the micro-electrodes at frequencies if nDEP dominated, as especially shown in Fig. 8B(b). When the frequency above 70 kHz, non-bioparticles controlled by nDEP and moved away from micro-electrodes (see Fig. 8.avi in ESI†).
In summary, this tunable experimental system achieves differential trapping of cells and particles demonstrating the potential of AC-DEP for cell/particle discrimination and concentration. The controllable performance of the systems enables it to sort and retain specific particles from a mixed population.
 | ||
| Fig. 9 The accumulation and separation of live (A) and dead (B) 4.4 × 10⁷ cells per mL S. aureus by pDEP. An AC signal of amplitude 8Vpp was applied to micro-electrodes over the frequency range from 10 kHz to 40 MHz. (A): (a and b) 10–70 kHz, live cells concentrated at the electrode gap, (c) 10 MHz, some live cells were to move away from the electrode, (d) 40 MHz, most of live cells at gap of electrode. Multimedia view: Fig. 9A.avi† (B): (a and b) 10–70 kHz, dead cells were concentrated at the electrode gap, (c) 10 MHz, most of the dead cells moved away from the gap, (d) 40 MHz, only a few dead cells at the electrode edge. The white scale bar indicates 50 μm. Multimedia view: Fig. 9B.avi.† | ||
Increasing the frequency to 40 MHz, most of the live cells still stayed in the gap, while dead cells were not concentrated in the gap any more. The DEP force tends to decrease slightly with increasing frequency of the applied field. The midplane of the gaps is the only region over the electrode plane where the DEP force is substantially affected by frequency. The DEP responses of live and dead S. aureus cells show a striking contrast at the frequency range from 10 MHz to 40 MHz. These results agree qualitatively with the values of the CM factors shown in Table 1. At low frequencies, the applied electric field is primarily dropped across the outer cellular membrane, and the cells behave as poorly conductive spheres.55 At higher frequencies, the applied field is able to penetrate into the cells, and the cells behave more as conductive spheres having the conductivity of the cells' interior. Lapizco-Encinas et al.55 concentrated live and dead E. coli by DC-DEP, and dead cells have significantly lower DEP mobility than live cells. When a cell died, its membrane becomes permeable and the conductivity could increase by a factor of 104. The DEP separation of live and dead cells should be therefore possible, due to the differences of their membrane conductivities. The difference of electrophoresis mobility of dead and living cells in our work is obvious, which is easier to observe than that of other studies.55
5. Conclusions
A novel platform for separating particles according to their dielectric response to AC fields at specific frequencies was presented. The performance of DEP-on-a-chip was simulated using finite element methods by COMSOL. The DEP behaviors of PS beads with varied size, ZnO, silica beads and S. aureus cells at different frequencies were characterised, especially optimal frequency for particle separation. The various PS beads were experimentally separated from other non-bioparticles (e.g., ZnO and silica beads) at frequencies of 20 kHz and 10 kHz, respectively, as illustrated in Fig. 10. | ||
| Fig. 10 The optimal frequency range of DEP separation. | ||
When S. aureus cells implemented, the optimal frequency range of manipulation was from 70 kHz to 10 MHz by pDEP. In addition, the response of live and dead S. aureus cells showed a striking contrast at the frequency range of 10 MHz to 40 MHz. The separation by DEP at moderate frequencies is appropriate not only for separating cells from low dielectric particles, but also for separating cell mixtures. DEP-on-a-chip is expected to be a useful tool for sensing various environmental samples, including cells, proteins, and organic or soil particles, especially integration with highly sensitive quantification of surface acoustic wave.58
This electric field configuration is distinguished from the typical coplanar field arrangement by allowing the use of much lower frequencies and applied voltages to pattern and separate particles. The use of mildly applied voltages is favorable for manipulating biological cells. The proposed configuration produces complex non-uniform electric fields, which improve the separation efficiency of multi-particles. In addition, non-bioparticles and cells are positioned in a more precise and controllable manner to form a “strings of pearls”, spanning the gaps between adjoining micro-electrodes. In particular, low frequencies (<100 kHz) offer an advantage of considerably more rapid particle positioning and separation, compared to the results achieved at high frequencies (>100 kHz). The highly electric fields can generate fluid motion, resulting in a viscous drag force on particles.
Conflicts of interest
There are no conflicts to declare.Acknowledgements
The authors acknowledge support from National Natural Science Foundation of China (U1730131).References
- H. A. Pohl and J. S. Crane, Dielectrophoresis of cells, Biophys. J., 1971, 11(9), 711–727 CrossRef CAS PubMed.
- N. G. Green and H. Morgan, Dielectrophoretic investigations of sub-micrometre latex spheres, J. Phys. D: Appl. Phys., 1997, 30(18), 2626–2633 CrossRef CAS.
- T. B. Jones and G. W. Bliss, Bubble dielectrophoresis, J. Appl. Phys., 1977, 48(4), 1412–1417 CrossRef.
- W. M. Arnold, Positioning and levitation media for the separation of biological cells, IEEE Trans. Ind. Appl., 2001, 37(5), 1468–1475 CrossRef CAS.
- J. Lee, et al., Polymer microcantilever arrays for high-throughput separation using a combination of dielectrophoresis and sedimentations, BioChip J., 2011, 5(1), 8–13 CrossRef CAS.
- Y. J. Yuan, M. K. Andrews and B. K. Marlow, Chaining and dendrite formation of gold particles, Appl. Phys. Lett., 2004, 85(1), 130–132 CrossRef CAS.
- K. Khoshmanesh, et al., Size based separation of microparticles using a dielectrophoretic activated system, J. Appl. Phys., 2010, 108(3), 034904 CrossRef.
- H.-W. Su, J. L. Prieto and J. Voldman, Rapid dielectrophoretic characterization of single cells using the dielectrophoretic spring, Lab Chip, 2013, 13(20), 4109–4117 RSC.
- E. O. Adekanmbi and S. K. Srivastava, Dielectrophoretic applications for disease diagnostics using lab-on-a-chip platforms, Lab Chip, 2016, 16(12), 2148–2167 RSC.
- H.-C. Wang, et al., Characterizing Esophageal Cancerous Cells at Different Stages Using the Dielectrophoretic Impedance Measurement Method in a Microchip, Sensors, 2017, 17(5), 1053 CrossRef PubMed.
- S. Tokonami and T. Iida, Novel sensing strategies for bacterial detection based on active and passive methods driven by external field, Anal. Chim. Acta, 2017, 988, 1–16 CrossRef CAS PubMed.
- S. Emaminejad, et al., Multiplexed actuation using ultra dielectrophoresis for proteomics applications: a comprehensive electrical and electrothermal design methodology, Lab Chip, 2014, 14(12), 2105–2114 RSC.
- M. Javanmard, et al., Depletion of cells and abundant proteins from biological samples by enhanced dielectrophoresis, Sens. Actuators, B, 2014, 193, 918–924 CrossRef CAS PubMed.
- M. Javanmard, et al., Use of Negative Dielectrophoresis for Selective Elution of Protein-Bound Particles, Anal. Chem., 2012, 84(3), 1432–1438 CrossRef CAS PubMed.
- H. O. Fatoyinbo, M. C. McDonnell and M. P. Hughes, Dielectrophoretic sample preparation for environmental monitoring of microorganisms: soil particle removal, Biomicrofluidics, 2014, 8(4), 044115 CrossRef PubMed.
- Q. Chen and Y. J. Yuan, A review of polystyrene bead manipulation by dielectrophoresis, RSC Adv., 2019, 9(9), 4963–4981 RSC.
- M. A. Saucedo-Espinosa, et al., Polarization behavior of polystyrene particles under direct current and low-frequency (<1 kHz) electric fields in dielectrophoretic systems, Electrophoresis, 2016, 37(4), 635–644 CrossRef CAS PubMed.
- K. J. Freedman, et al., Nanopore sensing at ultra-low concentrations using single-molecule dielectrophoretic trapping, Nat. Commun., 2016, 7, 10217 CrossRef CAS PubMed.
- M. A. Saucedo-Espinosa and B. H. Lapizco-Encinas, Experimental and theoretical study of dielectrophoretic particle trapping in arrays of insulating structures: Effect of particle size and shape, Electrophoresis, 2015, 36(9–10), 1086–1097 CrossRef CAS PubMed.
- D. J. Allen, R. P. Accolla and S. J. Williams, Isomotive dielectrophoresis for parallel analysis of individual particles, Electrophoresis, 2017, 38(11), 1441–1449 CrossRef CAS PubMed.
- M. Elitas, et al., Dielectrophoresis as a single cell characterization method for bacteria, Biomed. Phys. Eng. Express., 2017, 3(1), 015005 CrossRef.
- M. Mohammadi, et al., Hydrodynamic and direct-current insulator-based dielectrophoresis (H-DC-iDEP) microfluidic blood plasma separation, Anal. Bioanal. Chem., 2015, 407(16), 4733–4744 CrossRef CAS.
- M. Safavieh, et al., Electrical response of a B lymphoma cell line latently infected with Kaposi's sarcoma herpesvirus, Biosens. Bioelectron., 2016, 80, 230–236 CrossRef CAS.
- C. Thomas, et al., Charge-based separation of particles and cells with similar sizes via the wall-induced electrical lift, Electrophoresis, 2017, 38(2), 320–326 CrossRef CAS PubMed.
- W. M. Arnold, Particle patterning using fluidics and electric fields, IEEE Trans. Dielectr. Electr. Insul., 2008, 15(1), 144–151 Search PubMed.
- A. T. J. Kadaksham, P. Singh and N. Aubry, Dielectrophoresis of nanoparticles, Electrophoresis, 2004, 25(21–22), 3625–3632 CrossRef CAS PubMed.
- K. Zhao and D. Li, Continuous separation of nanoparticles by type via localized DC-dielectrophoresis using asymmetric nano-orifice in pressure-driven flow, Sens. Actuators, B, 2017, 250, 274–284 CrossRef CAS.
- S. H. Baek, et al., Dielectrophoretic Technique for Measurement of Chemical and Biological Interactions, Anal. Chem., 2009, 81(18), 7737–7742 CrossRef CAS PubMed.
- C. M. White, L. A. Holland and P. Famouri, Application of capillary electrophoresis to predict crossover frequency of polystyrene particles in dielectrophoresis, Electrophoresis, 2010, 31(15), 2664–2671 CrossRef CAS PubMed.
- C. Zhang, et al., Dielectrophoretic separation of carbon nanotubes and polystyrene microparticles, Microfluid. Nanofluidics, 2009, 7(5), 633–645 CrossRef CAS.
- W. Liu, et al., A microscopic physical description of electrothermal-induced flow for control of ion current transport in microfluidics interfacing nanofluidics, Electrophoresis, 2019, 40(20), 2683–2698 CrossRef CAS PubMed.
- Y. Ren, et al., On hybrid electroosmotic kinetics for field-effect-reconfigurable nanoparticle trapping in a four-terminal spiral microelectrode array, Electrophoresis, 2019, 40(6), 979–992 CrossRef CAS.
- Y. Jia, et al., Sequential Coalescence Enabled Two-Step Microreactions in Triple-Core Double-Emulsion Droplets Triggered by an Electric Field, Small, 2017, 13(46), 1702188 CrossRef PubMed.
- L. Cui and H. Morgan, Design and fabrication of travelling wave dielectrophoresis structures, J. Micromech. Microeng., 2000, 10(1), 72–79 CrossRef CAS.
- R. C. Gallo-Villanueva, et al., Joule heating effects on particle immobilization in insulator-based dielectrophoretic devices, Electrophoresis, 2014, 35(2–3), 352–361 CrossRef CAS PubMed.
- A. Sanchis, et al., Dielectric characterization of bacterial cells using dielectrophoresis, Bioelectromagnetics, 2007, 28(5), 393–401 CrossRef CAS PubMed.
- E. Morganti, et al., A dielectrophoresis-based microdevice coated with nanostructured TiO2 for separation of particles and cells, Microfluid. Nanofluidics, 2011, 10(6), 1211–1221 CrossRef CAS.
- T. Honegger and D. Peyrade, Dielectrophoretic properties of engineered protein patterned colloidal particles, Biomicrofluidics, 2012, 6(4), 44115 CrossRef CAS.
- Q. Tao, M. Jiang and G. Li, Simulation and Experimental Study of Nanowire Assembly by Dielectrophoresis, IEEE Trans. Nanotechnol., 2014, 13(3), 517–526 CAS.
- H. Hwang, et al., Interactive manipulation of blood cells using a lens-integrated liquid crystal display based optoelectronic tweezers system, Electrophoresis, 2008, 29(6), 1203–1212 CrossRef CAS PubMed.
- C. Qian, et al., Dielectrophoresis for bioparticle manipulation, Int. J. Mol. Sci., 2014, 15(10), 18281–18309 CrossRef CAS PubMed.
- M. D. Pysher and M. A. Hayes, Electrophoretic and dielectrophoretic field gradient technique for separating bioparticles, Anal. Chem., 2007, 79(12), 4552–4557 CrossRef CAS PubMed.
- P. V. Jones, et al., Biophysical separation of Staphylococcus epidermidis strains based on antibiotic resistance, Analyst, 2015, 140(15), 5152–5161 RSC.
- S.-L. Tsai, et al., Experimental study of dielectrophoresis and liquid dielectrophoresis mechanisms for particle capture in a droplet, Electrophoresis, 2011, 32(11), 1337–1347 CrossRef CAS.
- A. H. Correia Pereira, et al., Methylene blue internalization and photodynamic action against clinical and ATCC Pseudomonas aeruginosa and Staphyloccocus aureus strains, Photodiagn. Photodyn. Ther., 2018, 22, 43–50 CrossRef.
- N. Lewpiriyawong, C. Yang and Y. C. Lam, Electrokinetically driven concentration of particles and cells by dielectrophoresis with DC-offset AC electric field, Microfluid. Nanofluidics, 2012, 12(5), 723–733 CrossRef CAS.
- S. Emaminejad, et al., Smart Surface for Elution of Protein-Protein Bound Particles: Nanonewton Dielectrophoretic Forces Using Atomic Layer Deposited Oxides, Anal. Chem., 2012, 84(24), 10793–10801 CrossRef CAS PubMed.
- D. Ben-Bassat, A. Boymelgreen and G. Yossifon, The influence of flow intensity and field frequency on continuous-flow dielectrophoretic trapping, J. Colloid Interface Sci., 2015, 442, 154–161 CrossRef CAS PubMed.
- L. Cui, D. Holmes and H. Morgan, The dielectrophoretic levitation and separation of latex beads in microchips, Electrophoresis, 2001, 22(18), 3893–3901 CrossRef CAS PubMed.
- N. Demierre, et al., Focusing and continuous separation of cells in a microfluidic device using lateral dielectrophoresis, Sens. Actuators, B, 2008, 132(2), 388–396 CrossRef CAS.
- I. S. Park, et al., Microfluidic Multifunctional Probe Array Dielectrophoretic Force Spectroscopy with Wide Loading Rates, ACS Nano, 2012, 6(10), 8665–8673 CrossRef CAS PubMed.
- H. Zhou, L. R. White and R. D. Tilton, Lateral separation of colloids or cells by dielectrophoresis augmented by AC electroosmosis, J. Colloid Interface Sci., 2005, 285(1), 179–191 CrossRef CAS PubMed.
- A. Ramos, et al., The role of electrohydrodynamic forces in the dielectrophoretic manipulation and separation of particles, J. Electrost., 1999, 47(1–2), 71–81 CrossRef CAS.
- D. F. Chen, H. Du and W. H. Li, Bioparticle separation and manipulation using dielectrophoresis, Sens. Actuators, A, 2007, 133(2), 329–334 CrossRef CAS.
- B. H. Lapizco-Encinas, et al., Dielectrophoretic concentration and separation of live and dead bacteria in an array of insulators, Anal. Chem., 2004, 76(6), 1571–1579 CrossRef CAS PubMed.
- D. Nakidde, et al., Three dimensional passivated-electrode insulator-based dielectrophoresis, Biomicrofluidics, 2015, 9(1), 014125 CrossRef.
- J. Shangguan, et al., A combination of positive dielectrophoresis driven on-line enrichment and aptamer-fluorescent silica nanoparticle label for rapid and sensitive detection of Staphylococcus aureus, Analyst, 2015, 140(13), 4489–4497 RSC.
- Z. Xu and Y. J. Yuan, Quantification of Staphylococcus aureus using surface acoustic wave sensors, RSC Adv., 2019, 9(15), 8411–8414 RSC.
Footnote |
| † Electronic supplementary information (ESI) available: Fig. 7A.avi: the frequency-sequenced separation of 1 and 10 μm PS beads, Fig. 7B.avi: the frequency-sequenced separation of 1-μm PS beads, ZnO and silica beads, Fig. 8.avi: the frequency-sequenced separation of PS beads and S. aureus, Fig. 9A.avi: live cells, Fig. 9B.avi: dead cells. See DOI: 10.1039/c9ra05886a |
| This journal is © The Royal Society of Chemistry 2020 |