 Open Access Article
Polyoxymethylene/silica/polylactic acid-grafted polyethylene glycol nanocomposites: structure, morphology, and mechanical properties and ozone and UV durability
Thuy Chinh Nguyen *ab,
Thi Mai Tranb,
Anh Truc Trinhb,
Anh Hiep Nguyenb,
Xuan Thang Damc,
Quoc Trung Vud,
Dai Lam Tranab,
Duy Trinh Nguyene,
Truong Giang Lef and
Hoang Thai*ab
aGraduate University of Science and Technology, Vietnam Academy of Science and Technology, 18 Hoang Quoc Viet, Cau Giay, Ha Noi, 100000, Vietnam
bInstitute for Tropical Technology, Vietnam Academy of Science and Technology, 18, Hoang Quoc Viet, Cau Giay, Ha Noi, 100000, Vietnam. E-mail: ntchinh@itt.vast.vn; hoangth@itt.vast.vn
cFaculty of Chemistry, Hanoi University of Industry, Minh Khai Commune, Bac Tu Liem, Ha Noi, 100000, Vietnam
dFaculty of Chemistry, Hanoi National University of Education, No. 136 Xuan Thuy Road, Cau Giay District, Ha Noi, 100000, Vietnam
eNTT Institute of High Technology, Nguyen Tat Thanh University, 300A Nguyen Tat Thanh, District 4, Ho Chi Minh City, 700000, Vietnam
fInstitute of Chemistry, Vietnam Academy of Science and Technology, 18, Hoang Quoc Viet, Cau Giay, Ha Noi, 100000, Vietnam
First published on 15th January 2020
Abstract
Polyoxymethylene (POM) is a semicrystalline thermoplastic that displays high tensile strength, thermal stability, and chemical durability. However, its widespread application is limited by its low elongation at break and thermal durability. In the present study, nanosilica (NS) and polylactic acid-grafted polyethylene glycol (PELA) were used as enhancement additives to improve the performance of POM homopolymer. Specifically, the POM/PELA/NS nanocomposites with a fixed NS content and varying PELA contents were prepared by a melt mixing method. The influence of the additives on the processability, and dynamic thermo-mechanical and tensile properties of the nanocomposites was evaluated by comparing the torque, mixing energy at melt state, storage modulus, shear stress, loss modulus, tan![[thin space (1/6-em)]](https://www.rsc.org/images/entities/char_2009.gif) δ, tensile strength, elongation at break and thermal degradation of the nanocomposites. The results showed that the combined addition of NS and PELA enhanced the thermal stability, tensile strength, elongation at break and chemical stability of the POM/PELA/NS nanocomposites owing to the good compatibility between PELA and the POM matrix. Furthermore, the morphology, and UV and ozone durability of POM and the nanocomposites were assessed and discussed.
δ, tensile strength, elongation at break and thermal degradation of the nanocomposites. The results showed that the combined addition of NS and PELA enhanced the thermal stability, tensile strength, elongation at break and chemical stability of the POM/PELA/NS nanocomposites owing to the good compatibility between PELA and the POM matrix. Furthermore, the morphology, and UV and ozone durability of POM and the nanocomposites were assessed and discussed.
Introduction
Polyoxymethylene (POM), also referred to as polyacetal or polyformaldehyde, is a semicrystalline thermoplastic possessing several attributes such as high tensile strength, high rigidity, low friction coefficient, and impact, thermal, chemical, and solvent resistance. POM can be prepared in two main forms as homopolymers and copolymers. POM homopolymers have high durability and good fatigue strength but are not easy to process. In contrast, POM copolymers have a lower melting point, good thermal stability, and good chemical durability, and are easy to process. At high processing temperatures, POM homopolymers are easily degraded by heat through either random chain scission or the depolymerization of the chain ends (unstable hydroxyl groups), resulting in the production of formaldehyde. To hinder the extent of depolymerization and enhance the stability of POM homopolymers, ethylene oxide units or stabilizers can be added during processing.1–3Furthermore, to broaden the application scope of POM, nanoadditives have been mixed or blended with melting POM.4–9 The presence of such additives can also improve the mechanical properties and thermal stability of POM. Various nanofillers have been examined for the preparation of POM-based nanocomposites, including nanosilica (NS),4–6 carbon nanotubes,7–9 montmorillonite,10–14 CaCO3,15 graphite,16 Al2O3,17 ZnO,18 hydroxyapatite,19,20 boehmite alumina,14,21 polyhedral oligomeric silsesquioxane,22,23 and NS and carbon fibers.24 POM can also been combined with ethylene–octene copolymer to improve the relaxation properties of POM.25 These results show that the presence of nanoadditives in POM matrix can enhance its mechanical properties, hardness, and thermal stability.
Among the nanoadditives exemplified above, NS is a popular additive used in polymers, coatings, and rubber materials owing to its high strength, thermal stability, specific surface area, and UV reflectance, as well as its ease of dispersion in polymer matrices.26–29 It is known that, relative to POM, POM/silica nanocomposites display enhanced physical and mechanical properties such as impact toughness, tensile strength, and heat distortion resistance. However, to date, there are only a few studies on this particular nanocomposite. For instance, in a study by Fu et al.,24 NS (1–5 wt%) was combined with CF (5–25 wt%) as additives for POM. The resulting POM composites displayed enhanced Young modulus, hardness, and friction. NS in the nanocomposites influenced the adhesion, dispersion, and interaction of CF with POM. In another study,6 Xiang et al. synthesized POM/NS nanocomposites by melt mixing method. The addition of NS up to a concentration of 5 wt% in POM raised the degradation temperature of the nanocomposites in inert gas and natural air, i.e., 38.3 and 43.8 °C, respectively, relative to that of POM.6
In our previous work, POM/NS nanocomposites with varying NS concentrations of 0.5–2 wt% were prepared by melt mixing method.30 The presence of NS up to a concentration of 1.5 wt% improved the mechanical and thermal properties of POM. At concentrations higher than 1.5 wt%, agglomerates were obtained, which led to a reduction in the mechanical, thermal, and dielectric properties of the POM/NS nanocomposites. In another study,31 polymer additives, i.e., linear low density polyethylene, ethylene vinyl acetate copolymer, polylactic acid-grafted polyethylene glycol (PELA), and stearate zinc, were used in combination with NS in POM matrix. The concentrations of the polymer additive and NS in POM were 5 and 1.5 wt%, respectively. Among the polymer additives studied, PELA yielded the best improvements in processability and mechanical strength of POM.
From past literature findings, it can be inferred that the introduction of NS and PELA, as additives to POM, can improve the properties (such as mechanical, thermal, morphological, and electrical) of the resulting nanocomposites. However, studies on the effect of such additives on the dynamic thermo-mechanical property, and UV and ozone durability of these nanocomposites to potentially expand their application scope are lacking. Therefore, in the present work, the influence of both PELA and NS on the torque, mixing energy, mechanical, and dynamic thermo-mechanical properties, and ozone and UV durability of POM is investigated. The PELA content is varied in the range of 1–5 wt%, while the POM/NS ratio is fixed at 100/1.5. The sample nomenclature of the different nanocomposites prepared is presented in Table 1.
| No. | POM weight (gram) | NS weight (gram) | PELA weight (gram) | Ratio or POM![[thin space (1/6-em)]](https://www.rsc.org/images/entities/char_2009.gif) : :![[thin space (1/6-em)]](https://www.rsc.org/images/entities/char_2009.gif) NS NS![[thin space (1/6-em)]](https://www.rsc.org/images/entities/char_2009.gif) : :![[thin space (1/6-em)]](https://www.rsc.org/images/entities/char_2009.gif) PELA PELA |
Abbreviation |
|---|---|---|---|---|---|
| 1 | 68.10 | 0 | 0 | 100![[thin space (1/6-em)]](https://www.rsc.org/images/entities/char_2009.gif) : :![[thin space (1/6-em)]](https://www.rsc.org/images/entities/char_2009.gif) 0 0![[thin space (1/6-em)]](https://www.rsc.org/images/entities/char_2009.gif) : :![[thin space (1/6-em)]](https://www.rsc.org/images/entities/char_2009.gif) 0 0 |
POM |
| 2 | 67.33 | 1.01 | 0 | 100![[thin space (1/6-em)]](https://www.rsc.org/images/entities/char_2009.gif) : :![[thin space (1/6-em)]](https://www.rsc.org/images/entities/char_2009.gif) 1.5 1.5![[thin space (1/6-em)]](https://www.rsc.org/images/entities/char_2009.gif) : :![[thin space (1/6-em)]](https://www.rsc.org/images/entities/char_2009.gif) 0 0 |
0PELA |
| 3 | 66.80 | 1.00 | 0.67 | 100![[thin space (1/6-em)]](https://www.rsc.org/images/entities/char_2009.gif) : :![[thin space (1/6-em)]](https://www.rsc.org/images/entities/char_2009.gif) 1.5 1.5![[thin space (1/6-em)]](https://www.rsc.org/images/entities/char_2009.gif) : :![[thin space (1/6-em)]](https://www.rsc.org/images/entities/char_2009.gif) 1 1 |
1PELA |
| 4 | 66.07 | 0.99 | 1.32 | 100![[thin space (1/6-em)]](https://www.rsc.org/images/entities/char_2009.gif) : :![[thin space (1/6-em)]](https://www.rsc.org/images/entities/char_2009.gif) 1.5 1.5![[thin space (1/6-em)]](https://www.rsc.org/images/entities/char_2009.gif) : :![[thin space (1/6-em)]](https://www.rsc.org/images/entities/char_2009.gif) 2 2 |
2PELA |
| 5 | 65.36 | 0.98 | 1.96 | 100![[thin space (1/6-em)]](https://www.rsc.org/images/entities/char_2009.gif) : :![[thin space (1/6-em)]](https://www.rsc.org/images/entities/char_2009.gif) 1.5 1.5![[thin space (1/6-em)]](https://www.rsc.org/images/entities/char_2009.gif) : :![[thin space (1/6-em)]](https://www.rsc.org/images/entities/char_2009.gif) 3 3 |
3PELA |
| 6 | 63.97 | 0.96 | 3.20 | 100![[thin space (1/6-em)]](https://www.rsc.org/images/entities/char_2009.gif) : :![[thin space (1/6-em)]](https://www.rsc.org/images/entities/char_2009.gif) 1.5 1.5![[thin space (1/6-em)]](https://www.rsc.org/images/entities/char_2009.gif) : :![[thin space (1/6-em)]](https://www.rsc.org/images/entities/char_2009.gif) 5 5 |
5PELA |
| 7 | 67.62 | 0.68 | 0 | 100![[thin space (1/6-em)]](https://www.rsc.org/images/entities/char_2009.gif) : :![[thin space (1/6-em)]](https://www.rsc.org/images/entities/char_2009.gif) 1 1![[thin space (1/6-em)]](https://www.rsc.org/images/entities/char_2009.gif) : :![[thin space (1/6-em)]](https://www.rsc.org/images/entities/char_2009.gif) 0 0 |
PN1 |
| 8 | 65.67 | 0.66 | 1.97 | 100![[thin space (1/6-em)]](https://www.rsc.org/images/entities/char_2009.gif) : :![[thin space (1/6-em)]](https://www.rsc.org/images/entities/char_2009.gif) 1 1![[thin space (1/6-em)]](https://www.rsc.org/images/entities/char_2009.gif) : :![[thin space (1/6-em)]](https://www.rsc.org/images/entities/char_2009.gif) 3 3 |
PN1P3 |
| 9 | 66.96 | 1.34 | 0 | 100![[thin space (1/6-em)]](https://www.rsc.org/images/entities/char_2009.gif) : :![[thin space (1/6-em)]](https://www.rsc.org/images/entities/char_2009.gif) 2 2![[thin space (1/6-em)]](https://www.rsc.org/images/entities/char_2009.gif) : :![[thin space (1/6-em)]](https://www.rsc.org/images/entities/char_2009.gif) 0 0 |
PN2 |
| 10 | 65.05 | 1.30 | 1.95 | 100![[thin space (1/6-em)]](https://www.rsc.org/images/entities/char_2009.gif) : :![[thin space (1/6-em)]](https://www.rsc.org/images/entities/char_2009.gif) 2 2![[thin space (1/6-em)]](https://www.rsc.org/images/entities/char_2009.gif) : :![[thin space (1/6-em)]](https://www.rsc.org/images/entities/char_2009.gif) 3 3 |
PN2P3 |
Experimental
Materials
POM (Kepital® F20-03, in pellet) was purchased from Korea Engineering Plastics Co., Ltd. (Seoul, South Korea) with a density of 1.41 g cm−3 and a melt flow index of 9 g/10 min at 190 °C with a standard weight of 2.16 kg. NS powder with a particle size of 10–20 nm was purchased from Sigma-Aldrich Co. (MO 63103, USA). PELA (pellet, molecular weight of 100![[thin space (1/6-em)]](https://www.rsc.org/images/entities/char_2009.gif) 000 g mol−1) was purchased from Nature World (Seoul, South Korea).
000 g mol−1) was purchased from Nature World (Seoul, South Korea).
Preparation of POM/PELA/NS nanocomposites
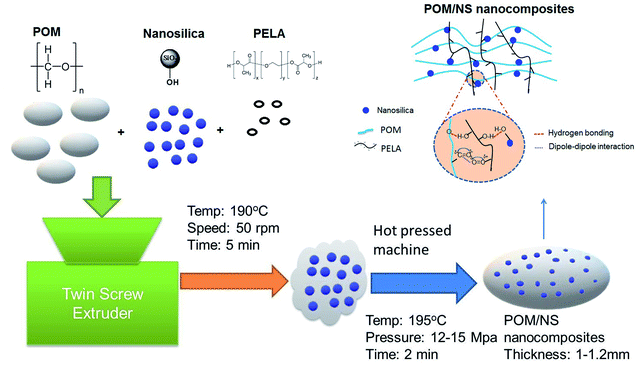
POM/PELA/NS nanocomposites were prepared by melt mixing method in a Haake Polylab rheomixer (Thermo Fisher Scientific, Karlsruhe, Germany) set at a filling coefficient of 0.7, mixing temperature of 190 °C, mixing time of 5 min, and a mixing speed of 50 rpm. After melt mixing, the samples were molded by a hot press molding machine (Toyo Seiki Kogyo Co., Ltd., Nagano, Japan) at 195 °C and pressure of 12–15 MPa for 2 min to obtain sheets of 1–1.2 mm in thickness. The samples were stored in air for 48 h before characterization. A schematic diagram of the preparation of the POM/NS nanocomposites is shown in Fig. 1. The composition and sample nomenclature used for the samples are presented in Table 1.Characterization
Torque and mixing energy of the POM/PELA/NS nanocomposites were recorded and calculated by the Polylab 3.1 software connected to the Haake rheomixer during mixing melt POM and PELA with NS.IR spectra of the nanocomposites as thin films were recorded on a Nicolet iS10 spectrometer (Thermo Fisher Scientific, Waltham, MA, USA) at room temperature by averaging of 32 scans with a resolution of 8 cm−1 in the wavenumber range of 400–4000 cm−1.
Tensile properties, i.e., tensile strength and elongation at break, of the nanocomposites were determined on a Zwick tensile 2.5 machine (Zwick Roell Group, Ulm, Germany) at room temperature according to ASTM D638 standard.
Morphology of the nanocomposites was analyzed on an S-4800 field-emission scanning electron microscope (Hitachi, Tokyo, Japan).
Dynamic mechanical thermal analysis of the nanocomposites was carried out on an MCR302 instrument (Anton Paar, Graz, Austria) within a temperature range of −120 to 200 °C in nitrogen, heating rate of 3 °C min−1, frequency of 1 Hz, and deformation of 0.1%. The size of the test sample was 50 × 10 × 0.65 mm3.
Thermal property of POM/PELA/NS nanocomposites was performed on the TGA209F1 (NETZSCH, Selb, Germany) under nitrogen atmosphere from room temperature to 600 °C with a heating rate of 10 °C min−1.
Ozone durability of the nanocomposites was assessed in an OTC-1 accelerated ozone test cabinet (In USA, Inc., Needham, MA, USA) according to ISO 1431 standard. The sample was placed in the chamber, which was set at an ozone concentration level of 2.5 ppm, temperature of 35 °C, and a testing time of 72 h.
UV durability of the nanocomposites was assessed in a UV test cabinet that was built at the Institute for Tropical Technology, VAST, Vietnam according to TCVN11608-3:2016. The sample was placed in the chamber before being irradiated continuously under UV-C lamps for 72 h and at a temperature of 35 °C.
The ozone- and UV-tested samples were stored for at least 48 h before assessing their tensile properties and recording their IR spectra.
Results and discussion
Infrared spectra of POM/PELA/NS nanocomposites
Fig. 2 shows the infrared (IR) spectra of NS, POM, and the POM/PELA/NS nanocomposites. Characteristic peaks for POM were observed at 2920–2979 cm−1 (stretching vibration of C–H group), 2847–2849 cm−1 (stretching vibration of C–H aldehyde group), 1384–1467 cm−1 (bending vibration of C–H group), 1234–1236 cm−1 (asymmetric stretching vibration of C–O group), 888–892 cm−1 (symmetric stretching vibration of C–O group), and 627–630 cm−1 (out-of-plane vibration of C–H group) and characteristic peaks for NS were observed at 1086–1087 cm−1 (asymmetric stretching vibration of Si–O group) and 803 cm−1 (symmetric stretching vibration of Si–O group).20 The IR spectra of the POM/PELA/NS nanocomposites featured an additional peak at 1757–1758 cm−1, corresponding to the stretching vibration of C![[double bond, length as m-dash]](https://www.rsc.org/images/entities/char_e001.gif) O group in PELA. In addition, the slight shift in the wavenumber of the C–O (2 cm−1) and Si–O (85–89 cm−1) groups as well as the increase in the intensity of the C
O group in PELA. In addition, the slight shift in the wavenumber of the C–O (2 cm−1) and Si–O (85–89 cm−1) groups as well as the increase in the intensity of the C![[double bond, length as m-dash]](https://www.rsc.org/images/entities/char_e001.gif) O vibration peak in the IR spectra of the nanocomposites were attributed to hydrogen bonding between PELA, NS, and POM.
O vibration peak in the IR spectra of the nanocomposites were attributed to hydrogen bonding between PELA, NS, and POM.
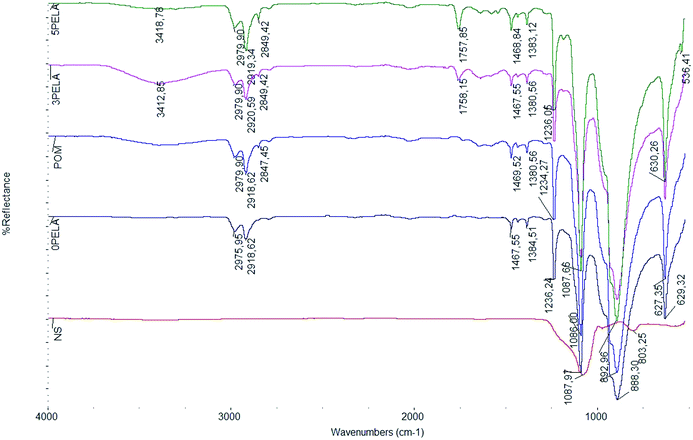 | ||
| Fig. 2 IR spectra of NS, POM, and the POM/PELA/NS nanocomposites prepared with different PELA contents. | ||
Torque and mixing energy of POM/PELA/NS nanocomposites
Fig. 3 presents the torque and mixing energy diagrams of the POM/PELA/NS nanocomposites. The torque of the nanocomposites at different PELA contents differed slightly in contrast to the mixing energy of the nanocomposites, which showed large variations. As observed from Table 2, the total mixing energy of the nanocomposites was lower than that of neat POM except for 1PELA (nanocomposite using 1 wt% PELA), which showed the highest total mixing energy among the nanocomposites and neat POM. This considerable increase was attributed to the cross-linking reaction of PELA with POM at high temperature when using a relatively low PELA content. In general, the reduced torque and mixing energy displayed by the nanocomposites (involving both PELA and NS) indicate the ease of preparation of the latter materials when compared with neat POM. PELA is believed to act as both a lubricant and a plasticizer, while NS serves as a processing agent in facilitating the preparation of the nanocomposites. The addition of NS and PELA to the POM macromolecules can lower the internal friction in melt mixing process and raise the thermal degradation temperature of POM.2,12,24 Therefore, the energy requirements for melt mixing process of the nanocomposites are lower than that of POM.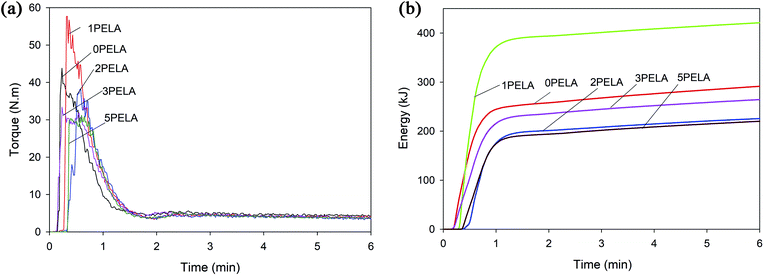 | ||
| Fig. 3 (a) Torque and (b) mixing energy diagrams of the POM/PELA/NS nanocomposites prepared with different PELA contents. | ||
| Sample | POM | 0PELA | 1PELA | 2PELA | 3PELA | 5PELA |
|---|---|---|---|---|---|---|
| Stable torque (nm) | 4.89 | 4.10 | 4.08 | 3.80 | 4.03 | 3.90 |
| Total mixing energy (kJ) | 111![[thin space (1/6-em)]](https://www.rsc.org/images/entities/char_2009.gif) 079.8 079.8 |
89![[thin space (1/6-em)]](https://www.rsc.org/images/entities/char_2009.gif) 580.22 580.22 |
132![[thin space (1/6-em)]](https://www.rsc.org/images/entities/char_2009.gif) 161.10 161.10 |
66![[thin space (1/6-em)]](https://www.rsc.org/images/entities/char_2009.gif) 729.61 729.61 |
80![[thin space (1/6-em)]](https://www.rsc.org/images/entities/char_2009.gif) 499.96 499.96 |
65![[thin space (1/6-em)]](https://www.rsc.org/images/entities/char_2009.gif) 253.89 253.89 |
Dynamic thermo-mechanical properties of POM/PELA/NS nanocomposites
Changes in the storage modulus (G′) of POM and the POM/PELA/NS nanocomposites as a function of temperature measured at a frequency of 1 Hz are displayed in Fig. 4. The phase transition from glass to the elastic region of POM and the nanocomposites, which was observed at around −70 °C, was assigned to γ-relaxation.3,21,32 The α-transition of POM appeared at about 100 °C and relates to the movement of long molecular segments in well-ordered crystalline phases.32,33 The G′ of POM and the nanocomposites gradually decreased with increasing temperature owing to the increase in the flexibility of polymer circuits in the high temperature region. The largest reduction in G′ was recorded in the glass region. The addition of 1.5 wt% NS into POM matrix (0PELA) led to a sudden increase in G′—i.e., at −120 °C, the G′ values of POM and 0PELA were 2668.5 and 4000.1 MPa, respectively. This increase can be explained by the dispersion of rigid NS in POM macromolecules that restricts the deformation of the POM chains, thereby resulting in a “hard” nanocomposite. A similar trend was observed in POM/Al2O3 nanocomposite.21 In contrast, at −120 °C, the G′ values of 1PELA, 2PELA, 3PELA, and 5PELA were 3239.2, 3317.5, 3826.7, and 3385.0 MPa, respectively. Thus, upon introduction of PELA, the G′ value of the resulting nanocomposites decreased (relative to the G′ value of 0PELA), suggesting that deformation of the POM chains in those nanocomposites occurred more easily, i.e., the nanocomposites became “softer”. From these results, it can be inferred that PELA serves as a plasticizer, a dispersion aid agent, and a compatibilizer in the synthesis of POM/NS nanocomposites.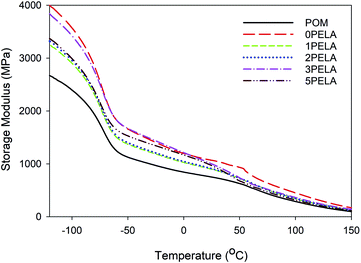 | ||
| Fig. 4 Storage modulus diagrams of the POM/PELA/NS nanocomposites prepared with different PELA contents. | ||
From Fig. 4, it was also observed that the G′ value of the nanocomposites was higher than that of neat POM, regardless of the addition of PELA. This result indicates that the nanocomposites have better thermo-stability and experience reduced distortion at elevated temperature when compared with neat POM.
Variations in the sheer stress as a function of temperature of POM and the POM/PELA/NS nanocomposites were measured, and the results are shown in Fig. 5. The trends obtained were similar to the trends obtained for G′. The sheer stress value of the nanocomposites was higher than that of neat POM, which is also indicative of the higher thermo-stability of the nanocomposites relative to neat POM.
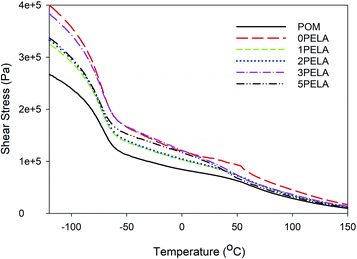 | ||
| Fig. 5 Shear stress diagrams of the POM/PELA/NS nanocomposites prepared with different PELA contents. | ||
Fig. 6 shows changes in the loss modulus (G′′) of POM and the POM/PELA/NS nanocomposites. Two phase transition peaks were observed that corresponded to the phase transition from glass to the elastic region and from the elastic to the melting region of POM and the nanocomposites. The first peak appeared at −73.07, −74.21, −73.64, −74.26, −73.78, and −74.29 °C for POM, 0PELA, 1PELA, 2PELA, 3PELA, and 5PELA, respectively. The second peak was observed at 93.67, 101.89, 98.63, 99.21, 99.03, and 98.17 °C for POM, 0PELA, 1PELA, 2PELA, 3PELA, and 5PELA, respectively. The presence of NS and PELA caused a slight decrease in the glass transition temperature and an increase in the melting transition temperature of POM. In the nanocomposites, most NS particles inside were impacted by tension force and only some NS particles at the surface of the polymer–particle phase were deformed.24 In addition, it was observed that the small peak at 50 °C noted in the diagram of 5PELA, which corresponds to the glass transition of PELA, was absent in the diagrams of 1PELA, 2PELA, and 3PELA. At these lower PELA contents (1–3 wt%), PELA was compatible with the POM matrix. Accordingly, PELA was prone to deformation as POM was subject to deformation. Therefore, both NS and PELA displayed minimal influence on the flexibility of POM.34 These results confirm that the nanocomposites display higher thermo-stability and processability at low temperatures when compared with neat POM.
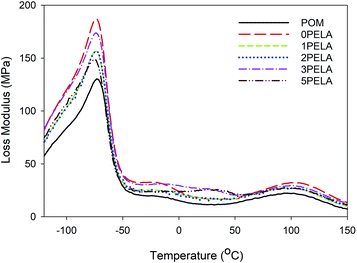 | ||
| Fig. 6 Loss modulus diagrams of the POM/PELA/NS nanocomposites prepared with different PELA contents. | ||
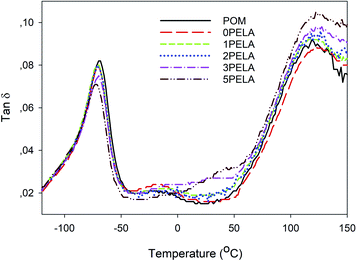
The tan![[thin space (1/6-em)]](https://www.rsc.org/images/entities/char_2009.gif) δ diagrams of POM and the POM/PELA/NS nanocomposites are shown in Fig. 7. The nanocomposites displayed tan
δ diagrams of POM and the POM/PELA/NS nanocomposites are shown in Fig. 7. The nanocomposites displayed tan![[thin space (1/6-em)]](https://www.rsc.org/images/entities/char_2009.gif) δ values of less than 1, which is indicative that G′′ is smaller than G′. Using the tan
δ values of less than 1, which is indicative that G′′ is smaller than G′. Using the tan![[thin space (1/6-em)]](https://www.rsc.org/images/entities/char_2009.gif) δ value, the glass temperature values of POM, 0PELA, 1PELA, 2PELA, 3PELA, and 5PELA were determined to be −68.26, −71.40, −70.99, −71.47, −69.68, and −74.29 °C, respectively. The small reduction in the glass temperature observed for the nanocomposites (relative to that of POM) was attributed to the thermal conductive ability of NS and the lower number of chain ends and lower mobility of POM near the NS surface.20
δ value, the glass temperature values of POM, 0PELA, 1PELA, 2PELA, 3PELA, and 5PELA were determined to be −68.26, −71.40, −70.99, −71.47, −69.68, and −74.29 °C, respectively. The small reduction in the glass temperature observed for the nanocomposites (relative to that of POM) was attributed to the thermal conductive ability of NS and the lower number of chain ends and lower mobility of POM near the NS surface.20
Mechanical properties of POM/PELA/NS nanocomposites
The mechanical properties, i.e., tensile strength and elongation at break of POM and the POM/PELA/NS nanocomposites are presented in Table 3. Neat POM displayed a relatively high tensile strength but a rather low elongation at break. Thus, herein, NS and PELA were introduced as additives in an attempt to synergistically improve the tensile strength and elongation at break of POM. From Table 3, it was observed that the tensile strength and elongation at break of POM was slightly improved upon introduction of 1.5 wt% NS (0 wt% PELA; 0PELA). In contrast, a larger improvement was obtained upon addition of both NS (1.5 wt%) and PELA (1–5 wt%). The tensile strength was maximum when 2 wt% PELA was used (increase of 15.90% relative to neat POM). An improvement in the tensile strength along with a reduction in elongation at break was also observed for POM/hydroxy apatite-grafted polyethylene glycol (HAP-g-PEG) nanocomposite at 1 wt% HAP-g-PEG.20 The elongation at break of the POM/PELA/NS nanocomposites varied with no specific trend and reached a maximum value at 3 wt% of PELA (increase of 6.54% relative to neat POM). The improvement observed for the tensile strength of the nanocomposites containing both NS and PELA can be attributed to the structure of the nanocomposites, which becomes “tight”, thus enabling an even distribution of stress throughout the structure upon application of a force.6,24 Consequently, the nanocomposites experienced a lower degree of deformation and were more durable under an applied force. In addition, the formation of hydrogen bonds between the hydroxyl groups of NS, C![[double bond, length as m-dash]](https://www.rsc.org/images/entities/char_e001.gif) O, C–O groups in PELA and C–O and C
O, C–O groups in PELA and C–O and C![[double bond, length as m-dash]](https://www.rsc.org/images/entities/char_e001.gif) O groups in end-aldehyde branch of POM molecules contributed to the formation of a more uniform structure for the nanocomposites. The atypical change in the elongation at break of the nanocomposites may be due to the difference in dispersibility of PELA and NS and the interaction of PELA at different contents in the POM matrix. From the results in Table 3, the addition of 3 wt% PELA and 1.5 wt% NS was the most suitable for enhancing both the tensile strength and elongation at break of POM. These findings are consistent with our previous work, wherein PELA and NS were used as additives to enhance the tensile properties of ethylene vinyl acetate copolymer.35,36
O groups in end-aldehyde branch of POM molecules contributed to the formation of a more uniform structure for the nanocomposites. The atypical change in the elongation at break of the nanocomposites may be due to the difference in dispersibility of PELA and NS and the interaction of PELA at different contents in the POM matrix. From the results in Table 3, the addition of 3 wt% PELA and 1.5 wt% NS was the most suitable for enhancing both the tensile strength and elongation at break of POM. These findings are consistent with our previous work, wherein PELA and NS were used as additives to enhance the tensile properties of ethylene vinyl acetate copolymer.35,36
| Sample | Tensile strength (MPa) | Elongation at break (%) |
|---|---|---|
| POM | 59.25 | 14.52 |
| 0PELA | 61.37 | 14.74 |
| 1PELA | 67.81 | 12.49 |
| 2PELA | 68.67 | 12.69 |
| 3PELA | 65.07 | 15.47 |
| 5PELA | 61.46 | 12.93 |
| PN1 | 64.95 | 13.90 |
| PN1P3 | 65.36 | 14.85 |
| PN2 | 59.40 | 12.48 |
| PN2P3 | 59.26 | 11.57 |
In case of varying the NS content and fixing PELA content, it is clear that NS content at 2 wt%, the tensile strength and elongation at break was decreased for the nanocomposites with and without PELA. The increase of NS content can lead to the strong decrease in tensile properties of the nanocomposites due to the agglomeration of NS in polymer matrix. PELA exhibited the role of a compatibilizer in improvement the tensile strength and elongation at break of the nanocomposites at low NS contents.
Morphology of POM/PELA/NS nanocomposites
Field-emission scanning electron microscopy (FESEM) images of impact-fractured surfaces of POM and the POM/PELA/NS nanocomposites at the different magnifications are shown in Fig. 8 and 9. At the lower magnification, the morphology of POM and the nanocomposites appeared similar, with small cracks generated upon fracture. NS in the nanocomposites were visible (Fig. 8b–f). The cracks in 5PELA were larger than those in the remaining samples. Such larger cracks are expected to contribute to the lower tensile strength observed for 5PELA when compared with the remaining nanocomposites.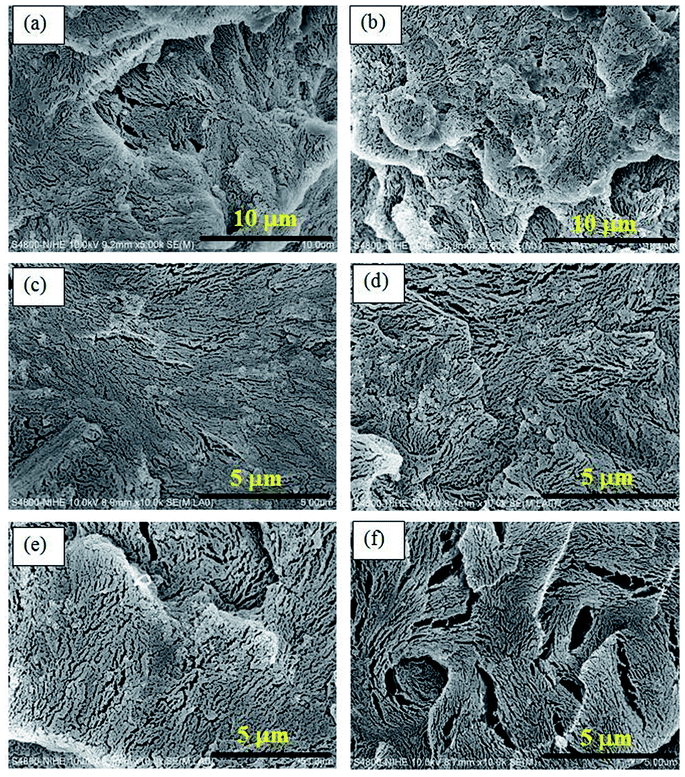 | ||
Fig. 8 FESEM images of impact-fractured surfaces of POM and the nanocomposites at magnification of 5000× and 10![[thin space (1/6-em)]](https://www.rsc.org/images/entities/char_2009.gif) 000×: (a) POM, (b) 0PELA, (c) 1PELA, (d) 2PELA, (e) 3PELA, and (f) 5PELA. 000×: (a) POM, (b) 0PELA, (c) 1PELA, (d) 2PELA, (e) 3PELA, and (f) 5PELA. | ||
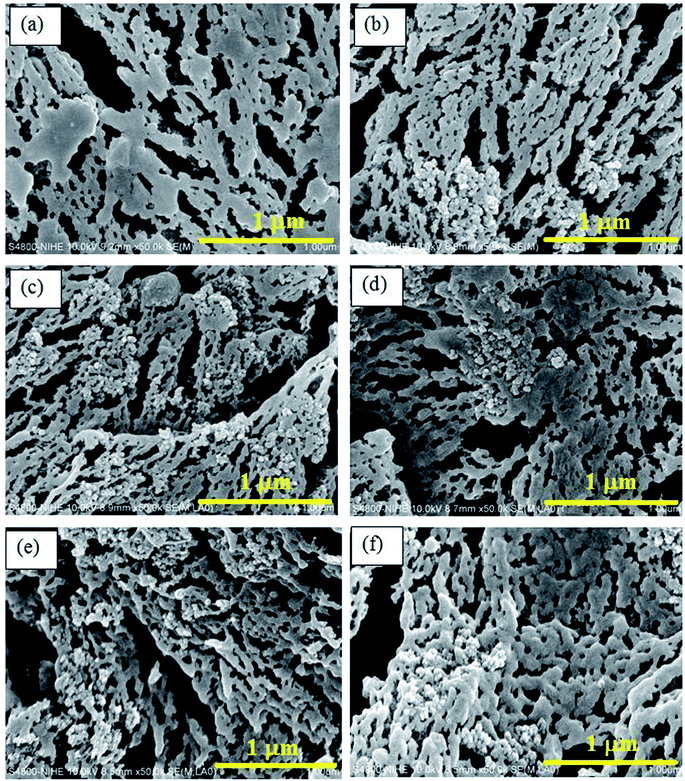 | ||
Fig. 9 FESEM images of impact-fractured surfaces of POM and the nanocomposites at a magnification of 50![[thin space (1/6-em)]](https://www.rsc.org/images/entities/char_2009.gif) 000×: (a) POM, (b) 0PELA, (c) 1PELA, (d) 2PELA, (e) 3PELA, and (f) 5PELA. 000×: (a) POM, (b) 0PELA, (c) 1PELA, (d) 2PELA, (e) 3PELA, and (f) 5PELA. | ||
To better evaluate the structure of POM and the dispersion of NS in the nanocomposites, FESEM images of impact-fractured surfaces of POM and the nanocomposites at a higher magnification (50![[thin space (1/6-em)]](https://www.rsc.org/images/entities/char_2009.gif) 000×) were captured (Fig. 9). The POM molecules are linked and arranged into continuous chains, which are intertwined to form POM sheets. The voids between the chains are believed to contribute to the rather low elongation at break of POM. In contrast, in the nanocomposites, the NS particles fill those voids as they tend to agglomerate in the presence of an applied stress. The introduction of PELA into the POM/NS nanocomposite led to the insertion of the PELA chains in the POM macromolecules. Phase separation between PELA and POM matrix was not observed owing to their good compatibility. In addition, it is likely that the interaction between PELA and NS with POM enhances the uniform dispersion of NS in the POM matrix. Therefore, NS serves as a barrier-endured stress for the nanocomposites. These led to increase in the tensile strength of POM using both NS and PELA.18
000×) were captured (Fig. 9). The POM molecules are linked and arranged into continuous chains, which are intertwined to form POM sheets. The voids between the chains are believed to contribute to the rather low elongation at break of POM. In contrast, in the nanocomposites, the NS particles fill those voids as they tend to agglomerate in the presence of an applied stress. The introduction of PELA into the POM/NS nanocomposite led to the insertion of the PELA chains in the POM macromolecules. Phase separation between PELA and POM matrix was not observed owing to their good compatibility. In addition, it is likely that the interaction between PELA and NS with POM enhances the uniform dispersion of NS in the POM matrix. Therefore, NS serves as a barrier-endured stress for the nanocomposites. These led to increase in the tensile strength of POM using both NS and PELA.18
The FESEM images of fractured surfaces of POM/PELA/NS composites at different NS content and fixed PELA content are presented in Fig. 10. The agglomeration of NS can be observed for PN2 sample. Using PELA, the agglomeration of NS particles in the nanocomposites tends to decrease. The fractured surface of PN1P3 and PN2P3 is smoother than that of PN1 and PN2 corresponding to the better dispersion of NS in POM matrix in the presence of PELA compatibilizer.
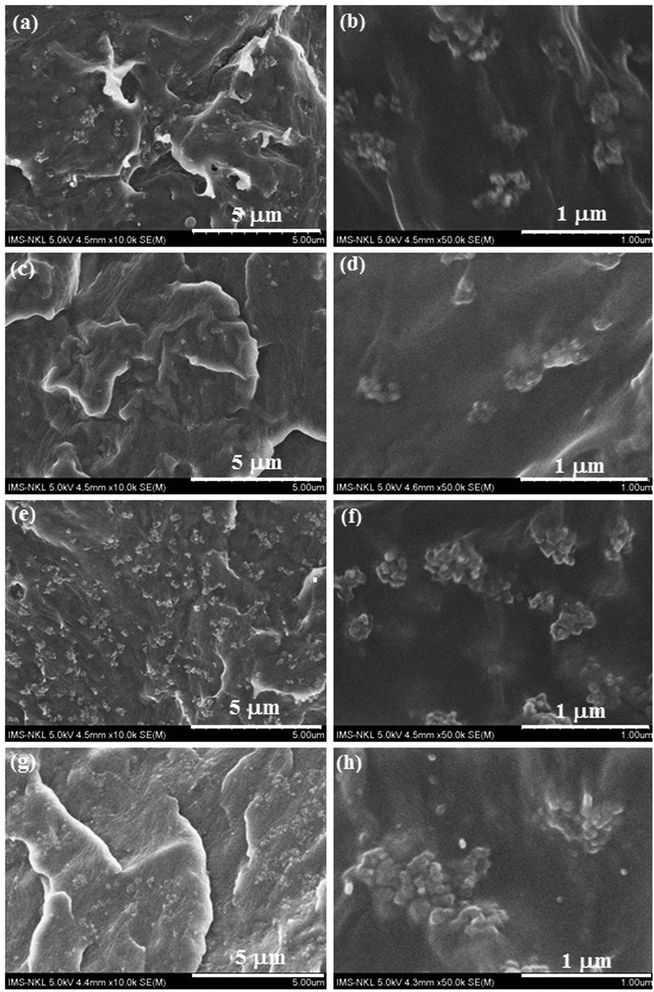 | ||
| Fig. 10 FESEM images of fractured surfaces of POM/PELA/NS composites: (a and b) PN1, (c and d) PN1P3, (e and f) PN2, and (g and h) PN2P3. | ||
Ozone and UV durability of POM/PELA/NS nanocomposites
The Society of Automotive Engineers standards prescribe that the different conditions that reflect the outdoor environment be applied to accelerated weathering tests depending on the interior or exterior application. For interior applications, cyclic conditions take days and nights into account, whereas for exterior applications, a water shower is used to simulate raining conditions. For evaluating the light resistance and weather resistance of plastics, changes in colorfastness, surface gloss, or mechanical properties are measured after exposure to outdoor or accelerated weathering. Therefore, for the application of POM nanocomposites in automotive or outdoor products, ozone and UV testing is necessary.POM and the POM/PELA/NS nanocomposites were examined under UV irradiation, using UV-C lamps, for 72 h at 35 °C and in an acceleration ozone chamber at an ozone concentration level of 2.5 ppm. The tensile strength and elongation at break, and changes in tensile strength (Δδ), elongation at break (Δε), and carbonyl index (ΔCI) of POM and the nanocomposites after UV and ozone testing are listed in Table 4. When compared with the data in Table 3, it can be seen that after UV and ozone testing, the tensile strength of POM and the nanocomposites increased and their elongation at break decreased. These results indicate that POM and the nanocomposites degrade during the UV and ozone tests.
| Sample | After UV test | After ozone test | ||||||||
|---|---|---|---|---|---|---|---|---|---|---|
| δ (MPa) | Δδ (%) | ε (%) | Δε (%) | ΔCI | δ (MPa) | Δδ (%) | ε (%) | Δε (%) | ΔCI | |
| POM | 68.91 | +16.30 | 12.06 | −16.94 | 0.47 | 64.64 | +9.10 | 8.63 | −40.56 | 0.59 |
| 0PELA | 64.86 | +5.69 | 7.25 | −50.81 | 0.29 | 61.10 | −0.44 | 7.01 | −52.44 | 0.35 |
| 3PELA | 66.58 | +2.32 | 7.51 | −51.45 | 0.02 | 65.83 | +1.17 | 9.32 | −39.75 | 0.54 |
| 5PELA | 68.48 | +11.42 | 8.40 | −35.03 | 0.22 | 62.70 | +2.02 | 8.67 | −32.95 | 1.12 |
It is noted that the UV and ozone durability of POM-based nanocomposites is scarcely reported in the literature. Therefore, the following is proposed as a rational for the results obtained for the POM/PELA/NS nanocomposites. Firstly, POM is a semi-crystal polymer, whose structure consists of polymer chains arranged in a continuous fashion. The sources of UV and ozone during the tests can instigate further cross-linking of the POM chains, leading to the re-arrangement of the crystal structure of POM. This leads to an increase in the tensile strength of POM and the nanocomposites. Secondly, the degradation of polymers typically occurs in the amorphous region of the polymer and proceeds to the crystal region of the polymer. During the UV and ozone tests, the increase in crystal degree also leads to an increase in the tensile strength and decrease in the elongation at break of POM and the nanocomposites. Thirdly, the introduction of NS and PELA into POM macromolecules can limit the extent of cross-linking of POM, and as a result, the tensile strength of the nanocomposites varied minimally relative to that of POM, whereas the elongation at break of the nanocomposites reduced considerably compared with that of POM. Finally, the OH groups in NS and C![[double bond, length as m-dash]](https://www.rsc.org/images/entities/char_e001.gif) O groups in PELA are prone to attack by UV irradiation and ozone to form free radicals, which can catalyze the oxygen-induced photodegradation of POM macromolecules. Thus, the elongation at break of the nanocomposites was reduced compared with that of POM.
O groups in PELA are prone to attack by UV irradiation and ozone to form free radicals, which can catalyze the oxygen-induced photodegradation of POM macromolecules. Thus, the elongation at break of the nanocomposites was reduced compared with that of POM.
From the data in Table 4, it can be seen that the degradation of POM and the nanocomposites was influenced by UV irradiation to a greater extent than by ozone, as indicated from the larger variations noted for Δδ and Δε after UV testing. This may be due to the stronger cross-linking ability that the POM macromolecules and the nanocomposites possess in the presence of UV irradiation, which leads to higher tensile strength.
The degradation of POM and the nanocomposites after the UV and ozone tests was also characterized by CI, which was calculated from the ratio of the IR absorption band at 1755 cm−1 (A1755) (stretching vibration of C![[double bond, length as m-dash]](https://www.rsc.org/images/entities/char_e001.gif) O group) and the IR absorption band at 1467 cm−1 (A1467) (bending vibration of the C–H group).35,37 The ΔCI of POM and the nanocomposites are displayed in Table 4. The increase in ΔCI observed for POM and the nanocomposites indicated that after the UV and ozone tests, the C
O group) and the IR absorption band at 1467 cm−1 (A1467) (bending vibration of the C–H group).35,37 The ΔCI of POM and the nanocomposites are displayed in Table 4. The increase in ΔCI observed for POM and the nanocomposites indicated that after the UV and ozone tests, the C![[double bond, length as m-dash]](https://www.rsc.org/images/entities/char_e001.gif) O content in the samples was higher. This result confirmed the degradation of POM and the nanocomposites by oxy in natural air and UV irradiation to form low molecular weight substances containing C
O content in the samples was higher. This result confirmed the degradation of POM and the nanocomposites by oxy in natural air and UV irradiation to form low molecular weight substances containing C![[double bond, length as m-dash]](https://www.rsc.org/images/entities/char_e001.gif) O groups.12,37
O groups.12,37
Thermal stability of POM/PELA/NS nanocomposites
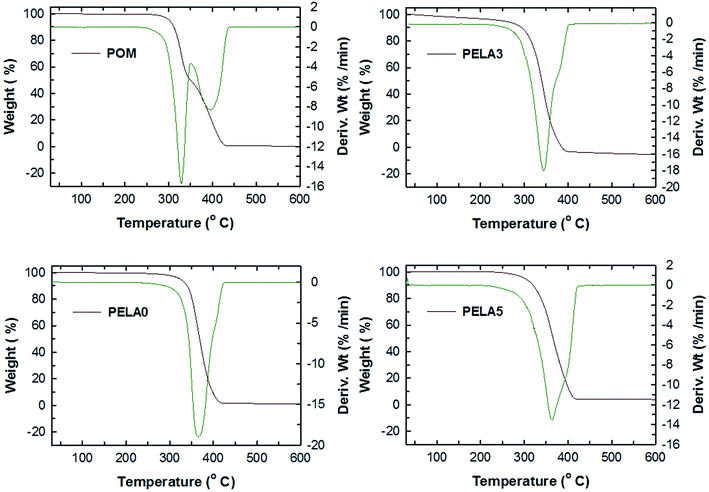
Thermal stability of POM/PELA/NS nanocomposites was evaluated by TGA method. The TG and DTG diagrams of POM and the nanocomposites are shown in Fig. 11. POM was degraded through two stages with the weight loss of the first stage and second stage is 49.6% and 49.7%, respectively. The total weight loss of POM is 99.3% at 420 °C. The maximum degradation temperatures (Tmax) of POM are 328.6 °C and 396.4 °C. The first Tmax is corresponding to the first degradation of the terminal groups of POM macromolecules at high temperature and shearing force, thereby releasing formaldehyde and generating more terminal hydroxyl groups. The second stage in the range of 350–420 °C is attributed to the degradation of carbon chains in POM macromolecules to form a large amount of unstable groups and cationic centers.30,38 When NS and PELA were added to POM, the nanocomposites were degraded by only one stage corresponding to one Tmax. For example, the Tmax of PELA0, PELA3, and PELA5 is 365.7 °C, 344.0 °C, and 363.4 °C, respectively. The existence of only one Tmax can be due to NS serves as a barrier preventing the heat attack to the structure of the nanocomposites, leading to the slow degradation of POM macromolecules. The addition of PELA into POM/NS nanocomposite slight decreases thermal stability of POM/NS nanocomposite as compared with PELA0 sample. In general, the introduction of PELA and NS into POM matrix can the slow down the degradation process as well as improve the chemical stability of the nanocomposites in heating because the increase in their onset temperature (Ton) and Tmax (Ton values of POM, PELA0, PELA3 and PELA5 are 301, 324, 316, and 330 °C).Conclusions
POM/NS/PELA nanocomposites with varying contents of PELA were prepared by a melt mixing method, and the effect of the PELA content on the mechanical properties and morphology of the nanocomposites was examined. The storage modulus (G′), sheer stress of the POM/NS nanocomposites with or without PELA was higher than that of neat POM. The tan![[thin space (1/6-em)]](https://www.rsc.org/images/entities/char_2009.gif) δ of the nanocomposites was below 1, indicative that their loss modulus (G′′) was smaller than their G′ value. Under an applied force, the extent of deformation of the POM/NS/PELA nanocomposites was lower and the original shape of the nanocomposites was easily restored at high temperatures. The presence of both NS and PELA enhanced the thermo-stability and tensile properties of POM. PELA promoted the regular dispersion of NS in POM matrix. An NS content and a PELA content of 1.5 and 3 wt%, respectively, in the POM/NS/PELA nanocomposites were the most appropriate conditions for improving the mechanical properties of POM.
δ of the nanocomposites was below 1, indicative that their loss modulus (G′′) was smaller than their G′ value. Under an applied force, the extent of deformation of the POM/NS/PELA nanocomposites was lower and the original shape of the nanocomposites was easily restored at high temperatures. The presence of both NS and PELA enhanced the thermo-stability and tensile properties of POM. PELA promoted the regular dispersion of NS in POM matrix. An NS content and a PELA content of 1.5 and 3 wt%, respectively, in the POM/NS/PELA nanocomposites were the most appropriate conditions for improving the mechanical properties of POM.
The UV and ozone testing results confirmed the degradation of POM and the nanocomposites by UV irradiation and ozone into low molecular weight substances containing C![[double bond, length as m-dash]](https://www.rsc.org/images/entities/char_e001.gif) O groups. However, during the oxygen-induced photodegradation process, cross-linking of the POM chains occurred simultaneously with chain scission. Therefore, the tensile strength of POM and the nanocomposites increased after the UV and ozone tests. The introduction of PELA and NS into POM matrix can improve thermal stability of the nanocomposites in heating. These results have implications for evaluating the application of POM-based nanocomposites in automotive and electronic fields.
O groups. However, during the oxygen-induced photodegradation process, cross-linking of the POM chains occurred simultaneously with chain scission. Therefore, the tensile strength of POM and the nanocomposites increased after the UV and ozone tests. The introduction of PELA and NS into POM matrix can improve thermal stability of the nanocomposites in heating. These results have implications for evaluating the application of POM-based nanocomposites in automotive and electronic fields.
Conflicts of interest
There are no conflicts to declare.Acknowledgements
This work was financially supported by the Vietnam Academy of Science and Technology for high-level researcher 2018 (code: NVCC 13.03/18-18).References
- K. Matsuzaki, M. Maeda, M. Kondo, H. Morishita, M. Hamada, T. Yamaguchi, K. Neki and J. Masamoto, J. Polym. Sci., Part A: Polym. Chem., 1997, 35, 2479 CrossRef CAS.
- S. Lüftl, V. M. Archodoulaki, T. Koch and S. Seidler, J. Vinyl Addit. Technol., 2008, 14, 21 CrossRef.
- A. Grigalovica, M. Bartule, J. Zicans, R. M. Meri, H. Hans-Peter and C. Berger, Proc. Est. Acad. Sci., 2012, 61(3), 200 CrossRef CAS.
- B. Fayolle, J. Verdu, M. Bastard and D. Piccoz, J. Appl. Polym. Sci., 2008, 107, 1783 CrossRef CAS.
- G. Liping, M. X. Xiang, Z. Yudong and Z. Zhijun, Polym. Compos., 2014, 35(1), 127 CrossRef.
- M. X. Xiang, P. G. Li, D. Z. Yu and J. Z. Zhi, Adv. Mater. Res., 2012, 535–537, 103 Search PubMed.
- Y. Zeng, Z. Ying, J. Du and H. M. Cheng, J. Phys. Chem. C, 2007, 111, 13945 CrossRef CAS.
- F. Wang, J. K. Wu, H. S. Xia and Q. Wang, Plast., Rubber Compos., 2007, 36, 297 CrossRef CAS.
- Y. Samy, A. M. Visco, G. Galtieri and J. Njuguna, JOM, 2016, 68(1), 288 CrossRef.
- K. Thontree, K. Yasushi, U. Toshikazu, N. Daigo, T. Wandee, P. Yupin and C. Suwabun, Polymer, 2008, 49, 1676 CrossRef.
- A. J. Jose and M. Alagar, Polym. Compos., 2011, 32, 1315 CrossRef CAS.
- D. Alexis, L. Herve, B. François, T. Arnaud and L. P. Loïc, Polym. Degrad. Stab., 2016, 131, 122 CrossRef.
- P. K. Karahaliou, A. P. Kerasidou, S. N. Georga, G. C. Psarras, C. A. Krontiras and J. Karger-Kocsis, Polymers, 2014, 55, 6819 CrossRef CAS.
- G. N. Tomara, P. K. Karahaliou, G. C. Psarras, S. N. Georga, C. A. Krontiras and S. Siengchins, Eur. Polym. J., 2017, 95, 304 CrossRef CAS.
- Z. Z. Afshin and S. N. Karim, Nanomater. Nanotechnol., 2014, 4(17), 1 Search PubMed.
- X. Zhao and L. Ye, J. Appl. Polym. Sci., 2009, 111(2), 759 CAS.
- S. Lan-Hui, Y. Zhen-Guo and L. Xiao-Hui, Wear, 2008, 264, 693 CrossRef.
- W. Sirirat, T. Supakanok, P. Akaraphol and E. Chaturong, Polym. Test., 2008, 27, 971 CrossRef.
- P. Kinga, Thermochim. Acta, 2015, 600, 7 CrossRef.
- P. Kinga, K. Klaudia and M. M. Tomasz, Thermochim. Acta, 2016, 633, 98 CrossRef.
- S. Siengchin, J. Thermoplast. Compos. Mater., 2012, 26(7), 863 CrossRef.
- A. Durmus, A. Kasgoz, N. Ercan, D. Akin and S. Sanli, Polymer, 2012, 53, 5347 CrossRef CAS.
- M. Sanchez-Soto, S. Illescas, H. Milliman, D. A. Schiraldi and A. Arostegui, Macromol. Mater. Eng., 2010, 295, 846 CrossRef CAS.
- Y. F. Fu, K. Hu, J. Li, Z. H. Y. Sun, F. Q. Zhang and D. M. Chen, Mech. Compos. Mater., 2012, 47(6), 659 CrossRef CAS.
- G. Agnese, B. Madara, Z. Janis, M. M. Remo, H. Hans-Peter and B. Christian, Proc. Est. Acad. Sci., 2012, 61(3), 200 CrossRef.
- R. K. Donato, M. Perchacz, S. Ponyrko, K. Z. Donato, H. S. Schrekker, H. Beneš and L. Matějka, RSC Adv., 2015, 5, 91330 RSC.
- T. Hoang, T. A. Truc, D. T. M. Thanh, N. T. Chinh, D. Q. Tham, N. T. T. Trang, N. V. Giang and V. D. Lam, J. Compos. Mater., 2014, 48, 505 CrossRef CAS.
- X. Lijian, S. Jianhui, W. Hui and K. Ze, J. Appl. Polym. Sci., 2019, 136, 47449 CrossRef.
- D. Olmos, G. González-Gaitano and J. González-Benito, RSC Adv., 2015, 5, 34979 RSC.
- T. T. Mai, N. T. Chinh, B. Rajesh B, N. T. T. Trang, V. V. Thang, D. T. T. Le, D. Q. Minh and T. Hoang, J. Nanosci. Nanotechnol., 2018, 18, 4963 CrossRef CAS PubMed.
- N. T. Chinh, T. Hoang and T. T. Mai, Vietnam J Sci Technol., 2018, 56(3B), 159 CrossRef.
- S. Hidematsu, G. Janusz and W. Bernhard, Br. Polym. J., 1985, 17(1), 1 Search PubMed.
- S. Siengchin, G. C. Karger-Kocsis, J. Psarras and R. Thomann, J. Appl. Polym. Sci., 2008, 110, 1613 CrossRef CAS.
- K. L. Lam, A. Abu Bakar, Z. A. Mohd Ishak and J. Karger-Kocsis, KGK, Kautsch. Gummi Kunstst., 2004, 57, 570 CAS.
- D. V. Cong, N. V. Giang, N. T. T. Trang, T. H. Trung, N. T. Chinh, L. Geoffrey and T. Hoang, J. Nanosci. Nanotechnol., 2016, 16(9), 9612 CrossRef CAS.
- T. Hoang, N. T. Chinh, D. Q. Tham, D. T. M. Thanh, T. A. Truc, N. T. T. Trang, N. V. Giang and V. D. Lam, KGK, Kautsch. Gummi Kunstst., 2012, 6, 51 Search PubMed.
- L. Zhongyang, J. Jing, C. Shuangjun and Z. Jun, Polym. Degrad. Stab., 2011, 96, 43 CrossRef.
- X. Xiangmin, G. Liping, Z. Yudong and Z. Zhijun, Adv. Mater. Res., 2012, 535, 103 Search PubMed.
| This journal is © The Royal Society of Chemistry 2020 |

