 Open Access Article
Creative Commons Attribution 3.0 Unported Licence
Self-assembly of amphiphilic polyoxometalates for the preparation of mesoporous polyoxometalate-titania catalysts†
Andi
Di
a,
Julien
Schmitt
 ab,
Marcelo Alves
da Silva
 a,
Kazi M. Zakir
Hossain
a,
Najet
Mahmoudi
a,
Kazi M. Zakir
Hossain
a,
Najet
Mahmoudi
 c,
R. John
Errington
 d and
Karen J.
Edler
 *a
*a
aDepartment of Chemistry, University of Bath, Claverton Down, Bath, BA2 7AY, UK. E-mail: k.edler@bath.ac.uk
bLSFC Laboratoire de Synthèse et Fonctionnalisation des Céramiques, UMR 3080 CNRS/Saint-Gobain CREE, Saint-Gobain Research Provence, 550 avenue Alphonse Jauffret, Cavaillon, France
cISIS Neutron and Muon Source, Science and Technology Facilities Council, Rutherford Appleton Laboratory, Didcot OX11 0QX, UK
dChemistry, School of Natural and Environmental Sciences, Newcastle University, Newcastle upon Tyne, NE1 7RU, UK
First published on 27th October 2020
Abstract
Amphiphilic polyoxometalate (POM) surfactants were prepared by covalently grafting double hydrophobic tails with chain lengths C12H25, C14H29, C16H33 or C18H37 onto the lacunary Wells–Dawson {P2W17O61} headgroup. The critical micelle concentrations (CMCs) of these novel surfactants in aqueous solutions were determined by conductivity, and micelle formation was studied by small angle neutron scattering (SANS). Surprisingly, the amphiphiles with longer hydrophobic tails tend to form less elongated and more globular micelles in water. The self-assembled amphiphilic polyoxometalates were used as templates in the hydrothermal synthesis of mesoporous TiO2 containing dispersed, immobilised {P2W17O61} units, which showed enhanced activity for the photodegradation of rhodamine B (RhB). The catalyst was recycled eight times with no loss of efficiency, demonstrating the stability of the hybrid structure. The amphiphilic polyoxometalates, therefore have excellent potential for the synthesis of various types of catalytically active porous materials.
Introduction
Polyoxometalates (POMs) are a class of unique nanoscale transition metal oxide clusters, formed by earth-abundant metals in their highest oxidation states.1,2 Due to their remarkable redox and photochemical properties, they are often used as catalysts for selective reduction3,4 and as inexpensive photocatalysts for the green removal of organic pollutants or transition metals from water.5,6 Similar to semiconductor photocatalysts, which experience electron transfer from the valence band (VB) to the conduction band (CB) under ultraviolet irradiation, POMs undergo electron transfer from the oxygen-based highest occupied molecular orbitals (HOMO) to the lowest unoccupied molecular orbitals (LUMO) on the addenda atoms under UV irradiation,7,8 resulting in a colour change to blue. The charge-transfer excited state POM (POM*) has a highly oxidizing power that is strong enough to oxidise organic species or to generate ˙OH radicals.9,10The incorporation of POMs onto conventional supports, such as SiO2,11,12 TiO2,13,14 Al2O3![[thin space (1/6-em)]](https://www.rsc.org/images/entities/char_2009.gif) 11 or metal–organic frameworks,15 through direct dispersion has been investigated to increase the application of POMs for catalysis. However, it has been reported that POMs anchored onto the surface of such supports are not stable since the POMs may be leached out by water or alcohol.16 Studies have therefore been undertaken to modify the inner walls of the support materials to improve POM adhesion: e.g. by grafting organic moieties such as aminosilane or imidazole, to provide strong anchoring of POMs and prevent POM leaching when applied as a catalyst in polar solvent media.16–19 However, this method limits the applications of these materials due to the low thermal stability of the organic anchoring groups at high temperatures.20 Alternatively, researchers have been exploring the encapsulation of POMs into aggregates formed by surfactants or polymers,21–23 with the aim to fabricate polyoxometalate-decorated mesoporous materials via a one-pot synthesis.
11 or metal–organic frameworks,15 through direct dispersion has been investigated to increase the application of POMs for catalysis. However, it has been reported that POMs anchored onto the surface of such supports are not stable since the POMs may be leached out by water or alcohol.16 Studies have therefore been undertaken to modify the inner walls of the support materials to improve POM adhesion: e.g. by grafting organic moieties such as aminosilane or imidazole, to provide strong anchoring of POMs and prevent POM leaching when applied as a catalyst in polar solvent media.16–19 However, this method limits the applications of these materials due to the low thermal stability of the organic anchoring groups at high temperatures.20 Alternatively, researchers have been exploring the encapsulation of POMs into aggregates formed by surfactants or polymers,21–23 with the aim to fabricate polyoxometalate-decorated mesoporous materials via a one-pot synthesis.
Amphiphilic surfactants are of great interest for their applications as templates in the formation of mesoporous materials, which typically form from mixed aqueous solutions of surfactants and inorganic precursors.24–26 Porosity is generated in the inorganic materials after the removal of the organic components from the surfactant template. These mesoporous materials, due to their high specific surface areas and uniform mesopore size, are particularly interesting as supports for catalysts.27,28
To incorporate POMs into the matrix of inorganic mesostructured materials or synthesise porous hybrid materials where the POMs are accessible, a POM-based amphiphile that can be used as a templating agent is key. Self-assembly is an efficient method to synthesise materials with high surface areas and open networks, and hence the use of POM amphiphiles has the potential to organise accessible polyoxometalates directly and uniformly within the supports. There have been previous reports on the synthesis of surfactants with POMs as headgroups through covalent bonding,29–33 but to the best of our knowledge, there have been no detailed studies of the application of POM-based amphiphiles to template mesoporous POM-decorated inorganic materials.
Among various oxide semiconductor photocatalyst materials, titania is recognised as the most suitable material for widespread environmental applications due to its low cost, strong oxidizing ability and photostability.34,35 Its performance is often reinforced through the incorporation of electron-transporting materials, such as graphene oxide36 or graphene,37 within the titania matrix. Also, there have been attempts to load polyoxometalates onto TiO2 through a layer by layer strategy, physical mixing or electrostatic bonding.38–40 These studies have demonstrated synergistic effects between TiO2 and polyoxometalates.
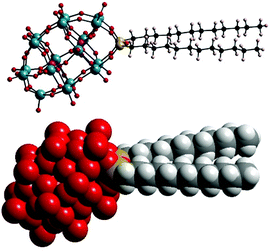
In this paper, we report the characterisation of micellar structures formed by amphiphilic [P2W17O61{OSi2(CnH2n+1)2}]6− (Wells–Dawson type POMs with double hydrocarbon tails CnH2n+1, denoted as POM-2Cn, with molecular structure illustrated in Fig. 1), the influence of the tail length of the amphiphiles on the micelle shape and degree of counterion ionisation, using conductivity, small angle neutron scattering (SANS), zeta-potential and dynamic light scattering (DLS).
The Wells–Dawson anion [α-P2W18O62]6− can readily accept multiple electrons without any change in the cluster geometry, and both [α-P2W18O62]6− and its lacunary derivative [P2W17O61]10− are often used as co-catalysts for catalytic oxidation and photocatalytic reduction.41,42 The siloxane derivatives [P2W17O61{OSi2(CnH2n+1)2}]6− are amphiphiles with redox-active metal oxide headgroups and form micelles in water. Therefore, these micelles were used directly as templating agents for the hydrothermal synthesis of POM-TiO2 mesoporous materials, without the addition of any other co-templating agents. The resulting POM-TiO2 hybrid materials have relatively high surface areas and better rhodamine B (RhB) photodegradation properties compared to a porous TiO2 material prepared using a commercial anionic surfactant template.
Experimental
Materials
Na2WO4·2H2O (purity >99%), phosphoric acid (85 wt% in water solution), NH4Cl (purity >99.5%), KCl (laboratory reagent grade), dodecyltrichlorosilane (C12H25SiCl3, purity >95%), octadecyltrichlorosilane (C18H37SiCl3, purity >90%), KHCO3 (purity >99.7%), sodium dodecyl sulfate (SDS, purity >99%) and D2O (99.9 atom% D) were purchased from Sigma Aldrich. Tetradecyltrichlorosilane (C14H29SiCl3, purity 98%) and hexadecyltrichlorosilane (C16H33SiCl3, purity 98%) were purchased from Fluorochem. All chemicals were used without further purification. 70 mol% D2O in H2O was prepared using ultrapure water (18.2 MΩ cm, from an ELGA PURELAB flex water purification system).Preparation of POM-2Cn
K6[α-P2W18O62]·14H2O was prepared as previously described by Droege.43 Lacunary K10[α-P2W17O61]·19H2O was synthesised according to the method of Finke et al.,44 and then used to prepare POM-2Cn. A typical reaction is as follows: K10[α-P2W17O61]·19H2O (1.040 mmol) was dispersed in anhydrous MeCN (180 ml) and stirred under nitrogen for 4 hours. Trichlorosilane, RSiCl3 (R = C12H25, C14H29, C16H33 or C18H37, 4.94 mmol) was dissolved in anhydrous dichloromethane (60 ml), then added dropwise to POM suspension with stirring. The obtained mixture was stirred for 12 hours to finish the reaction.The mixture produced was filtered and then dried using a rotary-evaporator. The powder obtained was washed four times with anhydrous diethyl ether (50 ml) to remove the excess of trichlorosilane, and was vacuum-dried to give the final product K6[P2W17O61{OSi2(CnH2n+1)2}], denoted as POM-2Cn, with n = 12, 14, 16 or 18.
Synthesis of POM-TiO2
The nPOM-TiO2 hybrid materials were prepared by mixing an aqueous HCl solution (pH = 2) of POM-2Cn (9.17 mM, 9 ml) and an aqueous HCl solution (pH = 2) of TiOSO4 (0.672 M, 6 ml) to give final POM-2Cn and TiOSO4 concentrations of 5.5 mM and 0.269 M respectively. The reaction was performed at 150 °C in an autoclave with a ramping rate of 5 °C min−1, and then was held at 150 °C for 20 hours. The obtained powder was filtered and washed with water to remove any surfactant excess prior to freeze-drying. The freeze-dried powder was calcined at 500 °C in air for 5 hours to remove the hydrocarbon tails to generate pores. The effect of temperature on Dawson structured POMs has been extensively studied previously in the literature.45–47 According to these studies, the Wells–Dawson conformation of the POM is maintained up to 873 K, which is well above the calcination temperature of our materials. The calcined products were porous TiO2 materials containing functionalised POM units, and were labelled nPOM-TiO2 catalyst with n = 12, 16 or 18 depending on the tail length of the POM-2Cn used in the synthesis. For comparison, a sample of TiO2 templated by sodium dodecyl sulfate (SDS) was synthesised according to the procedure already described in the literature which used a much higher surfactant concentration (0.26 M SDS) than that used for POM-2Cn templating.48 To study the effect of POM-2Cn surfactant concentration on the material formed, a second 16POM-TiO2 hybrid material was prepared at a higher concentration of POM-2C16 (22.0 mM) using the same method described above; the resulting material is labelled as 16POM-TiO2-2.The synthesised materials were characterised using transmission electron microscopy (TEM), nitrogen sorption, powder X-ray diffraction (PXRD) and energy dispersive X-ray (EDX) elemental mapping.
Photocatalytic activity test
0.015 g nPOM-TiO2 or SDS templated TiO2 catalyst was added to 30 ml of an aqueous mixture of RhB (15 mg L−1; 0.031 mM) and H2O2 (1.5 mM). The mixture was exposed to solar light (energy equal to one sun) under stirring for 80 min. During this time 2 mL aliquots of solution were removed from the system every 20 min and centrifuged. UV-vis absorption measurements were conducted on the clear solutions obtained to determine the concentration of rhodamine B (RhB) according to the major absorption intensity at 553 nm, for each degradation stage. The measured solution was added back to the system at every stage to maintain the total volume. A blank experiment was carried out as follows: a 30 ml of an aqueous mixture of RhB (15 mg L−1; 0.031 mM) and H2O2 (1.5 mM) was illuminated by solar light without adding any photocatalyst. The change of RhB concentration with illumination time was recorded using the same method as above.A control experiment was performed by using 0.20 mg POM-2C12 (4 × 10⁻⁵ mmol, equivalent to the moles of POM in 0.015 grams of 12POM-TiO2 material estimated by using the EDX elemental mapping result) as the catalyst. A bathochromic shift and obvious drop in the intensity of the main absorption peak was observed in the UV-vis spectrum when POM-2C12 was added to the RhB starting solution in the dark (see discussion below). In this case therefore, the concentration of RhB during solar light illumination was determined using the absorption intensity at 565 nm, the position of the main RhB absorption peak observed after the addition of POM-2C12.
Ag+ reduction
Polyoxometalates can be reduced by organic electron donors (e.g., alcohols) upon exposure to visible and ultraviolet light.49 The nPOM-TiO2 hybrid material (0.02 g) was dispersed in isopropanol under stirring and illuminated by solar light for about 20 min. The colour of the dispersion changed from white to blue. An aqueous AgNO3 solution (0.05 M) was added dropwise into the dispersion after removal from light, causing the blue-coloured dispersion to turn to brown abruptly. The brown powder was then filtered, washed with water and air-dried for TEM and EDX elemental mapping analysis.Small angle neutron scattering
The raw spectra were corrected for the background from the solvent, sample cell and other sources using standard workflows in the Mantid software package.51 Scattering data were normalised against the scattering from a partially-deuterated polystyrene blend of known molecular weight to put the SANS data on an absolute scale,52 so I(q) equals the differential scattering cross section d∑/dΩ(q). The output data was absolute scattered intensity, I(q) in cm−1, versus the momentum transfer, q in Å−1.
| I(q) = A(ΔSLD)2P(q)S(q,ϕ) | (1) |
For a dilute suspension, the interactions between micelles, S(q,ϕ), can be neglected, so I(q) mainly depends on the shape and size of the particles:
| I(q) = A(ΔSLD)2P(q) | (2) |
Due to the large SLD difference between the POM-2Cn headgroup (4.42 × 10⁻⁶ Å−2) and tails (−0.38 × 10⁻⁶ Å−2), the SANS patterns were fitted using core–shell models. For some of the scattering data, the core–shell sphere model53 gave satisfactory fit results. However, in some circumstances, it gave an unusually large radius, which was not in accordance with the tail length of a surfactant monomer, so a core–shell ellipsoid model54,55 was favoured and applied to get better fit results. In the modelling, the core of the micelles was assumed to only contain the hydrocarbon tails, while the shell was formed from the headgroups, a partial contribution from the tails and water. Through fitting the form factor P(q), the minimum radius of the core (Rmin), shell thickness (t), core ellipticity (ε) and shell neutron scattering length density (SLD) were obtained.
In the semi-dilute regime, where micelles are interacting, the structure factor also has to be taken into account. Since the POM-2Cn micelles are charged due to the ionisable headgroups, they experience a Coulomb repulsion modelled using the Hayter Penfold Rescaled Mean Spherical Approximation (RMSA)56 which gives the volume fraction of charged particles interacting (ϕ) and the number of charges per micelle z (number of electrons). This model depends on the Debye screening length of interactions. This Debye length can be calculated knowing the temperature (25 °C) and the relative permittivity of the medium (72.08 for D2O, 72.2 for 70 mol% D2O).57
Scattering patterns from samples at the same concentration but in two different solvents (D2O and 70 mol% D2O) were fitted simultaneously using SasView (version 4.2.1) in order to better constrain the fits using contrast variation. Calculated neutron SLDs of the hydrocarbon tails, the POM headgroup and the solvents used for fitting are listed in ESI Table 1.†
Other Techniques
The electrical conductivities of the surfactant aqueous solutions were measured using a METTLER TOLEDO conductivity meter. NMR spectroscopic measurements were carried out using a 500 MHz Bruker Avance II+ spectrometer. Typical samples were made from POM-2Cn surfactants dissolved in D2O. The 31P NMR was measured with a relaxation time of 20 seconds. IR spectra were measured using a Bruker IR spectrometer at room temperature in a dry box. TGA was applied to measure the change of sample weight as a function of temperature. An alumina crucible with about 100 mg of sample was put into a furnace, which was heated up in air at a constant heating rate of 1 °C min−1, while a sensitive balance recorded sample weight loss. The results are displayed as the loss of mass percentage against temperature in °C. Analysis of carbon, hydrogen and nitrogen (CHN analysis) was carried out with a Carlo Erba 1112 elemental analyser at MEDAC Ltd Brunel Science Centre, Surrey, TW20 0JZ, UK. POM-2Cn aqueous solutions at 5.5 mM were measured at room temperature using dynamic light scattering (DLS) in a Malvern Zetasizer Nano ZSP (Malvern, UK). All samples were filtered through a 0.45 μm filter (Millex-HA) to remove any dust before the measurements. Samples were measured at a scattering angle of 173° and a wavelength of 632.8 nm for 120 s, repeated 5 times. The size distribution, weighted in volume, was extracted using the CONTIN method. The zeta-potential of the micelles was also studied, at the same concentration, using the same instrument. Nitrogen sorption measurements were carried out at liquid nitrogen temperature (77.36 K) using a BELSORP instrument (BELSORP-mini Inc. Japan). The samples were degassed under vacuum at 523 K for 1000 min prior to the measurements. Surface areas were calculated using the Brunauer–Emmett–Teller (BET) equation. PXRD measurements were performed on a Stoe STADI P high-resolution system equipped with a DECTRIS Double MYTHEN 1K strip detector, and employing Cu-Kα1 radiation (λ = 1.54060 × 10⁻¹⁰ m). The samples were measured in the range of 10° < 2θ < 70° at 2° per minute. The morphologies of the obtained materials were observed by TEM using a JEOL JEM-2100Plus instrument with an operating voltage at 200 kV maximum. An Oxford Instruments large area EDX detector, associated with the TEM, and Aztec analysis software were used for high-resolution elemental mapping analysis. Prepared POM-loaded mesoporous TiO2 materials were characterised using an Anton Paar SAXSess instrument with a PANalytical PW3830 X-ray generator which gave a q range between 0.08 Å−1 and 2.7 Å−1. The line X-ray source used was a Cu Kα X-ray tube at 40 kV and 50 mA. X-rays were detected by a reusable Europium excitation based image plate (size: 66 × 200 mm) with a 42.3 μm2 pixel size. The image plate was subsequently read by a PerkinElmer cyclone reader using OptiQuant software. SAXS profiles were generated by using the SAXSquant program.Kinetics of photocatalytic degradation
UV-vis absorption was used to follow dye degradation performed on a PerkinElmer Lambda 750S UV-vis spectrometer. The rate of photodegradation of rhodamine B (RhB) in the presence of photocatalysts can be calculated from a fit to the experimental data. The Langmuir–Hinshelwood model can be used to describe the kinetics of the photodegradation, and the model is further simplified if possible.58 Here, the degradation kinetics were approximated as pseudo-first-order kinetics with respect to the concentration of RhB (C):| −dC/dt = kobsC | (3) |
| ln(Ct/C0) = −kobst | (4) |
Results and discussion
Characterisation of K6[α-P2W18O62]·14H2O, K10[α2-P2W17O61]·19H2O and POM-2Cn
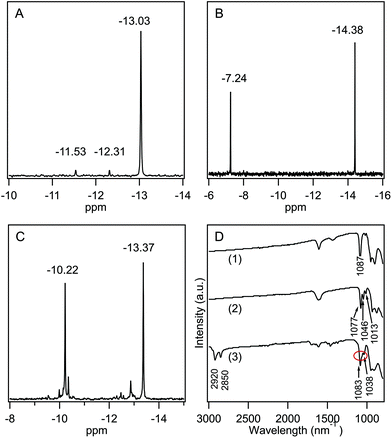
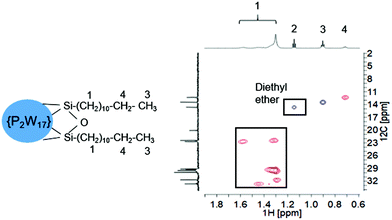
POM-2Cn surfactants with structure illustrated in Fig. 1 were prepared from K6[α-P2W18O62]·14H2O, via the lacunary derivative K10[α2-P2W17O61]·19H2O using established methods.44Starting materials and POM-2Cn (n = 12, 14, 16 and 18) were characterised by 31P NMR (Fig. 2A–C and ESI Fig. 1†) and IR spectroscopy (Fig. 2D and ESI Fig. 2†). The 31P NMR spectrum of K6[α-P2W18O62]·14H2O (Fig. 2A) shows the characteristic peak at −13.03 ppm, in addition to two small peaks at around −11.53 and −12.31 ppm, due to the K6[β-P2W18O62]·14H2O isomer. After the modifications, two 31P NMR peaks were observed due to the non-equivalent phosphorus atoms both in the K10[α2-P2W17O61]·19H2O spectrum (−7.24 and −14.38 ppm, see Fig. 2B) and in the K6[P2W17O61{OSi2(CnH2n+1)2}] (Fig. 2C for POM-2C12 and ESI Fig. 1† for POM-2C14, POM-2C16 and POM-2C18). For the POM-2C12 surfactant, C–H correlated NMR further suggests the successful grafting of the C12H25 hydrocarbon tails as shown in Fig. 3. The peak labelled 2 is due to diethyl ether impurities. Peaks labelled 1, 3 and 4 are correlated to the double hydrocarbon tails as illustrated in detail in Fig. 3. Carbon NMR spectra of POM-2Cn with tail lengths C14H28, C16H33 and C18H37 are listed in ESI Fig. 3† and also evidence the presence of the hydrocarbon chain.
In the IR spectra (Fig. 2D), only one type of ν(P–O) was observed at 1087 cm−1 for symmetric K6[α-P2W18O62]·14H2O.59,60 For K10[α2-P2W17O61]·19H2O, the bands of ν(P–O) vibrations were observed at 1013, 1046 and 1077 cm−1, similar to those reported in the literature.61 After the attachment of the hydrocarbon tails to form the POM-2C12 surfactant, the three ν(P–O) vibration peaks were retained with the peak at 1046 cm−1 overlapping with the peak at 1083 cm−1. Peaks at 2920 and 2850 cm−1 correspond to the ν(C–H) vibration, indicating the presence of both {P2W17O61} and hydrocarbon chains in the final product. IR spectra of POM-2Cn (n = 14, 16 and 18) were obtained and are found to be similar to that of POM-2C12, suggesting the presence of both polyoxometalate and hydrocarbon chain (see ESI Fig. 2†).
UV-vis absorbance spectra (ESI Fig. 4†), showed a bathochromic shift in the absorption edge upon attachment of the two hydrocarbon chains, so that the POM-2C12 derivatives absorb light over a wider wavelength range compared to the lacunary K10[α2-P2W17O61]·19H2O. TGA on the POM-2Cn materials (ESI Fig. 5†), showed a mass loss of 6.73%, 7.00%, 7.13% and 10.05% corresponding to the tail weight percentage in POM-2C12, POM-2C14, POM-2C16 and POM-2C18 (calculated mass loss is 7.0%, 8.1%, 9.2% and 10.2% respectively). Additional CHN analyses suggest a carbon weight percentage of 7.11% and 7.84% and a hydrogen weight percentage of 1.56% and 1.66% in POM-2C14 (C: 6.92%, H: 1.20%) and POM-2C16 (C: 7.82%, H: 1.34%) respectively. The carbon weight percentages from CHN analyses give similar results to the calculated values. The deviation in H weight percentage between the theoretical and the experimental values may be attributed to moisture in the materials. These results confirm the successful synthesis and structural integrity of the POM-2Cn.
Critical micelle concentrations
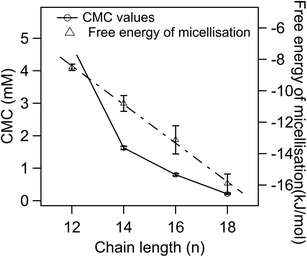
ESI Fig. 6A–D† show plots of the electrical conductivity vs. the concentration of POM-2Cn in water, and CMC values were determined by the intersections of the two straight lines. The CMCs of the POM-2Cn surfactants versus hydrophobic chain length are plotted in Fig. 4, giving a trend similar to that observed for di-alkyl sulfosuccinate surfactants (CMCs given in ESI Table 2†),62,63 alkyl trimethylammonium bromides (abbreviated as CnTAB, CMC values given in ESI Table 3†)64,65 and sodium alkyl sulfates (CMC values in ESI Table 4†),66–70 where a surfactant with longer hydrophobic tail/tails has a lower CMC compared to the one with the same headgroup but shorter hydrophobic part.Degree of micelle ionisation and free energy of micellisation
The percentage of bound counterions in relation to the number of surfactant ions in the micelles is the fraction of micellar charge neutralized, β, defined as counterion binding. The degree of micelle ionisation α equals 1 − β, and can be calculated from measurements of conductivity with concentration from the slope measured above the CMC (m1) divided by that below the CMC (m2): α = m1/m2.71 The calculated α values are listed in Table 1. It can be seen that micelles formed by POM-2Cn with longer tails have a lower counterion dissociation, therefore higher screening by the counterion. The POM-2Cn surfactants show similar changing trends in α as seen for traditional surfactants, such as di-alkyl sulfosuccinates, CnTAB and sodium alkyl sulfates (ESI Tables 2–4†).62,64,65,68,69,72 The counterion binding β and the CMC are related to the free energy of micellisation via equation: | (5) |
 was calculated to be between −8.5 and −15.9 kJ mol−1 at room temperature. The linear relationship in the variation of
  with the tail length is consistent with that observed for CnTAB surfactants.73 The value of the slope obtained from the line in Fig. 4, −1.26 ± 0.05 kJ mol−1, here represents the free energy increment for two CH2 groups (designated as
  ). The
  of the POM-2Cn system is much lower than that of CnTAB (−3.45 ± 0.2 kJ mol−1) with a single hydrocarbon tail.73
By comparing the  values of POM-2Cn with those of di-alkyl sulfosuccinate surfactants (ESI Table 2†), it is seen that the POM-2Cn surfactants can form micelles more easily in water because they have longer hydrophobic tails. They also have relatively similar free energies of micellisation65 with those of single-tailed CnTAB (n = 12, 14, 16) surfactants (ESI Table 3†). These results indicate that, despite the fact that POM-2Cn are double-tailed surfactants, they form micelles as easily as conventional single-tailed surfactants and aggregate more efficiently compared to conventional anionic double-tailed surfactants.
SANS study of POM-2Cn
Above their CMCs, the POM-2Cn surfactants assemble in water. The shape of these aggregates is expected to have important influences in the field of micellar catalysis,74 photochemistry75 and materials templating,76 and is therefore interesting to investigate. We used SANS to probe the micelles formed by these surfactants in aqueous solutions.The best fit for the micelles formed by POM-2C12 in water was obtained from a core–shell ellipsoidal model. The SANS patterns and their corresponding fits are plotted in Fig. 5 for the D2O contrast, while the fitted parameters along with the definition of the abbreviations are listed in Table 2. The elongation of the micelles was found to be dependent on the concentration: the ellipticity, ε, indicating the degree of elongation, varies from 4.0 ± 0.4 to 5.1 ± 0.4. Similarly, Rmin ranges from 11 ± 1 Å to 15 ± 1 Å, slightly below the length of fully extended C12H25 chains according to the Tanford equation (16.7 Å).77 Measurements of solutions prepared using 70 mol% D2O as solvent (a value that was calculated to contrast match the POM-2Cn headgroup) were also made (ESI Fig. 7A†). Fitting the data at 70 mol% D2O still required a shell in the model, but with a lower SLD than that calculated for both dry POM and solvent (ESI Table 5†), suggesting that a portion of the hydrocarbon tail is present in the shell. The shell thickness was found to decrease with increasing concentration (from 22 ± 1 Å at 16.6 mM to 13 ± 1 Å at 99.1 mM). Except for the lowest concentration, these values (see Table 2) are in the same range as the dry {P2W17O61} headgroup size (between 12 and 17 Å due to the ellipsoidal shape of the headgroup).78
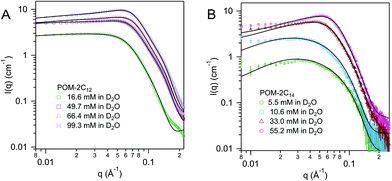 | ||
| Fig. 5 SANS patterns of (A) POM-2C12 and (B) POM-2C14 micelles in D2O at different concentrations. The fits are given as black lines. | ||
| Conc. (mM) | R (Å) | ε | t (Å) | z (e) | SLD (×10−6 Å−2) | ϕ |
|---|---|---|---|---|---|---|
| (±0.1) | (±1) | (±1) | (±0.5) | (±0.2) | (±0.005) | |
| a R min, the minimum radius of the core; Rmax, the maximum radius of the core; ε, Rmax/Rmin (ellipticity); ϕ, volume fraction; SLD, neutron scattering length density; t, shell thickness; z, micellar surface charge. | ||||||
| POM-2C12 | ||||||
| 16.6 | 11 | 4.5 ± 0.3 | 22 | 1.0 | 5.3 | 0.096 |
| 49.7 | 12 | 4.6 ± 0.3 | 16 | 1.0 | 5.0 | 0.140 |
| 66.4 | 12 | 5.1 ± 0.4 | 15 | 1.3 | 4.6 | 0.153 |
| 99.1 | 15 | 4.0 ± 0.4 | 13 | 1.5 | 4.8 | 0.160 |
| POM-2C14 | ||||||
| 5.5 | 17 | 1.9 ± 0.3 | 15 | 4.4 | 5.1 | 0.011 |
| 10.6 | 17 | 2.1 ± 0.3 | 18 | 3.7 | 5.3 | 0.034 |
| 33.0 | 18 | 2.0 ± 0.3 | 18 | 3.6 | 5.3 | 0.094 |
| 55.2 | 17 | 2.1 ± 0.2 | 18 | 4.3 | 5.0 | 0.137 |
With increasing concentration, a broad peak emerged at around q = 0.06 Å−1. The peak indicates the intermicellar interactions and was fitted using the RMSA model. The fits show a moderate increase in the charge per micelle with increasing concentration. The value for the charge on the micelle (around 1e) is surprisingly low given the potential −6 charge available to the headgroup, suggesting that although the conductivity results indicate that counterion dissociation is relatively high at the CMC, it becomes much lower above the CMC.
POM-2C14 also forms ellipsoidal micelles in water according to the modelling of the SANS patterns given in Fig. 5B (D2O contrast) and ESI Fig. 7B† (70 mol% D2O contrast). Fit parameters associated with the form factor of POM-2C14 micelles were found to have little dependence on the surfactant concentration (see Table 2). These micelles were less elongated compared to their POM-2C12 counterparts, with an ellipticity of ca. 2.0. Rmin was found around 17–18 Å, again slightly smaller than the size of the fully extended C14H29 chain (19.2 Å) estimated by the Tanford equation.77 The hydrated shell thicknesses were found to be 15 ± 1 Å at 5.5 mM and 18 ± 1 Å for higher concentrations, which lies in the size range (12–17 Å) of {P2W17O61}.78 The difference in shell thickness between 5.5 mM and the other concentrations is probably due to the weak signal at this low concentration. Increasing concentration also results in electrostatic repulsion arising between micelles, evidenced by a broad peak in the SANS patterns, however, this time a higher micelle surface charge was seen (3.6–4.4e).
For both POM-2C16 and POM-2C18, the fitting of the SANS patterns suggests the formation of spherical micelles in water, rather than ellipsoidal micelles (see Fig. 6 and ESI Fig. 8†). The radius of the spherical micelles (R) was found to be around 20 and 22 Å respectively. Shell thickness was around 19 Å for POM-2C16, and 17 Å for POM-2C18 (see Table 3 and ESI Table 6†). Similar to POM-2C14, an increase in the concentration resulted in an increase in the intermicellar interactions, modelled by an increase in the volume fraction ϕ. The surface charge was found to be around 4.2e for POM-2C16, and around 5.2e for POM-2C18. Although in general, the fit reproduced the data well, it was observed to fail to reproduce the scattering at the lowest angles for the 70 mol% D2O solution at high concentrations (see ESI Fig. 8†), probably caused by a small amount of large aggregates observed in these samples.
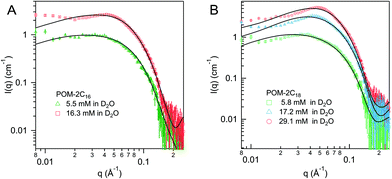 | ||
| Fig. 6 SANS patterns of (A) POM-2C16 and (B) POM-2C18 micelles in D2O at different concentrations. The fits are given as black lines. | ||
| Conc. (mM) | R (Å) | t (Å) | z (e) | SLD (×10−6 Å−2) | ϕ |
|---|---|---|---|---|---|
| (±0.1) | (±1) | (±1) | (±0.2) | (±0.5) | (±0.005) |
| a R, the radius of the core; ϕ, volume fraction; SLD, neutron scattering length density; t, shell thickness; z, micellar surface charge. | |||||
| POM-2C16 | |||||
| 5.5 | 20 | 19 | 4.2 | 5.6 | 0.019 |
| 16.3 | 22 | 19 | 4.3 | 5.7 | 0.053 |
| POM-2C18 | |||||
| 5.8 | 22 | 17 | 4.9 | 5.6 | 0.015 |
| 17.2 | 22 | 17 | 5.5 | 5.5 | 0.049 |
| 29.1 | 22 | 17 | 5.2 | 5.3 | 0.077 |
From the SANS fitting, an increase in the radius of the micelles (comparing Rmin for ellipsoids and R for spheres) was observed with increasing hydrophobicity of the surfactant, in agreement with observations made for commercial CnTAB surfactants and sodium alkyl sulfates.64,67 Moreover, the tail length strongly influences the shape of the micelles, with an obvious change from an ellipsoid to a sphere as the hydrocarbon tail of the surfactants becomes longer. As illustrated in Fig. 7, POM-2C12 and POM-2C14 both form ellipsoid micelles in aqueous solutions, however, the ellipticity of POM-2C14 (around 2) is less than half of that of POM-2C12 (around 4.5), while both POM-2C16 and POM-2C18 form spherical micelles. In contrast, commercial single-tailed surfactants, such as CnTAB and sodium alkyl sulfates, undergo an increase of the micelle ellipticity with increased tail length (see the calculated ellipticity listed in ESI Tables 3 and 4† using the information provided by references).64,67
For the POM-Cn surfactants, the theoretical packing parameters, calculated for different tail lengths but assuming the same equilibrium area per molecule (the cross-sectional area of the headgroup estimated according to the size of the headgroup,78 124.3 Å2), lies close to the 1/3 limit between spherical and rod-like micelles, without any clear trend explaining the experimental data. This suggests that the equilibrium area per molecule may be different between them due to the difference in the repulsion between the surfactant headgroups. Considering the repulsive interactions, as listed in Tables 2 and 3, the surface charge increases with the tail length which may induce a larger equilibrium area per molecule. Therefore the packing parameter (= v/al, where, a is the equilibrium area per molecule, v is the hydrophobic tail volume and l is the hydrophobic tail length, the volume-to-length ratio v/l of the tail is independent of the tail length for common surfactants) decreases with increased tail length, giving a value under 1/3, which predicts the formation of spherical micelles.79 This is consistent with the SANS results where longer tailed surfactants form more globular micelles.
Dynamic light scattering (DLS) was used to detect the hydrodynamic radius distributions of the micelles, shown in Fig. 8A. The singular peak in the DLS volume-weighted size distribution results suggests that there is only one population of micelles in each solution. An increase in size obtained from DLS is observed with tail length, C14H29, C16H33 and C18H37 give a hydrodynamic radius of 31 ± 5, 41 ± 5, and 48 ± 5 Å respectively, in agreement with the increase of micellar size observed from SANS fitting results. It is noted that the size of the POM-2C12 micelles (48 ± 5 Å) probed by DLS is relatively larger compared to those of POM-2C14 and POM-2C16 micelles, likely due to their ellipsoidal shape, which is not taken into account in DLS analysis. The POM-2Cn micelles exhibit strongly negative surface charges as evidenced by their zeta-potentials (see Fig. 8B), giving similar results to the conductivity measurements (longer-tailed surfactant forms micelles with less charged surfaces), but opposite trend to the micelle charge information obtained from SANS fitting. The reason for the opposite trend between SANS results and zeta-potentials remains unclear at this stage.
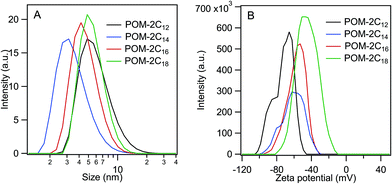 | ||
| Fig. 8 (A) Volume-weighted size distributions (obtained via the CONTIN method) and (B) zeta-potentials of 5.45 mM POM-2Cn solutions (n = 12, 14, 16 and 18). | ||
POM-TiO2 materials synthesised using POM-2Cn micelles as templates
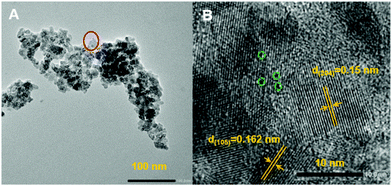
Catalysts were prepared by mixing POM-2Cn (n = 12, 16 and 18) with titania precursor in acidic solution, followed by a hydrothermal treatment, filtration and calcination at 500 °C to remove the organic 2CnH2n+1 chains from the material (see TGA analysis of the POM-2C12 in ESI Fig. 5A,† showing the organic part is burnt away). Several studies have demonstrated that the Wells–Dawson structure remains stable up to 600 °C,45–47 so it is expected to remain intact during calcination. Transmission electron microscopy (TEM) images of the 12POM-TiO2 material (Fig. 9A) show aggregates of small spherical particles. A higher resolution image focusing on a selected area of the 12POM-TiO2 material, made via HRTEM (Fig. 9B), clearly shows lattice fringes which indicate an ordered crystalline structure of the TiO2. Although the {P2W17O61} units have a very small size and a low concentration in the material (Table 4), they can be seen as black dots in the HRTEM micrograph because of their high electron density. Several of these dots are highlighted using green dashed circles in Fig. 9B.![[thin space (1/6-em)]](https://www.rsc.org/images/entities/char_2009.gif) :
:![[thin space (1/6-em)]](https://www.rsc.org/images/entities/char_2009.gif) W atomic ratios obtained from EDX analysis, surface areas obtained from BET annalysis and mean pore sizes
W atomic ratios obtained from EDX analysis, surface areas obtained from BET annalysis and mean pore sizes
| Material | Ti![[thin space (1/6-em)]](https://www.rsc.org/images/entities/char_2009.gif) : :![[thin space (1/6-em)]](https://www.rsc.org/images/entities/char_2009.gif) W W |
Surface area (m2 g−1) | Mean pore size (nm) |
|---|---|---|---|
| 12POM-TiO2 | 122![[thin space (1/6-em)]](https://www.rsc.org/images/entities/char_2009.gif) : :![[thin space (1/6-em)]](https://www.rsc.org/images/entities/char_2009.gif) 1 1 |
191 ± 8 | 6.4 ± 0.5 |
| 16POM-TiO2 | 154![[thin space (1/6-em)]](https://www.rsc.org/images/entities/char_2009.gif) : :![[thin space (1/6-em)]](https://www.rsc.org/images/entities/char_2009.gif) 1 1 |
165 ± 8 | 5.3 ± 0.6 |
| 18POM-TiO2 | 169![[thin space (1/6-em)]](https://www.rsc.org/images/entities/char_2009.gif) : :![[thin space (1/6-em)]](https://www.rsc.org/images/entities/char_2009.gif) 1 1 |
148 ± 5 | 6.2 ± 0.4 |
| 16POM-TiO2-2 | 12![[thin space (1/6-em)]](https://www.rsc.org/images/entities/char_2009.gif) : :![[thin space (1/6-em)]](https://www.rsc.org/images/entities/char_2009.gif) 1 1 |
179 ± 5 | 5.0 ± 0.6 |
| TiO2 | — | 99 ± 5 | 8.3 ± 0.4 |
EDX elemental mapping analysis also evidences the presence of the POM units within the hybrid material. The element distributions of the 12POM-TiO2 associated with the TEM image in Fig. 9A, are given in ESI Fig. 9.† It was clear that both W and Ti elements are uniformly distributed within the material, suggesting the existence of POMs within the hybrid material.
To verify the structural integrity of the Dawson structure of the POMs within the material, IR spectroscopy of the 12POM-TiO2 material was attempted (see ESI Fig. 10†). Due to the small amount of POMs in the material (Ti![[thin space (1/6-em)]](https://www.rsc.org/images/entities/char_2009.gif) :
:![[thin space (1/6-em)]](https://www.rsc.org/images/entities/char_2009.gif) W = 122
W = 122![[thin space (1/6-em)]](https://www.rsc.org/images/entities/char_2009.gif) :
:![[thin space (1/6-em)]](https://www.rsc.org/images/entities/char_2009.gif) 1, see Table 4), the characteristic peaks of Dawson structured POM were observed as a single broad peak at ca. 1080 nm−1 in the IR spectrum.
1, see Table 4), the characteristic peaks of Dawson structured POM were observed as a single broad peak at ca. 1080 nm−1 in the IR spectrum.
Reduced POMs are known to reduce metal ions in situ to metal nanoparticles. Therefore, to corroborate the preservation of POM units within the porous TiO2,80 the photocatalytic reduction of Ag+ was carried out. Experimental details can be found in the Experimental section. EDX elemental mapping analysis was applied to the collected brown product, and the Ag element distribution is shown in ESI Fig. 11B,† suggesting that Ag nanoparticles are present in the product. This indicates that POM units are present and are chemically active.
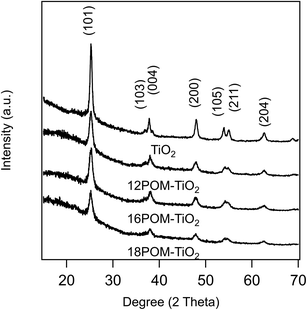
The PXRD patterns of SDS templated TiO2, 12POM-TiO2, 16POM-TiO2 and 18POM-TiO2 materials (Fig. 10) demonstrate the characteristic diffraction peaks of anatase TiO2 (space group: I41/amd, JCPDS no. 21–1272). We found no diffraction evidence for the POM phase (see ESI Fig. 12†), since the POM within the TiO2 are dispersed but not crystallised. This is also seen in the PXRD pattern of dried POM-2C12 surfactant which also shows no diffraction peak (see ESI Fig. 13†). Small angle X-ray scattering showed no long-range ordering of the pores within the SDS templated TiO2 or the nPOM-TiO2 materials (see ESI Fig. 14†).
Both SDS templated TiO2 and nPOM-TiO2 materials show a type IV nitrogen sorption isotherm (see ESI Fig. 15A†). The resulting nPOM-TiO2 materials have relatively high surface areas, listed in Table 4 along with their mean pore diameters (pore size distributions are illustrated in ESI Fig. 15B†). nPOM-TiO2 materials have smaller mean pore sizes compared to SDS templated TiO2 due to the occupation of POMs within the pores. The mean pore diameter of 12POM-TiO2 material lies between the minimum size (2Rmin = 2.2 nm) and the maximum size (2Rmax = 9.9 nm) of the POM-2C12 micelles. The 16POM-TiO2 and 18POM-TiO2 materials have slightly larger mean pore sizes compared to their corresponding micellar diameter (4.0 and 4.4 nm). Larger pores (around ca. 60–100 nm) were also observed in 12POM-TiO2, which contribute to this sample having the largest surface area among nPOM-TiO2 materials. The mean pore size of the 18POM-TiO2 material is about 17.5% larger in comparison to 16POM-TiO2, which demonstrates the tunability of the pore size through using larger spherical micelles as soft templates.
To evaluate the effect of the POM surfactant concentration on the structural properties of the material, a second TiO2 material was prepared using POM-2C16 at a higher concentration (22.0 mM) and labelled 16POM-TiO2-2. EDX elemental mapping shows the presence of POM in the 16POM-TiO2-2 (see ESI Fig. 16†). The POM content in 16POM-TiO2-2, indicated by the Ti![[thin space (1/6-em)]](https://www.rsc.org/images/entities/char_2009.gif) :
:![[thin space (1/6-em)]](https://www.rsc.org/images/entities/char_2009.gif) W ratio listed in Table 4, is much higher than for 16POM-TiO2. This suggests that the amount of POM in the hybrid materials can be tuned by the concentration of the POM-2Cn used in the preparation solution. No diffraction peaks are observed in the SAXS pattern (ESI Fig. 17†), again suggesting no long-range organisation of the pores. The 16POM-TiO2-2 material has a slightly higher surface area compared to 16POM-TiO2 (179 m2 g−1versus 169 m2 g−1) and a relatively smaller mean pore size (5.0 nm versus 5.3 nm), parameters given in Table 4. The sorption isotherm of 16POM-TiO2-2 (ESI Fig. 18†) shows a more obvious hysteresis loop than for 16POM-TiO2, indicating the presence of more well defined mesopores.
W ratio listed in Table 4, is much higher than for 16POM-TiO2. This suggests that the amount of POM in the hybrid materials can be tuned by the concentration of the POM-2Cn used in the preparation solution. No diffraction peaks are observed in the SAXS pattern (ESI Fig. 17†), again suggesting no long-range organisation of the pores. The 16POM-TiO2-2 material has a slightly higher surface area compared to 16POM-TiO2 (179 m2 g−1versus 169 m2 g−1) and a relatively smaller mean pore size (5.0 nm versus 5.3 nm), parameters given in Table 4. The sorption isotherm of 16POM-TiO2-2 (ESI Fig. 18†) shows a more obvious hysteresis loop than for 16POM-TiO2, indicating the presence of more well defined mesopores.
Photocatalytic properties
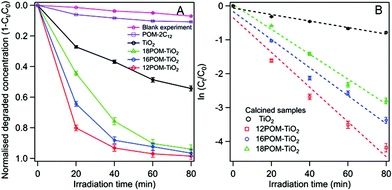
Dawson structured {P2W17O61} was chosen as the focus of this work for its photocatalytic properties. The photoabsorption of 12POM-TiO2 in the range of 250–800 nm shows an absorbance shoulder for wavelengths between ca. 400 and 700 nm (ESI Fig. 19A†). The 12POM-TiO2 possesses a bandgap at around 3.3 eV (obtained by plotting (Ah)2 as a function of the energy), similar to that of TiO2 (ESI Fig. 19B†).81 The band gap does not change after the decoration of TiO2 with POM, however, the resulting material now shows absorbance in a wavelength range where TiO2 normally would not absorb.82,83The photocatalytic properties of the nPOM-TiO2 materials were tested via the degradation of RhB during irradiation of these materials with solar light (see for example ESI Fig. 20A†). Their photocatalytic behaviours were compared to SDS templated TiO2 which has a surface area of ca. 99 m2 g−1. The nPOM-TiO2 (n = 12, 16 and 18) materials showed higher activities than that of the SDS templated TiO2 (Fig. 11A). The photodegradation properties of the POM amphiphiles alone, compared to the POMs supported within the 12POM-TiO2 material were evaluated under the same conditions, by using the same number of moles of POM-2C12 as that of the POM species in 0.015 grams of 12POM-TiO2. A bathochromic shift and an obvious drop in the intensity of the main absorption peak were observed in the UV-vis spectrum of RhB (see ESI Fig. 20B†) after POM-2C12 was added to the starting solution (RhB, 0.031 mM; H2O2, 1.5 mM). This shift in the spectrum has been previously reported and can be explained by strong electrostatic interactions between RhB molecules with the negatively charged polyoxometalate species.84,85 Due to the shift in the spectrum, the concentration of RhB in this solution was determined using the absorption intensity at 565 nm rather than at 553 nm as for the nPOM-TiO2 materials. As seen in Fig. 11A, around 11% of RhB was decomposed by POM-2C12 in 80 min, which is ca. one-tenth of the amount that the equivalent amount of POM within 12POM-TiO2 decomposed over the same time. These results suggest a synergistic effect between POMs and TiO2 in the nPOM-TiO2 materials that we prepared.
Among the nPOM-TiO2 materials, the 12POM-TiO2 exhibited the best degradation performance, with almost 80% of the RhB degraded after 20 min. 16POM-TiO2 and 18POM-TiO2 were less effective in the first 20 min, decomposing ca. 65% and 45% of RhB respectively. The degradation rates fit a first-order model well. The slope of a linear plot of ln (Ct/C0) versus irradiation time gives the apparent degradation rate constant (Fig. 11B). The obtained fitting parameters related to the kinetics, apparent degradation rate constant kobs and correlation coefficient r, are listed in Table 5. There is an obvious rate enhancement of nPOM-TiO2 compared to porous TiO2, increasing from 0.0096 to 0.0513 min−1. Correlation coefficients, r, are found to be between 0.9683 and 0.9910, indicating the excellent linear response in the studied range of concentrations.
| Material | k obs (min−1) | r |
|---|---|---|
| 12POM-TiO2 | 0.0513 ± 0.0016 | 0.9683 |
| 16POM-TiO2 | 0.0414 ± 0.0008 | 0.9799 |
| 18POM-TiO2 | 0.0367 ± 0.0003 | 0.9910 |
| TiO2 | 0.0096 ± 0.0003 | 0.9708 |
The Ti to W atomic ratio in each material obtained from EDX elemental mapping analysis is listed in Table 4. The 12POM-TiO2 hybrid material has a relatively higher W content compared to 16POM-TiO2 and 18POM-TiO2, and also had the highest POM content in the materials synthesised at this POM amphiphile concentration. The value of kobs decreases as the amount of POM present in the nPOM-TiO2 materials decreases. Therefore, besides the high surface area induced by the surfactant templating, the higher POM content of the prepared 12POM-TiO2 also contributes to its outstanding properties in RhB photodegradation compared to the other materials studied here.
When the ratio of POM to TiO2 was increased, in the 16POM-TiO2-2 compared to 16POM-TiO2, the degradation of RhB was completed more rapidly than when 16POM-TiO2 was used (60 min versus 80 min as shown in ESI Fig. 21†). This suggests the possibility of tuning the photocatalytic properties of the hybrid materials through altering the POM content.
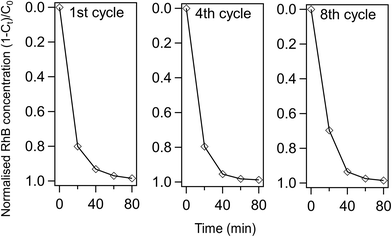
Furthermore, the RhB photodegradation activity of 12POM-TiO2 is still remarkably high after eight continuous photo-catalytic cycles (see Fig. 12). The complete photodegradation of RhB is still obtained after 80 min at the 8th cycle, while there is a slight decrease of the amount of RhB degraded after 20 min (ca. 70% versus 80% for the 1st cycle). The PXRD pattern of 12POM-TiO2 after 8 cycles indicates an anatase phase (ESI Fig. 12†), equivalent to that in the fresh material, showing the stability of the TiO2 structure over several cycles.
The photocatalytic pathway can be summarised as follows:39,86 (1) the electrons are excited from the valence band (VB) to the conduction band (CB) of TiO2 under UV irradiation. (2) The electrons at the CB of TiO2 transfer to the POMs. Furthermore, POMs are photo-excited simultaneously and the electrons from both the CB of TiO2 and the photoexcitation of POMs accumulate together on the POMs to form charge-transfer excited POMs (designated as POMs*). (3) POMs* transfer electrons to oxygen in the solution to form reactive oxygen species, while photoexcited holes react with water to form ˙OH radicals, and (4) these radicals are involved in the process of photodegradation. POMs have been proven to enhance the photocatalytic properties of TiO2 in several studies,38,39 since they efficiently reduce the recombination rate of photoexcited holes and electrons in TiO2. Therefore, step (1) is enhanced. Step (2) is accelerated here due to the intimate contact between POMs and TiO2 given by the synthesis method. Moreover, POMs not only behave as charge separators in the hybrid materials but also photocatalysts that contribute to the photodegradation. Furthermore, the electrostatic interaction between oppositely charged POMs and RhB molecules also reinforces step (4). Overall, the decorating POMs speed up the degradation efficiency due to their rapid transportation of electrons, their ability to decrease the recombination rate of electron–hole pairs and their intrinsic photocatalytic properties, rather than by narrowing the band gap.
Chen, et al.39 have studied the photocatalytic degradation of 2,4-dichlorophenol by PW12O403−/TiO2 prepared by physical mixing, and the performance was improved by nearly 20% within the first 50 min when 0.8 mM PW12O403− was present. This method, however, limits the recyclability of the PW12O403− due to its solubility in water. Photodegradation of 1,2-dichlorobenzene using systems of TiO2 and polyoxometalates (PW12O403−, SiW12O404− or W10O324−) were studied by Ozer and co-workers.87 The addition of POM anions into the TiO2 suspension resulted in a significant rate enhancement, with PW12O403− the most effective anion. The rate constant reached a limit of 0.03 min−1, 600% greater than pure TiO2 system, when the addition of PW12O403− was at ca. 0.15 mM. In comparison to our work, the degradation rate constant of 12POM-TiO2 is 0.051 min−1, which is around 500% greater than that of the SDS templated TiO2 material (0.0096 min−1), while, importantly our materials also provide recyclability. Pearson et al. conducted a series of studies on materials obtained by loading H3P12W12O40 onto TiO2 nanoparticles or TiO2 nanotubes as a co-catalyst.40,88,89 The degradation of Congo red dye was improved by around 14% compared to the original TiO2 within the first 30 min.40,89 However, the recyclability of the materials was not studied.
Thus, our system enables an improvement in photodegradation properties as well as providing improved recyclability, with photocatalytic performance maintained for at least eight continuous photo-catalysis cycles, compared to the addition of polyoxometalates into a TiO2 suspension or the previous studies discussed above. The POM content in the POM-TiO2 materials can be tuned through varying the concentration of POM amphiphiles. This synthesis method provides a stronger anchoring of polyoxometalates within the hybrid material and intimate contact between the polyoxometalates and TiO2, ensuring their stability during use, easy recovery and reuse of the materials.
Conclusion
Novel surfactants with inorganic {P2W17O61} POM as headgroups and double-hydrocarbon chains (C12, C14, C16 or C18) were successfully synthesised. The micelle morphologies were studied using SANS to reveal core–shell structures. The shape of the micelles can be tuned by changing the length of the hydrophobic tails, such that surfactants with longer hydrophobic tails tend to form less elongated and more globular micelles. Moreover, SANS evidenced strong interactions due to Coulomb repulsion between negatively charged micelles. These data were supported by DLS and zeta-potential measurements. The micelles were used to template TiO2 through a hydrothermal method to form, after calcination, nPOM-TiO2 hybrid catalysts (n = 12, 16 or 18). Through this method, the {P2W17O61} units, as an excellent electron acceptor, an electron transport material and a photocatalyst, were incorporated into the porous titania materials. The photocatalytic properties of the nPOM-TiO2 hybrid materials were tested by the photodegradation of aqueous RhB solution as a model reaction. The results reveal that the nPOM-TiO2 photocatalysts possess enhanced photodegradation properties in comparison with SDS templated TiO2, confirming their superior photocatalytic activity. The rate constants of the photodegradation extracted here were found to be almost 5 times higher for the 12POM-TiO2 materials compared to porous TiO2 templated by SDS. This study demonstrates the highly promising use of POM-2Cn amphiphiles as templating agents in the synthesis of porous POM-TiO2 hybrid catalyst, having well-dispersed polyoxometalates within a porous anatase TiO2 matrix. Using the same method, it is possible to increase the polyoxometalate content in the material by using a higher concentration of the initial surfactant solution. Furthermore, other metal oxide materials loaded with polyoxometalates could be synthesised using similar methods, offering a flexible and straightforward approach to harness the functionality of polyoxometalates in porous materials for catalysis.Conflicts of interest
There are no conflicts to declare.Acknowledgements
A. Di. thanks University of Bath and China Scholarship Council for supporting her Ph.D studies. The authors would like to thank the ISIS Neutron and Muon Source for the award of beam time (experiment no. RB1720185, DOI: 10.5286/ISIS.E.RB1720185). We acknowledge assistance from Andrew P. Golightly in developing POM amphiphile synthesis routes, and RJE thanks EPSRC, Johnson Matthey (Synetix) and ICI (Uniqema) for an Industrial CASE Award to APG (GR/P02066/01). The authors gratefully acknowledge the Material and Chemical Characterisation Facility (MC2) at University of Bath (DOI: 10.15125/mx6j-3r54) for technical support and assistance in this work. This work benefited from the use of the SasView application, originally developed under NSF award DMR-0520547. SasView contains code developed with funding from the European Unions Horizon 2020 research and innovation programme under the SINE2020 project, grant agreement No. 654000. The data supporting this work has been uploaded to the University of Bath Research Data Repository and is accessible at DOI: 10.15125/BATH-00931.References
- Y. F. Song, D. L. Long, C. Ritchie and L. Cronin, Chem. Rec., 2011, 11, 158–171 CrossRef CAS.
- M. T. Pope and A. Müller, in Introduction to polyoxometalate chemistry: from topology via self-assembly to applications, Springer, 2001, pp. 1–6 Search PubMed.
- Q. Fang, J. Fu, F. Wang, Z. Qin, W. Ma, J. Zhang and G. Li, New J. Chem., 2019, 43, 28–36 RSC.
- Y. Chen, S. Tian, Z. Qin, J. Zhang, Y. Cao, S. Chu, L. Lu and G. Li, Nanoscale, 2019, 11, 22270–22276 RSC.
- B. Keita, G. Zhang, A. Dolbecq, P. Mialane, F. Sécheresse, F. Miserque and L. Nadjo, J. Phys. Chem. C, 2007, 111, 8145–8148 CrossRef CAS.
- S. Gao, R. Cao, J. Lü, G. Li, Y. Li and H. Yang, J. Mater. Chem., 2009, 19, 4157–4163 RSC.
- A. Hiskia, A. Mylonas and E. Papaconstantinou, Chem. Soc. Rev., 2001, 30, 62–69 CAS.
- Y. Chen, C. Zhang, C. Yang, J. Zhang, K. Zheng, Q. Fang and G. Li, Nanoscale, 2017, 9, 15332–15339 RSC.
- S. Kim, H. Park and W. Choi, J. Phys. Chem. B, 2004, 108, 6402–6411 CrossRef CAS.
- E. Bae, J. W. Lee, B. H. Hwang, J. Yeo, J. Yoon, H. J. Cha and W. Choi, Chemosphere, 2008, 72, 174–181 CrossRef CAS.
- C. Hu, Y. Zhang, L. Xu and G. Peng, Appl. Catal., A, 1999, 177, 237–244 CrossRef CAS.
- J. Zhang, A. Wang, Y. Wang, H. Wang and J. Gui, Chem. Eng. J., 2014, 245, 65–70 CrossRef CAS.
- S. Damyanova, M. Cubeiro and J. Fierro, J. Mol. Catal. A: Chem., 1999, 142, 85–100 CrossRef CAS.
- K. Lv and Y. Xu, J. Phys. Chem. B, 2006, 110, 6204–6212 CrossRef CAS.
- S. Ahn, S. L. Nauert, C. T. Buru, M. Rimoldi, H. Choi, N. M. Schweitzer, J. T. Hupp, O. K. Farha and J. M. Notestein, J. Am. Chem. Soc., 2018, 140, 8535–8543 CrossRef CAS.
- H.-L. Li, N. Perkas, Q.-L. Li, Y. Gofer, Y. Koltypin and A. Gedanken, Langmuir, 2003, 19, 10409–10413 CrossRef CAS.
- Z. Karimi, A. Mahjoub and F. D. Aghdam, Inorg. Chim. Acta, 2009, 362, 3725–3730 CrossRef CAS.
- W. Kaleta and K. Nowiska, Chem. Commun., 2001, 535–536 RSC.
- H. Hamadi, M. Kooti, M. Afshari, Z. Ghiasifar and N. Adibpour, J. Mol. Catal. A: Chem., 2013, 373, 25–29 CrossRef CAS.
- T. Kovalchuk, H. Sfihi, L. Kostenko, V. Zaitsev and J. Fraissard, J. Colloid Interface Sci., 2006, 302, 214–229 CrossRef CAS.
- W. Qi, H. Li and L. Wu, Adv. Mater., 2007, 19, 1983–1987 CrossRef CAS.
- H. Li, H. Sun, W. Qi, M. Xu and L. Wu, Angew. Chem., Int. Ed., 2007, 46, 1300–1303 CrossRef CAS.
- D. M. Fernandes, H. M. Carapuça, C. M. Brett and A. M. Cavaleiro, Thin Solid Films, 2010, 518, 5881–5888 CrossRef CAS.
- D. Zhao, J. Feng, Q. Huo, N. Melosh, G. H. Fredrickson, B. F. Chmelka and G. D. Stucky, Science, 1998, 279, 548–552 CrossRef CAS.
- J. S. Beck, J. C. Vartuli, W. J. Roth, M. E. Leonowicz, C. T. Kresge, K. D. Schmitt, C. T. W. Chu, D. H. Olson, E. W. Sheppard, S. B. McCullen, J. B. Higgins and J. L. Schlenker, J. Am. Chem. Soc., 1992, 114, 10834–10843 CrossRef CAS.
- Q. Huo, D. I. Margolese, U. Ciesla, P. Feng, T. E. Gier, P. Sieger, R. Leon, P. M. Petroff, F. Schüth and G. D. Stucky, Nature, 1994, 368, 317 CrossRef CAS.
- T. Maschmeyer, F. Rey, G. Sankar and J. M. Thomas, Nature, 1995, 378, 159 CrossRef CAS.
- C. P. Mehnert, Chem. Commun., 1997, 2215–2216 RSC.
- Y. Han, Y. Xiao, Z. Zhang, B. Liu, P. Zheng, S. He and W. Wang, Macromolecules, 2009, 42, 6543–6548 CrossRef CAS.
- S. Landsmann, M. Luka and S. Polarz, Nat. Commun., 2012, 3, 1299 CrossRef.
- S. Polarz, S. Landsmann and A. Klaiber, Angew. Chem., Int. Ed., 2014, 53, 946–954 CrossRef CAS.
- J. J. Giner-Casares, G. Brezesinski, H. Möhwald, S. Landsmann and S. Polarz, J. Phys. Chem. Lett., 2012, 3, 322–326 CrossRef CAS.
- J. Zhang, Y. Huang, G. Li and Y. Wei, Coord. Chem. Rev., 2019, 378, 395–414 CrossRef CAS.
- D. Y. Leung, X. Fu, C. Wang, M. Ni, M. K. Leung, X. Wang and X. Fu, ChemSusChem, 2010, 3, 681–694 CrossRef CAS.
- H. Guan, L. Zhu, H. Zhou and H. Tang, Anal. Chim. Acta, 2008, 608, 73–78 CrossRef CAS.
- J. Du, X. Lai, N. Yang, J. Zhai, D. Kisailus, F. Su, D. Wang and L. Jiang, ACS Nano, 2010, 5, 590–596 CrossRef.
- H. Zhang, X. Lv, Y. Li, Y. Wang and J. Li, ACS Nano, 2009, 4, 380–386 CrossRef.
- Z. Sun, L. Xu, W. Guo, B. Xu, S. Liu and F. Li, J. Phys. Chem. C, 2010, 114, 5211–5216 CrossRef CAS.
- C. Chen, P. Lei, H. Ji, W. Ma, J. Zhao, H. Hidaka and N. Serpone, Environ. Sci. Technol., 2004, 38, 329–337 CrossRef CAS.
- A. Pearson, H. Jani, K. Kalantar-Zadeh, S. K. Bhargava and V. Bansal, Langmuir, 2011, 27, 6661–6667 CrossRef CAS.
- Y. Guo and C. Hu, J. Mol. Catal. A: Chem., 2007, 262, 136–148 CrossRef CAS.
- N. Fu and G. Lu, Chem. Commun., 2009, 3591–3593 CAS.
- M. W. Droege, Ph.D Dissertation, University of Oregon, 1984.
- R. G. Finke, M. W. Droege and P. J. Domaille, Inorg. Chem., 1987, 26, 3886–3896 CrossRef CAS.
- C. Comuzzi, G. Dolcetti, A. Trovarelli, F. Cavani, F. Trifirò, J. Llorca and R. G. Finke, Catal. Lett., 1996, 36, 75–79 CrossRef CAS.
- G. Baronetti, L. Briand, U. Sedran and H. Thomas, Appl. Catal., A, 1998, 172, 265–272 CrossRef CAS.
- L. E. Briand, G. M. Valle and H. J. Thomas, J. Mater. Chem., 2002, 12, 299–304 RSC.
- B. Sun, G. Zhou, C. Shao, B. Jiang, J. Pang and Y. Zhang, Powder Technol., 2014, 256, 118–125 CrossRef CAS.
- E. Papaconstantinou, J. Chem. Soc., Chem. Commun., 1982, 12–13 RSC.
- P. Seeger and R. Hjelm, J. Appl. Crystallogr., 1991, 24, 467–478 CrossRef.
- O. Arnold, J.-C. Bilheux, J. Borreguero, A. Buts, S. I. Campbell, L. Chapon, M. Doucet, N. Draper, R. F. Leal and M. Gigg, Nucl. Instrum. Methods Phys. Res., Sect. A, 2014, 764, 156–166 CrossRef CAS.
- G. T. Wignall and F. Bates, J. Appl. Crystallogr., 1987, 20, 28–40 CrossRef CAS.
- A. Guinier, G. Fournet and K. L. Yudowitch, Small Angle Scattering of X-rays, John Wiley & Sons, Inc., New York, 1955 Search PubMed.
- M. Kotlarchyk and S. Chen, J. Chem. Phys., 1983, 79, 2461–2469 CrossRef CAS.
- S. Berr, J. Phys. Chem., 1987, 91, 4760–4765 CrossRef CAS.
- J.-P. Hansen and J. B. Hayter, Mol. Phys., 1982, 46, 651–656 CrossRef CAS.
- K. R. Srinivasan and R. L. Kay, J. Chem. Phys., 1974, 60, 3645–3648 CrossRef CAS.
- K. V. Kumar, K. Porkodi and F. Rocha, Catal. Commun., 2008, 9, 82–84 CrossRef CAS.
- N. Fay, E. Dempsey, A. Kennedy and T. McCormac, J. Electroanal. Chem., 2003, 556, 63–74 CrossRef CAS.
- C. Kato, S. Nishihara, R. Tsunashima, Y. Tatewaki, S. Okada, X.-M. Ren, K. Inoue, D.-L. Long and L. Cronin, Dalton Trans., 2013, 42, 11363–11366 RSC.
- M. N. Sokolov, N. V. Izarova, E. V. Peresypkina, D. A. Mainichev and V. P. Fedin, Inorg. Chim. Acta, 2009, 362, 3756–3762 CrossRef CAS.
- L. Magid, K. Daus, P. Butler and R. Quincy, J. Phys. Chem., 1983, 87, 5472–5478 CrossRef CAS.
- M. Karaman, B. Ninham and R. Pashley, J. Phys. Chem., 1994, 98, 11512–11518 CrossRef CAS.
- J. Joshi, V. Aswal and P. Goyal, J. Macromol. Sci. Phys., 2008, 47, 338–347 CrossRef CAS.
- G. B. Ray, I. Chakraborty, S. Ghosh, S. Moulik and R. Palepu, Langmuir, 2005, 21, 10958–10967 CrossRef CAS.
- P. Mukerjee and K. J. Mysels, Critical micelle concentrations of aqueous surfactant systems, National Bureau of Standard, NSRDS-NBS 36, US Goverment Printing Office, Washingtong D. C., 1971, pp. 66–67 Search PubMed.
- S. Vass, T. Gilanyi and S. Borbely, J. Phys. Chem. B, 2000, 104, 2073–2081 CrossRef CAS.
- K. J. Mysels and R. J. Otter, J. Colloid Sci., 1961, 16, 462–473 CrossRef CAS.
- H. Gharibi and A. Rafati, Langmuir, 1998, 14, 2191–2196 CrossRef CAS.
- H. Nakamura, A. Sano and K. Matsuura, Anal. Sci., 1998, 14, 379–382 CrossRef CAS.
- A. Dominguez, A. Fernandez, N. Gonzalez, E. Iglesias and L. Montenegro, J. Chem. Educ., 1997, 74, 1227–1231 CrossRef CAS.
- R. Zana, J. Colloid Interface Sci., 1980, 78, 330–337 CrossRef CAS.
- R. Zana, Langmuir, 1996, 12, 1208–1211 CrossRef CAS.
- M. N. Khan, Micellar catalysis, CRC Press, 2006 Search PubMed.
- T. Wolff and B. Klaussner, Adv. Colloid Interface Sci., 1995, 59, 31–94 CrossRef CAS.
- Y. Liu, J. Goebl and Y. Yin, Chem. Soc. Rev., 2013, 42, 2610–2653 RSC.
- C. Tanford, J. Phys. Chem., 1974, 78, 2469–2479 CrossRef CAS.
- S. G. Mitchell and M. Jesús, J. Mater. Chem., 2012, 22, 18091–18100 RSC.
- R. Nagarajan, Langmuir, 2002, 18, 31–38 CrossRef CAS.
- A. Troupis, A. Hiskia and E. Papaconstantinou, Appl. Catal., B, 2003, 42, 305–315 CrossRef CAS.
- K. M. Reddy, C. G. Reddy and S. Manorama, J. Solid State Chem., 2001, 158, 180–186 CrossRef.
- T. Tachikawa, S. Tojo, K. Kawai, M. Endo, M. Fujitsuka, T. Ohno, K. Nishijima, Z. Miyamoto and T. Majima, J. Phys. Chem. B, 2004, 108, 19299–19306 CrossRef CAS.
- K. M. Reddy, S. V. Manorama and A. R. Reddy, Mater. Chem. Phys., 2003, 78, 239–245 CrossRef.
- C. Chen, J. Li, W. Zhao, J. Zhao, L. Wan and Y. Xu, Sci. China, Ser. B: Chem., 2003, 46, 577–582 CrossRef.
- C. Chen, W. Zhao, P. Lei, J. Zhao and N. Serpone, Chem. – Eur. J., 2004, 10, 1956–1965 CrossRef CAS.
- S. Yanagida, A. Nakajima, T. Sasaki, Y. Kameshima and K. Okada, Chem. Mater., 2008, 20, 3757–3764 CrossRef CAS.
- R. R. Ozer and J. L. Ferry, Environ. Sci. Technol., 2001, 35, 3242–3246 CrossRef CAS.
- A. Pearson, S. K. Bhargava and V. Bansal, Langmuir, 2011, 27, 9245–9252 CrossRef CAS.
- A. Pearson, H. Zheng, K. Kalantar-zadeh, S. K. Bhargava and V. Bansal, Langmuir, 2012, 28, 14470–14475 CrossRef CAS.
Footnote |
| † Electronic supplementary information (ESI) available. See DOI: 10.1039/D0NR05967F |
| This journal is © The Royal Society of Chemistry 2020 |

