 Open Access Article
Creative Commons Attribution 3.0 Unported Licence
Different spin axis orientation and large antiferromagnetic domains in Fe-doped NiO/Ru(0001) epitaxial films
Anna
Mandziak
 *ab,
Guiomar D.
Soria
b,
José Emilio
Prieto
b,
Michael
Foerster
a,
Juan
de la Figuera
b and
Lucia
Aballe
a
aAlba Synchrotron Light Facility, CELLS, Barcelona E-08290, Spain. E-mail: ania.mandziak@iqfr.csic.es
bInstituto de Química Física Rocasolano (CSIC), Madrid E-28006, Spain
First published on 14th October 2020
Abstract
We present a spatially resolved X-ray magnetic dichroism study of high-quality, in situ grown nickel oxide films. NiO thin films were deposited on a Ru(0001) substrate by high temperature oxygen-assisted molecular beam epitaxy. We found that by adding a small amount of Fe, the growth mode can be modified in order to promote the formation of micron-sized, triangular islands. The morphology, shape, crystal structure and composition are determined by low-energy electron microscopy and diffraction, and synchrotron based X-ray absorption spectromicroscopy. The element specific XMLD measurements reveal strong antiferromagnetic contrast at room temperature and domains with up to micron sizes, reflecting the high structural quality of the islands. By means of vectorial magnetometry, the spin axis orientation was determined with nanometer spatial resolution, and found to depend on the relative orientation of the film and substrate lattices.
1 Introduction
In recent years the significance of antiferromagnetism for practical applications has been continuously increasing.1–6 The absence of net magnetization makes antiferromagnetic (AF) materials important candidates for extremely rapid spin manipulation and switching since there is no change in angular momentum associated with the order parameter. One of the most promising antiferromagnetic compounds for device applications is NiO. It has been already shown that a thin layer of nickel oxide can be used in spintronic devices to transport a spin current between two layers or to generate radiation with THz frequency in spin-torque nano-oscillators.7–10Nickel oxide is a prototypical room temperature antiferromagnetic insulator. It belongs to the group of 3d binary transition metal oxides whose properties are being studied extensively. Above its Néel temperature (TN = 523 K), nickel oxide possesses a simple crystallographic structure (cubic structure of rocksalt).11,12 Below TN the magnetic order is accompanied by a small rhombohedral distortion (a fraction of 1%) in the [111] direction.13 In various macroscopic regions of the crystal, any one of the four possible directions of type 〈111〉 can become the axis of the rhombohedral distortion. These structural domains, each of which contains its own {111}-type plane, perpendicular to the corresponding rhombohedral distortion, bear the name of twin domains (T).14 The spins of Ni2+ cations are ordered ferromagnetically along [11![[2 with combining macron]](https://www.rsc.org/images/entities/char_0032_0304.gif) ] direction inside a single plane and alternating {111} planes are antiferromagnetically ordered. Each of the three [11
] direction inside a single plane and alternating {111} planes are antiferromagnetically ordered. Each of the three [11![[2 with combining macron]](https://www.rsc.org/images/entities/char_0032_0304.gif) ] spin directions per T domain defines a “spin domain” (S). This results in a total of 12 orientational domains. This type of antiferromagnetic ordering is usually denoted as type-II AF order.15
] spin directions per T domain defines a “spin domain” (S). This results in a total of 12 orientational domains. This type of antiferromagnetic ordering is usually denoted as type-II AF order.15
There is an increasing interest in AFM thin films which can be used in applications. In depth knowledge of the distribution of AFM domains and the possibilities to manipulate it is fundamental in order to design novel devices, as it plays a major role in magnetization dynamics.
In this paper, we report on the direct imaging of the growth process of iron-doped nickel oxide thin films on a non-magnetic substrate, Ru (0001). As first the structural properties are described. Further, a complete spectroscopic analysis employing surface sensitive spectromicroscopy techniques based on X-ray absorption spectroscopy (XAS) and X-ray magnetic linear dichroism (XMLD) allowed for a precise quantification of the composition, element-specific cationic valencies. Finally, combination of X-ray absorption spectroscopy (XAS) with ligand-field multiplet calculations the spin direction within each antiferromagnetic domain was extracted.
2 Experimental method
Experiments were performed at the CIRCE-XPEEM beamline of the Alba Synchrotron Light Facility.16 The microscope can work in a pure Low-Energy Electron Microscopy (LEEM) mode, allowing also diffraction measurements by using micro-spot LEED mode (μLEED). By using synchrotron light it works as an X-ray PhotoEmission Electron Microscope (XPEEM). It allows to acquire images of the energy-filtered photoelectron distribution from micro-sized selected areas of the surface, with an energy resolution below 0.2 eV. The sample is illuminated by incoming photons at an angle of 16° from the surface plane. The sample azimuth relative to the X-ray beam can be changed at will. The kinetic energy of the photoelectrons used to form an image can also be selected. In addition to X-ray Absorption Spectroscopy (XAS) images, dichroic images can be obtained by measuring the pixel-by-pixel asymmetry between images with orthogonal X-ray polarization directions.17,18Fe-Doped nickel oxide films were deposited onto a (0001)-oriented ruthenium single crystal. The method for cleaning the Ru crystal is described elsewhere.19 Fe-doped NiO films were synthesized by oxygen-assisted MBE, i.e., co-depositing Ni and Fe onto Ru at elevated temperature (1150 K) in a molecular oxygen atmosphere (1 × 10⁻⁶ mbar). Nickel and iron dosers were previously calibrated by measuring the time needed to complete a monolayer on the W(110) and Ru(0001) surfaces, respectively. Typical rates used in the experiments were 1.6 × 10⁻³ MLRu per s for Ni and 8.3 × 10⁻⁴ MLRu per s for Fe for a 15![[thin space (1/6-em)]](https://www.rsc.org/images/entities/char_2009.gif) :
:![[thin space (1/6-em)]](https://www.rsc.org/images/entities/char_2009.gif) 1 Ni
1 Ni![[thin space (1/6-em)]](https://www.rsc.org/images/entities/char_2009.gif) :
:![[thin space (1/6-em)]](https://www.rsc.org/images/entities/char_2009.gif) Fe ratio (where 1MLRu is defined as 1.4 × 10¹⁹ atoms per m2).
Fe ratio (where 1MLRu is defined as 1.4 × 10¹⁹ atoms per m2).
Growth was performed during in situ observation by LEEM in order to optimize the growth parameters such as substrate temperature, evaporator flux and oxygen partial pressure. Large 3-dimensional islands were obtained at 1150 K. After the growth process, the sample was cooled down to room temperature in an oxygen atmosphere. The X-ray absorption experiments were typically performed a few days after growth. Before synchrotron measurements, the sample was flashed up to 900 K in 10–6 mbar oxygen atmosphere in order to remove adsorbates while avoiding a possible reduction of the film.
3 Results and discussion
The unique properties of NiO are especially evident in systems of reduced dimensionality, as pointed out in many studies. However, the growth of NiO films is not straightforward. It requires the control at the atomic scale (chemical and structural) of the growth process. As a consequence, a lot of effort has been directed to the fabrication and study of nickel oxide films on different substrates. One monolayer thick nickel oxide films prepared by standard O2-based reactive deposition on various metallic (Ag, Au, Pd, Pt and vicinal Rh) and insulating (MgO) surfaces are the most studied systems.11,20–26In the following, we first discuss the growth process of NiO films onto a Ru (0001) single crystal at high substrate temperature focusing on the effect of Fe doping. The morphology, islands shape and crystallographic structure will be described. Next, we study the chemical and magnetic properties by X-ray absorption spectromicroscopy. Finally, the determination of the spin domains distribution will be presented.
3.1 Growth process and crystal structure
Our first attempts were directed to grow pure nickel oxide films by oxygen-assisted MBE varying the substrate temperature in the range 950 K to RT (not shown here) resulted in flat films formed of nm-sized islands randomly distributed over all the sample surface, as confirmed by ex situ AFM. The results are similar to those already obtained for other metals.20–23 We have found that the substrate temperature does not influence drastically the growth process. In all cases, the growth results in small islands formation, randomly distributed on the sample surface.A substantial modification of the film growth mode requires an appreciable change in the balance of surface and interface free energies. Thus, in the following we opted for introducing an additional element in order to adjust the growth mode. Fig. 1 presents selected frames acquired during the growth process of Fe-doped NiO. We deposit nickel and iron on Ru(0001) at elevated temperature (1150 K) while exposing to molecular oxygen. As a first step the bare substrate is exposed to molecular oxygen which adsorbs on the Ru crystal forming a 2D atomic oxygen gas and increasing the work function of Ru around 0.8 eV. A LEEM image of the substrate just after opening the shutters is shown in Fig. 1b. Many nuclei decorate the step bunches around large atomic terraces and further grow forming μm-sized triangular 3-dimensional but flat islands (Fig. 1c and d). It was already shown previously that the growth of mixed nickel-cobalt oxides on Ru(0001) follows the same growth mode – Volmer–Weber, where starting from single nuclei 3-dimensional islands grow. As in the case of NiFe2O418 Co1−xO,27 iron doped nickel oxide islands present a triangular shape with two opposite orientations. Additionally, some triangular islands rotated 30° were found.
A small amount of Fe added during the growth process thus flattens the films and leads to the formation of several micron wide islands, with much larger structural and magnetic domains than growth by other methods, as will be shown later. This means that iron atoms behave as a surfactant that changes the balance of surface and interface free energy of the overlayer.28
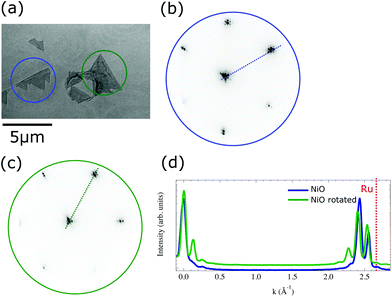
The surface structure was studied by microspot low-energy electron diffraction. An area selected for LEED measurement is shown in Fig. 2a. We have found two types of triangular islands rotated 30° relative to each other. The diffraction patterns of each island type are presented in Fig. 2b and c. The two islands marked in Fig. 2a present hexagonal patterns aligned (blue) with the Ru(0001) lattice and rotated (green) by 30°, respectively. The additional closely spaced satellite spots are similar to those observed for nickel ferrite19 or magnetite,29 arising from the so-called bi-phase reconstruction. Based on the LEED pattern we can estimate the lattice spacing for each island type. The lattice spacing for the island aligned with the Ru (0001) is 0.295 ± 0.1 nm, slightly larger than the ruthenium one (0.27 nm) while the reconstruction corresponds to a periodicity of 5.2 ± 0.1 nm. The rotated hexagonal pattern and related reconstruction show slightly larger atomic distances 0.31 ± 0.1 nm and 5.5 ± 0.1 nm, respectively. Cross sectional cuts along the satellite spots at the (b) non-rotated (blue) and (c) rotated island (green), compared to the ruthenium spot distance (red dashed line) are shown in Fig. 2d. The difference in the lattice spacing between both islands can be estimated from the cross-sectional profiles. The in-plane lattice spacing for the (111)-oriented rock-salt phase should be 0.29 nm for bulk NiO, in good agreement with the observed values. Thus, we identify the triangular islands as NiO in (111) orientation.
Growth aligned with the Ru lattice is strongly favored, 95% of the islands have this orientation. In the case of the rotated island, the Ni atoms are aligned along the direction that joins two in-plane, second nearest neighbours of Ru (1![[2 with combining macron]](https://www.rsc.org/images/entities/char_0032_0304.gif) 1). The bulk value for this second nearest neighbours distance is 0.467 nm, thus the mismatch is much larger in this case. Nevertheless, it is accommodated by a similar atomic arrangement as the majority islands, resulting in a superstructure with similar periodicity.
1). The bulk value for this second nearest neighbours distance is 0.467 nm, thus the mismatch is much larger in this case. Nevertheless, it is accommodated by a similar atomic arrangement as the majority islands, resulting in a superstructure with similar periodicity.
The island thickness can be estimated measuring the shadows observed in the XPEEM images. Such images are acquired by collecting secondary electrons emitted by the sample upon photon irradiation. The photons are impinging on the sample at a polar angle 16°, and thus if the islands are thick enough they will create a shadow. In the case of the island shown in Fig. 2a, the average height is around 25 nm.
3.2 Chemical analysis by X-ray absorption spectromicroscopy
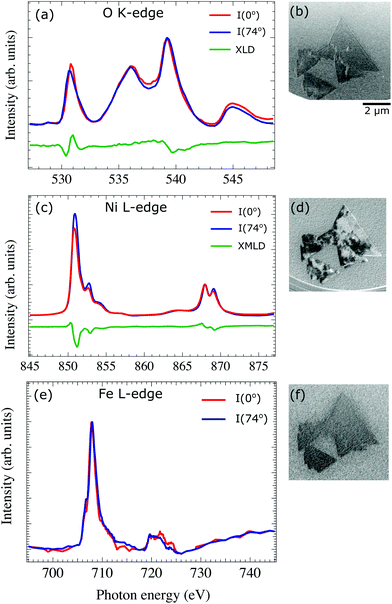
To determine the chemical and magnetic properties of the Fe-doped nickel oxide films we have acquired polarization dependent XAS-PEEM image stacks. XAS images at the Ni, Fe – L3, L2 and O K edges from selected areas on the surface are presented in Fig. 3b, d and f. The spectra are acquired for both linear horizontal (θ = 0°) and vertical (θ = 74°) polarizations (where θ is the angle between the surface and the electric field vector of the incoming photons). The difference, named XLD (X-ray Linear Dichroism) measures the charge anisotropy related to both local crystal field and local exchange field (via spin–orbit coupling). In the latter case it is termed X-ray Magnetic Linear Dichroism (XMLD).The local O K-edge XAS spectra for both polarizations together with the difference signals are shown in Fig. 3a. The oxygen XAS spectrum is the same as the one obtained from a clean NiO(001) surface.30 It has a characteristic three peak structure, and the dichroic spectrum shows a substantial signal at a photon energy around 531 eV.30 In the NiO crystal, each O atom is surrounded by six Ni atoms. The direction of the magnetic moments of three of the Ni atoms is opposite to that of the other three, so that the oxygen atoms in NiO crystal should not have any net magnetic moment. Thus, the signal observed at the O dichroic spectra is not due to any magnetic effect but rather it is caused by the crystal distortion and allows to study the structural domains distribution (T-domains).31 In Fe-doped NiO films the observed XLD contrast at the O edge is very weak (Fig. 3b) which can be explained by taking into account that the rhombohedral distortion in the NiO crystal is along the 〈111〉 AF ordering direction, i.e., perpendicular to our films.
The Ni L3,2 spectra are presented in Fig. 3c. They present a typical double-peak structure at both L3 and L2 edges, characteristic for Ni2+ in an octahedral crystal field.11,32 The XMLD spectrum measured as the difference between two local absorption spectra from a single domain area with linear horizontal and vertical X-ray polarization presents a significant dichroic signal at both edges. The general line shape of the spectra is similar to that of pure NiO films and of bulk NiO.32
The XAS spectra at the Fe L-edge (Fig. 3e) are similar to the one observed for FeO with a small shoulder at the L3 edge. However, the small Fe amount results in spectra too noisy for the unambiguous detection of a dichroic signal from a single domain and for fully excluding small contributions from Fe3+.33
According to the XAS spectra, the chemical identity of the islands is confirmed to be FexNi1−xO. In order to estimate the ratio between Ni and Fe we have measured the edge jump of the XAS spectra, which is proportional to the number of absorbing atoms and linear absorption coefficient. The absorption coefficient for both elements (at the L3 peak) is similar. By direct comparison of the edge jump intensities at the Ni and Fe XAS spectra, a Ni![[thin space (1/6-em)]](https://www.rsc.org/images/entities/char_2009.gif) :
:![[thin space (1/6-em)]](https://www.rsc.org/images/entities/char_2009.gif) Fe ratio close to 15
Fe ratio close to 15![[thin space (1/6-em)]](https://www.rsc.org/images/entities/char_2009.gif) :
:![[thin space (1/6-em)]](https://www.rsc.org/images/entities/char_2009.gif) 1 is found, with an error of around 10%. Thus, the islands contain about 5% iron.
1 is found, with an error of around 10%. Thus, the islands contain about 5% iron.
3.3 Distribution of antiferromagnetic domains
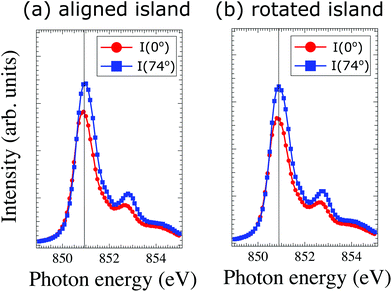
One way to probe whether the observed dichroic signal (Fig. 3) is due to antiferromagnetic ordering or crystal-field effect, is to compare the energy of the main L3 component for both linear horizontal and vertical photon polarizations34 white lines position between θ = 0° and θ = 74° for the two types of islands found on the sample. Close ups look of this region for both types of island are shown in Fig. 4. Within the experimental resolution (0.08 eV) no shift is observed, which is an indication that rather than a crystal field effect, the contrast observed in the XMLD PEEM images is antiferromagnetic.
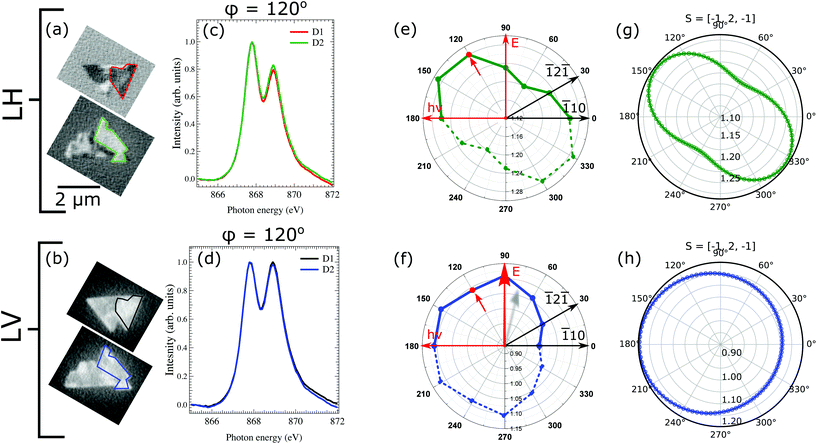
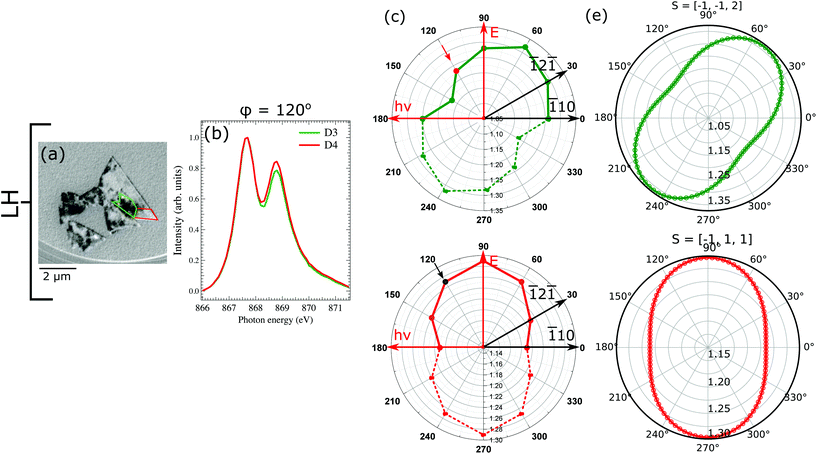
To extract the information about the spin-axis orientation in the Fe-doped NiO films, we exploited the XMLD at the Ni L2 edge, calculating the L2 peak ratio, as the intensity of the low-energy peak (A) divided by the intensity of the high-energy (B) peak R = I(A)/I(B), after subtraction of a linear background.36 The spectra of the NiO L2 peak were acquired at both linear horizontal and vertical polarizations at different azimuthal angle (ϕ = 0–180°, where ϕ = 0° defines the direction when the incoming photon beam is parallel to the triangular island edge and hence parallel to the [1![[1 with combining macron]](https://www.rsc.org/images/entities/char_0031_0304.gif) 0] direction), for a given domain set of the non-rotated islands.
0] direction), for a given domain set of the non-rotated islands.
Since the XMLD is generally anisotropic, the contrast obtained from the L2 double peak ratio is proportional to 〈M2〉 if and only if the crystal symmetry is spherical. In the general case, a complicated dependence of the XAS shape on the orientation of S and E with respect to the crystal lattice will result. For Fe-NiO, we have to deal with Oh symmetry since the islands are crystalline, cubic with uniform orientation.
In order to find the spin-axis orientation in our in situ grown Fe-NiO films we have compared the experimental XMLD contrast with the theoretical one, derived from the model described by I. Krug.38 According to that model an X-ray absorption spectrum for arbitrary polarization E and spin direction S can be calculated using the following equation:
 | (1) |
![[small epsilon, Greek, circumflex]](https://www.rsc.org/images/entities/i_char_e107.gif) the dielectric tensor in cubic symmetry. Since the XMLD in NiO is anisotropic, the dielectric tensor takes the form:
the dielectric tensor in cubic symmetry. Since the XMLD in NiO is anisotropic, the dielectric tensor takes the form: | (2) |
Once we have all the necessary prerequisites for a detailed interpretation of the magnetic contrast, we turn now our attention to the experimental results. In the following we will consider each type of islands separately.
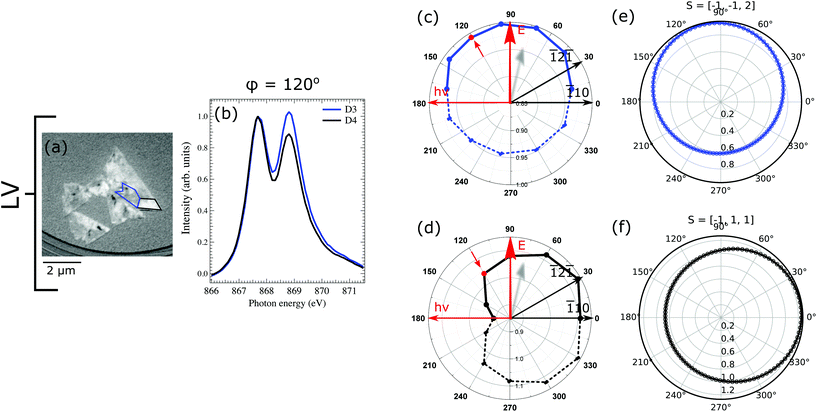
In order to find the spin-axis within each island, we have compared the experimental XMLD contrast for both photon polarizations to the theoretical spectra. The L2 ratio for example for LH geometry is calculated for a given spin direction (e.g. NiO bulk spin-axis) by rotating the E-vector around an arbitrary direction. In our case we rotate the E-vector around the [111] direction as we have (111)-oriented islands. In Fig. 5g and h the theoretical L2 ratio for LH and LV polarized geometry is plotted. It is immediately clear that the simple cos(E,S)-dependence is not valid in the general case.
It can be seen that the L2 ratio calculated for one of the bulk NiO spin axis [![[1 with combining macron]](https://www.rsc.org/images/entities/char_0031_0304.gif) 2
2![[1 with combining macron]](https://www.rsc.org/images/entities/char_0031_0304.gif) ] is in good agreement with the data obtained experimentally: both the overall shape of the L2 ratio vs. azimuthal angle and the ratio values are in close agreement. For the LV contrast, the analysis outcome is similar. The L2 ratio found experimentally is close to 1 which indicates reduced dichroism. The same values were found theoretically. Hence, it can be finally concluded that the spin axes of the Fe-doped NiO islands is preferentially oriented in the (111) plane, along the [
] is in good agreement with the data obtained experimentally: both the overall shape of the L2 ratio vs. azimuthal angle and the ratio values are in close agreement. For the LV contrast, the analysis outcome is similar. The L2 ratio found experimentally is close to 1 which indicates reduced dichroism. The same values were found theoretically. Hence, it can be finally concluded that the spin axes of the Fe-doped NiO islands is preferentially oriented in the (111) plane, along the [![[1 with combining macron]](https://www.rsc.org/images/entities/char_0031_0304.gif) 2
2![[1 with combining macron]](https://www.rsc.org/images/entities/char_0031_0304.gif) ] directions of bulk NiO.
] directions of bulk NiO.
We will first consider the LH geometry. We have chosen two regions on the sample (marked in colors), where the XMLD contrast is different. The region marked in green (D3) presents strong dichroic contrast, while the one in red (D4) has negligible dichroism. From each regions we have acquired the L2 edge spectra at different azimuthal angles ϕ (Fig. 6c and d). Note that the XMLD contrast variation for D3 with respect to the D4 suggests that the spin-axis of both domains point indifferent directions. We calculated the theoretical value of L2, for extremal spin-axis orientations with respect to the rotation plane (111), i.e. parallel or perpendicular and found that the best agreement with our experimental data is achieved when the spin-axis of D3 lies in-plane, in the [![[1 with combining macron]](https://www.rsc.org/images/entities/char_0031_0304.gif)
![[1 with combining macron]](https://www.rsc.org/images/entities/char_0031_0304.gif) 2] direction, whereas for D4 it is pointed along the [
2] direction, whereas for D4 it is pointed along the [![[1 with combining macron]](https://www.rsc.org/images/entities/char_0031_0304.gif) 11] direction, which is tilted about 70° with respect to the (111) plane.
11] direction, which is tilted about 70° with respect to the (111) plane.
In the XMLD images acquired with vertical photon polarization (Fig. 7a), it can be noticed that the D3 and D4 domains have reversed contrast with respect to the images with horizontal polarization. Domain D3 marked in blue presents a gray contrast with the value of L2 ratio close to 1, while domain D4 with high L2 ratio (1.14) is considerably brighter. This strong contrast observed with vertical photon polarization gives another hint that the spin-axis actually points along one of the out-of-plane directions. To check the validity of this observation we have calculated the value of L2 ratio for vertical geometry for the spin-axis previously used. Our findings are in a good agreement with the experimental results and hence confirm that the rotated island hosts two sets of domains: in-plane pointing along [![[1 with combining macron]](https://www.rsc.org/images/entities/char_0031_0304.gif)
![[1 with combining macron]](https://www.rsc.org/images/entities/char_0031_0304.gif) 2] and out-of-plane along [
2] and out-of-plane along [![[1 with combining macron]](https://www.rsc.org/images/entities/char_0031_0304.gif) 11] directions.
11] directions.
On the one hand the existence of long-range antiferromagnetic ordering in the surface plane with {![[1 with combining macron]](https://www.rsc.org/images/entities/char_0031_0304.gif)
![[1 with combining macron]](https://www.rsc.org/images/entities/char_0031_0304.gif) 2} spin direction shows that in our in situ grown Fe-doped NiO films the spin-axis is the same as for bulk NiO. But on the other hand for rotated islands we also find domains with a different spin direction, including an out-of-plane component. The exact origin of the additional out-of-plane contrast is not totally clear. We could relate the observed [
2} spin direction shows that in our in situ grown Fe-doped NiO films the spin-axis is the same as for bulk NiO. But on the other hand for rotated islands we also find domains with a different spin direction, including an out-of-plane component. The exact origin of the additional out-of-plane contrast is not totally clear. We could relate the observed [![[1 with combining macron]](https://www.rsc.org/images/entities/char_0031_0304.gif) 11] direction to one of the twin domains in NiO. But then we should observe the same contrast at the oxygen K edge, which is not the case. In addition, strain could play a role in the rotated islands, which present an in-plane lattice constant larger than that of bulk NiO by almost 7%. Further work is necessary in order to fully understand the origin of the spin axis in the rotated islands.42
11] direction to one of the twin domains in NiO. But then we should observe the same contrast at the oxygen K edge, which is not the case. In addition, strain could play a role in the rotated islands, which present an in-plane lattice constant larger than that of bulk NiO by almost 7%. Further work is necessary in order to fully understand the origin of the spin axis in the rotated islands.42
4 Conclusion
In summary, Fe-doped NiO films have been grown on Ru(0001) by high-temperature oxygen-assisted molecular beam epitaxy. We have found that a small amount of Fe changes drastically the growth mode. Instead of the small, grainy islands observed for pure nickel oxide, the formation of micrometric islands is promoted. The structures are easily recognized by their triangular shape and they coexist with a few minority islands rotated 30° with respect to the Ru axes. The structural characterization performed with LEEM and μ-LEED confirms two types of triangular islands with (111) orientation. Chemical states of surface cations Fe2+ and Ni2+ were identified by X-ray absorption spectromicroscopy. Thus, the growth at high temperature leads to the formation of a Fe-doped nickel oxide phase as expected from the phase diagram. The element specific XMLD measurements reveal large antiferromagnetic domains at room temperature. The spin axis orientation has been extracted applying vectorial magnetometry. We found that the spin-axis orientation, in the islands aligned with the Ru axes, is along {![[1 with combining macron]](https://www.rsc.org/images/entities/char_0031_0304.gif)
![[1 with combining macron]](https://www.rsc.org/images/entities/char_0031_0304.gif) 2} directions, whereas the rotated islands additionally present domains with out-of-plane contrast, which according to the vectorial magnetometry stems from the spin-axis pointing along [
2} directions, whereas the rotated islands additionally present domains with out-of-plane contrast, which according to the vectorial magnetometry stems from the spin-axis pointing along [![[1 with combining macron]](https://www.rsc.org/images/entities/char_0031_0304.gif) 11]. Thus, the small Fe content behaves as a surfactant but does not strongly influence the properties of in situ grown NiO films on Ru for the majority of the micron-islands and could thus be used in devices requiring high structural quality and flat NiO structures. The origin of the unexpected out-of-plane contrast in some rotated islands domains could be strain, although more experiments have to be performed to fully understand it. The growth and analysis method employed here provide an excellent starting point for study of novel spin phenomena in NiO thin films. We found that the spin axis orientation is mostly in plane, along the {
11]. Thus, the small Fe content behaves as a surfactant but does not strongly influence the properties of in situ grown NiO films on Ru for the majority of the micron-islands and could thus be used in devices requiring high structural quality and flat NiO structures. The origin of the unexpected out-of-plane contrast in some rotated islands domains could be strain, although more experiments have to be performed to fully understand it. The growth and analysis method employed here provide an excellent starting point for study of novel spin phenomena in NiO thin films. We found that the spin axis orientation is mostly in plane, along the {![[1 with combining macron]](https://www.rsc.org/images/entities/char_0031_0304.gif)
![[1 with combining macron]](https://www.rsc.org/images/entities/char_0031_0304.gif) 2} directions, but it depends on the relative orientation of the NiO lattice with respect to the Ru substrate.
2} directions, but it depends on the relative orientation of the NiO lattice with respect to the Ru substrate.
Author contributions
A.M., G.S., J.E.P, M.F., J.F. and L.A. conducted the experiments. A.M. analysed the results and lead the manuscript writing with contributions from all the authors. All authors reviewed the manuscript.Conflicts of interest
The authors declare no competing interests.Acknowledgements
This work is supported by the Spanish Agencia Estatal de Investigación (AEI) through Projects No. MAT2015-64110-C2-1-P, MAT2015-64110-C2-2-P, RTI2018-095303-B-C51, and RTI2018-095303-B-C53, by the European Commission through Project H2020 No. 720853 (Amphibian) and by the Comunidad de Madrid through Project. NANOMAGCOST-CM P2018/NMT-4321. These experiments were performed at the CIRCE beamline of the ALBA Synchrotron Light Facility. A. M. acknowledges funding via a CSIC-Alba agreement.References
- P. Němec, M. Fiebig, T. Kampfrath and A. V. Kimel, Nat. Phys., 2018, 14, 229–241 Search PubMed.
- X. Marti, I. Fina, C. Frontera, J. Liu, P. Wadley, Q. He, R. J. Paull, J. D. Clarkson, J. Kudrnovský, I. Turek, J. Kuneš, D. Yi, J.-H. Chu, C. T. Nelson, L. You, E. Arenholz, S. Salahuddin, J. Fontcuberta, T. Jungwirth and R. Ramesh, Nat. Mater., 2014, 13, 367 CrossRef CAS.
- V. Baltz, A. Manchon, M. Tsoi, T. Moriyama, T. Ono and Y. Tserkovnyak, Rev. Mod. Phys., 2018, 90, 015005 CrossRef CAS.
- J. Železný, P. Wadley, K. Olejník, A. Hoffmann and H. Ohno, Nat. Phys., 2018, 14, 220–228 Search PubMed.
- R. A. Duine, K.-J. Lee, S. S. P. Parkin and M. D. Stiles, Nat. Phys., 2018, 14, 217–219 Search PubMed.
- V.-Q. Le, T.-H. Do, J. R. D. Retamal, P.-W. Shao, Y.-H. Lai, W.-W. Wu, J.-H. He, Y.-L. Chueh and Y.-H. Chu, Nano Energy, 2019, 56, 322–329 Search PubMed.
- C. Hahn, G. de Loubens, V. V. Naletov, J. B. Youssef, O. Klein and M. Viret, Europhys. Lett., 2014, 108, 57005 CrossRef.
- H. Wang, C. Du, P. C. Hammel and F. Yang, Phys. Rev. B: Condens. Matter Mater. Phys., 2015, 91, 220410 CrossRef.
- W. Lin, K. Chen, S. Zhang and C. L. Chien, Phys. Rev. Lett., 2016, 116, 186601 CrossRef.
- H. Wang, C. Du, P. C. Hammel and F. Yang, Phys. Rev. Lett., 2014, 113, 097202 CrossRef.
- D. Alders, L. H. Tjeng, F. C. Voogt, T. Hibma, G. A. Sawatzky, C. T. Chen, J. Vogel, M. Sacchi and S. Iacobucci, Phys. Rev. B: Condens. Matter Mater. Phys., 1998, 57, 11623–11631 CrossRef CAS.
- W. L. Roth, Phys. Rev., 1958, 110, 1333–1341 CrossRef CAS.
- M. Finazzi and S. Altieri, Phys. Rev. B: Condens. Matter Mater. Phys., 2003, 68, 054420 CrossRef.
- V. S. Mandel, J. Cryst. Growth, 1997, 174, 346–353 CrossRef CAS.
- J. Baruchel, M. Schlenker, K. Kurosawa and S. Saito, Philos. Mag. B, 1981, 43, 853–860 CAS.
- L. Aballe, M. Foerster, E. Pellegrin, J. Nicolas and S. Ferrer, J. Synchrotron Radiat., 2015, 22, 745–752 CrossRef CAS.
- J. Stöhr, H. A. Padmore, S. Anders, T. Stammler and M. R. Scheinfein, Surf. Rev. Lett., 1998, 05, 1297–1308 CrossRef.
- A. Scholl, H. Ohldag, F. Nolting, J. Stöhr and H. A. Padmore, Rev. Sci. Instrum., 2002, 73, 1362–1366 CrossRef CAS.
- A. Mandziak, J. de la Figuera, S. Ruiz-Gómez, G. D. Soria, L. Pérez, P. Prieto, A. Quesada, M. Foerster and L. Aballe, Sci. Rep., 2018, 8, 17980 CrossRef.
- S. D. Peacor and T. Hibma, Surf. Sci., 1994, 301, 11–18 CrossRef CAS.
- A. Rota, S. Altieri and S. Valeri, Phys. Rev. B: Condens. Matter Mater. Phys., 2009, 79, 161401 CrossRef.
- J. Wollschläger, D. Erdös, H. Goldbach, R. Höpken and K. M. Schröder, Thin Solid Films, 2001, 400, 1–8 CrossRef.
- C. Giovanardi, A. di Bona and S. Valeri, Phys. Rev. B: Condens. Matter Mater. Phys., 2004, 69, 075418 CrossRef.
- C. Hagendorf, R. Shantyr, H. Neddermeyer and W. Widdra, Phys. Chem. Chem. Phys., 2006, 8, 1575–1583 RSC.
- G. Parteder, F. Allegretti, M. Wagner, M. G. Ramsey, S. Surnev and F. P. Netzer, J. Phys. Chem. C, 2008, 112, 19272–19278 CrossRef CAS.
- S. Agnoli, M. Sambi, G. Granozzi, J. Schoiswohl, S. Surnev, F. P. Netzer, M. Ferrero, A. M. Ferrari and C. Pisani, J. Phys. Chem. B, 2005, 109, 17197–17204 CrossRef CAS.
- A. Mandziak, G. D. Soria, J. E. Prieto, P. Prieto, C. Granados-Miralles, A. Quesada, M. Foerster, L. Aballe and J. de la Figuera, Sci. Rep., 2019, 9, 13584 CrossRef.
- M. Copel, M. C. Reuter, E. Kaxiras and R. M. Tromp, Phys. Rev. Lett., 1989, 63, 632–635 CrossRef CAS.
- M. Monti, B. Santos, A. Mascaraque, O. Rodríguez de la Fuente, M. A. Niño, T. O. Menteş, A. Locatelli, K. F. McCarty, J. F. Marco and J. de la Figuera, Phys. Rev. B: Condens. Matter Mater. Phys., 2012, 85, 020404 CrossRef.
- H. Ohldag, G. van der Laan and E. Arenholz, Phys. Rev. B: Condens. Matter Mater. Phys., 2009, 79, 052403 CrossRef.
- T. Kinoshita, T. Wakita, H. Sun, T. Tohyama, A. Harasawa, H. Kiwata, F. Ulrich Hillebrecht, K. Ono, T. Matsushima, M. Oshima, N. Ueno and T. Okuda, J. Phys. Soc. Jpn., 2004, 73, 2932–2935 CrossRef CAS.
- G. van der Laan, N. D. Telling, A. Potenza, S. S. Dhesi and E. Arenholz, Phys. Rev. B: Condens. Matter Mater. Phys., 2011, 83, 064409 CrossRef.
- P. S. Miedema and F. M. de Groot, J. Electron Spectrosc. Relat. Phenom., 2013, 187, 32–48 CrossRef CAS.
- M. W. Haverkort, S. I. Csiszar, Z. Hu, S. Altieri, A. Tanaka, H. H. Hsieh, H.-J. Lin, C. T. Chen, T. Hibma and L. H. Tjeng, Phys. Rev. B: Condens. Matter Mater. Phys., 2004, 69, 020408 CrossRef.
- T. Hibma and M. W. Haverkort, Magnetic Properties of Antiferromagnetic Oxide Materials: Antiferromagnetic Oxide Films on Nonmagnetic Substrates, John Wiley & Sons, Ltd, 2010, vol. 4, pp. 99-142 Search PubMed.
- I. P. Krug, F. U. Hillebrecht, M. W. Haverkort, A. Tanaka, L. H. Tjeng, H. Gomonay, A. Fraile-Rodríguez, F. Nolting, S. Cramm and C. M. Schneider, Phys. Rev. B: Condens. Matter Mater. Phys., 2008, 78, 064427 CrossRef.
- M. W. Haverkort, N. Hollmann, I. P. Krug and A. Tanaka, Phys. Rev. B: Condens. Matter Mater. Phys., 2010, 82, 094403 CrossRef.
- I. Krug, Buchhandelsausgabe u.d.T.: Krug, Ingo Peter: Magnetic Proximity Effects in Highly-ordered Transition Metal Oxide Heterosystems - A Study by Soft-X-Ray Photoemission Microscopy, 2008 Search PubMed.
- M. Retegan, Crispy: v0.7.3, 2019, DOI:10.5281/zenodo.1008184.
- Y. Lu, M. Höppner, O. Gunnarsson and M. W. Haverkort, Phys. Rev. B: Condens. Matter Mater. Phys., 2014, 90, 085102 CrossRef.
- I. P. Krug, F. U. Hillebrecht, H. Gomonaj, M. W. Haverkort, A. Tanaka, L. H. Tjeng and C. M. Schneider, EPL, 2007, 81, 17005 CrossRef.
- I. P. Krug , private communication.
Footnote |
| † The C4 direction is one of the fourfold high-symmetry directions given by the point group and they are assumed to be x, y, z directions. |
| This journal is © The Royal Society of Chemistry 2020 |


