
 Open Access Article
 This Open Access Article is licensed under a Creative Commons Attribution-Non Commercial 3.0 Unported Licence
Time-resolved MIET measurements of blood platelet spreading and adhesion†
Anna
Zelená
a,
Sebastian
Isbaner
 b,
Daja
Ruhlandt
b,
Anna
Chizhik
b,
Chiara
Cassini
a,
Andrey S.
Klymchenko
c,
Jörg
Enderlein
b,
Alexey
Chizhik
b and
Sarah
Köster
*ade
b,
Daja
Ruhlandt
b,
Anna
Chizhik
b,
Chiara
Cassini
a,
Andrey S.
Klymchenko
c,
Jörg
Enderlein
b,
Alexey
Chizhik
b and
Sarah
Köster
*ade
aInstitute for X-Ray Physics, University of Göttingen, Friedrich-Hund-Platz 1, 37077 Göttingen, Germany. E-mail: sarah.koester@phys.uni-goettingen.de; Fax: +49 (0)551/39 29430; Tel: +49 (0)551/39 29429
bThird Institute of Physics – Biophysics, University of Göttingen, Friedrich-Hund-Platz 1, 37077 Göttingen, Germany
cLaboratoire de Biophotonique et Pathologies, UMR 7021 CNRS, Université de Strasbourg, Faculté de Pharmacie, 74, Route du Rhin, Illkirch 67401 Cedex, France
dGerman Center for Cardiovascular Research (DZHK), Partner Site Göttingen, Germany
eCluster of Excellence “Multiscale Bioimaging: from Molecular Machines to Networks of Excitable Cells” (MBExC), University of Goettingen, Germany
First published on 7th October 2020
Abstract
Human blood platelets are non-nucleated fragments of megakaryocytes and of high importance for early hemostasis. To form a blood clot, platelets adhere to the blood vessel wall, spread and attract other platelets. Despite the importance for biomedicine, the exact mechanism of platelet spreading and adhesion to surfaces remains elusive. Here, we employ metal-induced energy transfer (MIET) imaging with a leaflet-specific fluorescent membrane probe to quantitatively determine, with nanometer resolution and in a time-resolved manner, the height profile of the basal and the apical platelet membrane above a rigid substrate during platelet spreading. We observe areas, where the platelet membrane approaches the substrate particularly closely and these areas are stable on a time scale of minutes. Time-resolved MIET measurements reveal distinct behaviors of the outermost rim and the central part of the platelets, respectively. Our findings quantify platelet adhesion and spreading and improve our understanding of early steps in blood clotting. Furthermore, the results of this study demonstrate the potential of MIET for simultaneous imaging of two close-by membranes and thus three-dimensional reconstruction of the cell shape.
Introduction
Blood platelets are small, non-nucleated fragments of megakaryocytes, with a diameter between 2 and 5 μm in the resting state and play a crucial role in early steps of blood clotting.1 During a blood vessel injury, platelets are stimulated by the presence of, e.g., thrombin, adenosine diphosphate (ADP) or serotonin,2 which initiates a shape change in the cells from discoid to spherical, followed by the formation of extended filopodia which initiate the adhesion to a substrate.1–3 The platelet membrane consists of a typical phospholipid bilayer,1 whose surface is covered with a particularly thick (15–20 nm) glycoprotein and glycolipid coat, known as glycocalyx, carrying negative charges. Thus, platelets repel other platelets and blood components.4 Platelets do not divide and lack a microtubule spindle apparatus, however, they do possess an acto-myosin cytoskeleton which promotes adhesion, spreading and contraction5,6 Once a platelet adheres to the substrate, it becomes very flat and its thickness in air-dried conditions reaches from 40 nm for the periphery to 100 nm for the cell center, as measured by scanning electron microscopy (SEM).7 Due to the flattening during platelet spreading, the cell's surface area increases drastically. The necessary additional area is created by unfolding of wrinkled membrane that consists of numerous folds into the platelet interior and is known as the open canalicular system (OCS).8,9Changes in platelet shape during adhesion and spreading have been studied by various methods in order to understand cell–matrix interactions in more detail. Atomic force microscopy (AFM),10 scanning ion-conductance microscopy (SICM)11–14 or hopping probe ion conductance microscopy (HPICM)15 provide a good picture of the shape of the apical membrane and confirm the involvement of the cytoskeleton. However, early stages of spreading are difficult to visualize with these methods as the scanning probe approaches the platelet very closely. Additionally, the basal membrane is typically not accessible. Conventional light microscopy techniques, including fluorescence wide-field and confocal laser scanning microscopy (CLSM), are diffraction limited and thus provide a restricted axial resolution of 1 μm or 500 nm, respectively.16–18 Optical super-resolution methods like stimulated emission depletion (STED) microscopy overcome this limitation, and a combination of STED with 4Pi microscopy, known as isoSTED,19–21 leads to an improvement of the resolution down to <21 nm in axial and 30 nm in lateral direction.22 Thus, the thickness of hydrated, chemically fixed platelets was determined to be 90 nm at the periphery and about 320 nm in the center,23 showing that measurements on air-dried platelets underestimate the thickness of the cells.7 The limitation of current isoSTED applications to platelets is that it cannot easily be used on living cells, and thus, dynamic measurements are difficult to realize.
Living platelets have been characterized by traction force microscopy (TFM).24–26 The heterogeneous force patterns, which dynamically change in time and display “hot spots” of high traction forces, give rise to the question of how the height profile of the membrane with respect to the substrate varies during adhesion and spreading. This question has been addressed using reflection interference contrast microscopy (RICM) on murine platelets.27 The authors used a single monochromatic beam and were able to analyze the data in a semi-quantitative way and thereby distinguish between close contact areas with a distance of ∼40 nm from the substrate, and areas with distances up to 110 nm.27
Metal-induced energy transfer (MIET) imaging is a recently developed method that allows for measurements with nanometer axial resolution within a few hundreds of nanometers above a substrate.28 MIET is based on the modulation of the de-excitation rate of a luminescent molecule to the ground state by the near-field coupling to surface plasmons in a thin metal film deposited on the substrate surface.28 Experimentally, this effect can be measured as a change of the emitter's excited-state lifetime by fluorescence lifetime imaging microscopy (FLIM), which can be directly converted into a distance value. MIET imaging has been applied to cell adhesion studies in the past, including comparatively thick kidney and lung cells, as well as the study of the epithelial-to-mesenchymal transition (EMT).28,29 Dual-color MIET imaging was employed to demonstrate the extremely high resolution of the method by measuring the thickness of the nuclear envelope30 as well as to determine the three-dimensional architecture of stress fibers of human mesenchymal stem cells.31 In all previous cell studies using MIET, thick and slowly adhering cells were studied with the apical membrane located beyond the measurable range of a few hundreds of nanometers from the substrate, thus the focus was on the basal cell membrane. In a very recent study, single-color MIET was used to distinguish the two leaflets of a lipid bilayer spread on graphene and measure its thickness.32
In the present work, we show that MIET imaging complements existing methods for the study of flat (parts of) cells, by visualizing two close-by membranes, i.e. the basal and the apical membrane, of living and highly dynamic platelets. Platelets are particularly thin and thus provide a perfect experimental system to benchmark the abilities of MIET in recording and analyzing data from both membranes simultaneously. We apply two modalities of MIET imaging. First, we characterize the three-dimensional profile of the basal and apical membranes of fully spread, unfixed platelets with nanometer accuracy in the axial direction. We find areas, where the platelet membrane approaches the substrate particularly closely. Second, we characterize the basal membrane-to-substrate distance of platelets while they spread, in a temporally resolved, quantitative manner using a rapid FLIM setup. These time-resolved data show an increased activity of the outermost rim of the platelets and this area stays further apart from the substrate than the inner area. Our results quantify platelet adhesion and spreading in a spatially and temporally resolved manner and thus help to better understand this crucial step in early hemostasis.
Experimental
Platelet purification
Experiments were performed in accordance with the ethical vote of the Ethics Committee of University Medical Center Göttingen, votum 11/11/19. Each human donor had to fulfill specific criteria for medical application with negative history of anti-platelet treatment. The process of platelet purification was described previously.24 Briefly, 4 mL of platelet concentrate were mixed with prostaglandin E1 (PGE1 2.6 μg mL−1, Cayman Chemical Company, Ann Harbor, MI, USA) and centrifuged for 20 min at 480g and 21 °C. The pellet was dissolved in PIPES saline glucose buffer (PSG: 5 mM PIPES, 145 mM NaCl, 5 mM glucose, 4 mM KCl, 1 mM MgCl2, 0.05 mM Na2HPO4, pH 6.8) with PGE1. Note that PGE1 was used during purification to avoid premature platelet activation, but was washed out prior to the experiments. The process was repeated twice. After the third centrifugation step, the pellet was re-suspended in HEPES-Tyrode buffer (HT: 134 mM NaCl, 12 mM NaHCO3, 2.9 mM KCl, 1 mM MgCl2, 5 mM HEPES, 5 mM glucose, 0.34 mM NaH2PO4, pH 7.4) with bovine serum albumin (BSA, 5 mg mL−1, Macs BSA stock solution, Milteny Biotech, Bergisch Gladbach, Germany). The final concentration of the purified platelets was measured in a hematocrit capillary.Membrane staining
The platelet membrane was fluorescently stained with dSQ12S.33 Platelets were purified as described above and diluted to a final concentration of 2 × 10⁷ cells per mL. For free space measurements on glass and rapid FLIM measurements on gold/titanium coated glass bottom Petri dishes (μ-Dish 35 mm diameter, high type, Ibidi GmbH, Martinsried, Germany), the platelets were stained with dSQ12S at a final concentration of 310 nM. The diluted platelets were mixed with the dye and incubated for 5 minutes at 37 °C and 5% CO2. After the incubation, PGE1 was added at a concentration of 2.6 μg mL−1 and the solution was centrifuged at 480g for 5 min at 21 °C to remove residual unbound dye. The supernatant was carefully removed with a pipette and the pellet was re-suspended in HT containing BSA. For static MIET experiments a lower concentration of dye was used (232.5 nM) and the centrifuging step was omitted. Labeled platelets were added to the Petri dish and activated by thrombin (human plasma thrombin, Sigma Aldrich, St Louis, MO, USA; diluted in HT buffer with BSA to final concentration of 0.28 NIH units per mL).MIET imaging
Since the vertical extension of the focus was on the order of a micrometer and we focused on the gold surface, fluorescence was collected simultaneously from the apical and basal cell membrane as shown in Fig. 1a. Assuming that the instrument response function (IRF) is given by IRF(t), for each pixel (x,y) the measured signal I(t|x,y) follows a Poisson distribution with expectation value
| ffull(t|x,y) = IRF(t)★[a(x,y)]·e−t/τ1(x,y) + b(x,y)·e−t/τ2(x,y] + c(x,y) | (1) |
ftail(t|x,y) = ã(x,y)·e−t/τ1(x,y) + ![[b with combining tilde]](https://www.rsc.org/images/entities/i_char_0062_0303.gif) (x,y)·e−t/τ2(x,y) + (x,y)·e−t/τ2(x,y) + ![[c with combining tilde]](https://www.rsc.org/images/entities/i_char_0063_0303.gif) (x,y). (x,y). | (2) |
 | ||
| Fig. 1 (a) Schematic representation of a blood platelet membrane labeled with the fluorescent dye dSQ12S. Light from the basal membrane has a shorter lifetime than light from the apical membrane, because of its close proximity to the gold surface. (b) Fluorescence intensity image of an individual blood platelet taken with the laser focused on the gold surface. (c) Typical TCSPC histogram of a single pixel. The signal from a single pixel shows a complex decay curve (black), which is bi-exponentially fitted (red) to obtain the fluorescence lifetimes for the short (blue) and the long (green) components. (d) Values for the short lifetimes, corresponding to the basal membrane, plotted in a spatially resolved manner. (e) Plot of the long lifetime values, corresponding to the apical membrane. Scale bars correspond to 3 μm. | ||
We typically used a cutoff time of tcutoff = 0.3 ns. The IRF and the cutoff are shown in Fig. S1.† The fit itself employed a Nelder–Mead downhill simplex method35 to minimize the negative log-likelihood
 | (3) |
 | (4) |
Here, the free-space lifetime τ0 is the fluorescence lifetime under identical conditions but in the absence of any metal structures. Similarly, Φ is the free-space quantum yield and S0 is the total amount of energy emitted by the fluorophore per time in free space. When immersed in a medium with refractive index n and assuming a dipole moment p, classical electrodynamics yields S0 = cnk4p2/3, where c is the speed of light and k is the wave vector in vacuum. The total amount of energy emitted per time in the presence of a metal structure depends both on the position and orientation of the fluorophore. A calculation for dipoles oriented in parallel (S∥) or perpendicularly (S⊥) to a planar substrate can be found in ref. 36. The dye dSQ12S employed in this study has been shown to incorporate in parallel to the cell membrane due to its two amphiphilic anchor groups.33 Since the cell membrane is for the most part (almost) parallel to the substrate, we set θ = π/2 in all our calculations.
The free-space lifetime was obtained by measuring labeled cells seeded on untreated Petri dishes, yielding a value of τ0 = (2.6 ± 0.1) ns. The quantum yield of dSQ12S was measured in dimethyl sulfoxide (DMSO) using a nanocavity,38 yielding ΦDMSO = 0.44 and τDMSO = 1.3 ns. As described in ref. 30, the quantum yield value obtained in one medium can be converted to the value in a second medium provided the refractive indices of both media are known and the fluorescence lifetime has also been measured in both media. Then,
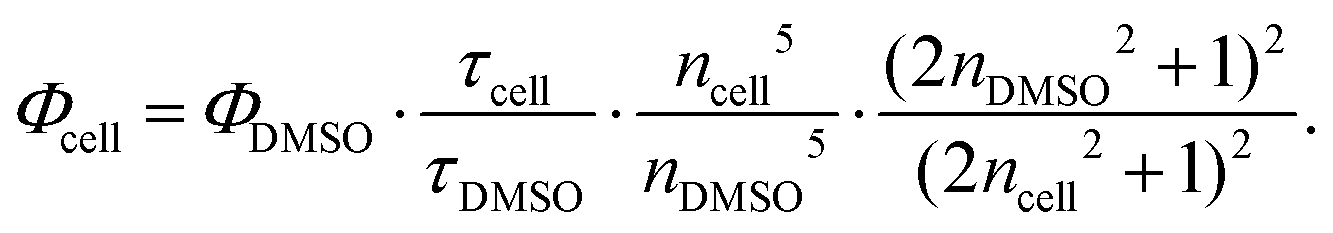 | (5) |
Using this formula, nDMSO = 1.47, ncell = 1.33 and the free space lifetime τcell = τ0 = 2.6 ns, we found Φcell = 0.74. The resulting MIET lifetime-versus-height calibration curve is shown in Fig. 2b. The curve was calculated based on the exact parameters for the metal layers for every sample.
 | ||
| Fig. 2 (a) Histograms of the collected short (blue) and long (red) lifetimes. (b) MIET calibration curve for dSQ12S with the maximum lifetime marked by the green solid line and the free space lifetime marked by the blue dashed line. The height z is measured from the gold surface to the labeled membrane. The blue rectangle marks a part of the curve with a slope of 0 for 89 nm ≤ z ≤ 116 nm. The red part of the MIET curve corresponds to values used for the apical membrane. The blue part corresponds to the basal membrane. The black part of the curve denotes lifetime values not found in our data. (c) Height histogram for the basal (blue) and the apical (red) membrane after conversion using the MIET calibration curve. (d) Three-dimensional height profile of the basal membrane with examples of areas of lower surface-to-membrane distances marked by white arrows. We applied a Gaussian filter (kernel width σ = 1) to the data to reduce image noise. Note that for better visualization, the axial and lateral dimensions are shown on different scales. (e) Cross-sectional line plot through the blood platelet (inset) showing the short and the long lifetime information. Scale bars correspond to 3 μm. | ||
First, temporal binning of 15 frames was performed to obtain intensity images of each dynamic platelet. These images were used for intensity thresholding of a region of interest that contained the platelet only. A morphological erosion with a disk of radius of 500 nm as structuring element was used to separate the rim of the platelet from the inner part. With a second threshold, the high intensity region containing residual membrane and organelles in the center of the platelet was excluded (see Fig. 3e for an example). Note that for the early time points of spreading, the intensity throughout the whole cell was similar and the cell was analyzed as a whole. By contrast, for later times points, differences between the major part of the cell and a high intensity region in the center led to artifacts. Thresholding alone produces holes in the ROIs due to noise and non-uniform brightness of the data. We used Gaussian smoothing before and morphological closing operations after the thresholding steps to obtain ROIs without holes. The first threshold value was determined by a parameter that was scaled by the maximum intensity value in the image. The parameter for the second threshold value was scaled proportionally to the maximum intensity and to the reciprocal of the area of the platelet. These parameters were chosen manually for each platelet and were then kept constant for all images of the respective recording. This approach allowed for a semi-automated, reproducible separation of the three areas.
 | ||
| Fig. 3 (a) Adhesion and spreading of a blood platelet upon stimulation with thrombin. Platelets show very fast dynamic changes as illustrated in the top scheme. The lower image sequence shows data recorded for dSQ12S-labeled cells by rapid FLIM with a scan speed of 3.3 fps (0.3 s per frame). For final analysis and display, 15 sequential images each are added to increase the signal-to-noise ratio. The sequence is modified by binning to 4.5 s per frame. The image at t = 10 min shows the segregation into three regions, the central area (disregarded, blue), the inner area (outlined in red) and the outermost rim of the platelet (outlined in green). The binned image sequence is provided as Movie S1.† Scale bar corresponds to 3 μm. (b) Time-dependent increase of spread area for 6 different cells. Each color denotes a single platelet. The data shown in dark red correspond to the platelet shown in (a) and have been taken at 37 °C, whereas the other data were recorded at room temperature. Open circles denote measured data, solid lines exponential fits. The platelets denoted by the dark blue and light blue data points do not show an exponential area increase and are thus not fitted. (c) Temporal evolution of the converted mean height values of the basal membrane for 6 different platelets. Color coding as in (b). Open circles denote measured data, solid lines exponential fits. (d) Adhesion time constants plotted against spreading time constants for the 4 platelets that could be properly fitted. Color coding as in (b) and (c). (e) Temporal evolution of the basal membrane height for two different regions of the cell shown in a and b, c and d as dark red color. The green data points correspond to the rim of the platelet and the red data points correspond to the inner area of the platelet without the bright central spot. Open circles show experimental data, solid lines exponential fits. | ||
TCSPC curves of all pixels in the ROIs were then summed, corrected for dead-time,34 and fitted with a bi-exponential model as in eqn (1). In contrast to the fitting of the static images, this included the IRF to maximize the number of photons used for the fit. A linear shift of the IRF was included as an additional fit parameter which takes into account the count rate dependent shape of the IRF of our detector. From this fit, the short lifetime was converted into a height using the MIET curve as explained before. The temporal evolution of the height was fitted with an exponential model of the form 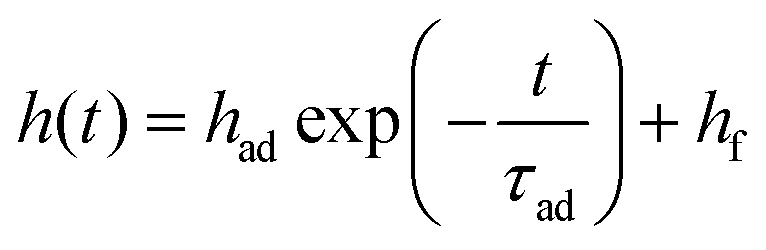 where τad is the adhesion time, had + hf the initial height of the platelet at t = 0, and hf is the final height of the platelet after spreading. Because the number of photons of each lifetime fit is different due to the spreading, bleaching, and occasional refocusing, we took the different errors into account by using a weighted fit. The square root of the number of photons was chosen as the weight of each data point which is a first order approximation of the error of the lifetime fitting and height conversion. The temporal evolution of the area was fitted with an exponential growth model of the form
  where τsp is the spreading time, af − asp is the initial area of the platelet at t = 0, and af is the final area of the platelet after spreading.
Results and discussion
Cell adhesion is governed by dynamic changes in membrane height above the substrate as a function of the lateral dimensions. MIET imaging has been shown to be an excellent tool for investigating biomolecular objects close to surfaces and in particular for studying adherent cells.28,29,31 Most cells are, however, too thick for MIET to detect both the basal and the apical membrane and the investigations are restricted to the basal membrane. Blood platelets are an exception to this rule as they are only a few tens of nanometers thick when fully spread. We thus apply MIET imaging to platelets to investigate the spreading process in detail and in a time-resolved manner and to benchmark MIET imaging as a method to distinguish membranes in close proximity. Our method may also be applicable to thin parts of other cells, such as lamellipodia, axons of neurons, or pili of bacteria.3D reconstruction of the platelet membranes
To investigate the exact height of the platelet membrane with respect to the substrate, and thereby gain information about its 3D profile, we perform static MIET imaging experiments. As the cell membrane is a lipid bilayer with a thickness of a few nanometers, we label specifically one membrane leaflet. For this purpose, we employ the previously developed membrane probe dSQ12S, designed to stain the outer membrane leaflet.33 Platelets labeled with dSQ12S are exposed to the substrate and activated by the addition of thrombin. As a consequence, they adhere and spread. After an incubation time of at least 10 min, FLIM images are recorded, thus characterizing the fully spread state of the platelets. The method provides nanometer resolution in the axial direction and a diffraction limited lateral resolution. As platelets are thinner than other cell types,22,23 in addition to the signal stemming from the dSQ12S probe in the basal membrane, we detect signal emitted by the probe in the apical membrane when recording the fluorescence lifetime. The situation is sketched in Fig. 1a: a platelet with a fluorescently labeled membrane spreads inside a glass bottom Petri dish that is coated with 2 nm of titanium and 15 nm of gold. The presence of the gold layer is crucial for MIET imaging, as it modulates the lifetime of the excited state of the fluorophores via an energy transfer from the fluorophore to the metal film.36 For each platelet, three subsequent images are recorded to increase the total number of detected photons. Additionally, the three individual scans are compared to make sure that the platelet spread area is in steady state and does not considerably change anymore, see Fig. S2.†The fluorescence intensity images of all three scans are added up as shown in Fig. 1b and provide information about the size of the platelet and its location in the field of view, whereas the FLIM data recorded simultaneously provide time correlated single photon counting (TCSPC) histograms, as shown in Fig. 1c, black line, for one typical pixel. TCSPC histograms contain the arrival times of all emitted photons with respect to the incident laser pulse. As mentioned above, in our case, the collected photons stem from both the basal and the apical membrane. We therefore use a bi-exponential decay model to fit the TCSPC histogram, as indicated by the red line in Fig. 1c. From these bi-exponential fits, we obtain both a short lifetime (blue line in Fig. 1c), and a long lifetime (green line) for each individual pixel and present the results as spatial maps in Fig. 1d and e, respectively, or as histograms in Fig. 2a.
By taking into account all basic parameters of the sample, such as refractive index of the buffer, thickness of the metal film and emission spectrum of the dye molecules, we calculate the relation between the fluorescence lifetime of the molecules and their height above the metal film.39 This so-called MIET calibration curve is shown in Fig. 2b. It rises monotonously for the first ∼250 nm, reaching a maximum at zmax = 257 nm and τmax = 2.88 ns. The first minimum after the peak is located at zmin = 384 nm and τmin = 2.44 ns. There is a region with zero slope in the curve between 89 nm ≤ z ≤ 116 nm marked by the blue rectangle, which in principle leads to an ambiguity of assignment between measured lifetime values and inferred height values. However, we find that almost no pixels exhibit lifetime values in this range. The MIET setup, including a high NA objective we use here is sensitive up to 400 nm above the surface and photons from higher values are not detected. We can therefore rule out any further minima in fluorescence lifetime.
With this curve, we convert our recorded lifetimes to height values for both the basal and the apical membrane and plot the results as histograms in Fig. 2c. For the short lifetimes τ1(x,y), this conversion is straightforward as the data lie in the monotonically rising section of the MIET calibration curve, see histogram in Fig. 2c, blue. The resulting map for the example platelet shown in Fig. 1 is shown in Fig. 2d. Fig. S3† shows additional examples of individual platelets. Fig. S4† shows histograms of the distances of the basal membrane to the gold surface for each of the six platelets we analyzed and when averaged, this distance corresponds to 34 ± 4 nm. These results are in agreement with those reported by RICM on murine platelets. The authors observed close contact areas of ∼40 nm above the surface.27 With the assumption that the absence of fibrinogen coating in our case decreases the final height by about 5–8 nm,27,40 our quantitative values confirm the earlier study with high precision. Interestingly, the basal membrane shows areas with a lower membrane-to-substrate distance, as indicated by the white arrows in Fig. 2d. These areas can be better visualized by masking out the heights in the upper tercile of the height distribution of the basal membrane, as detailed in Fig. S3 and S5.† For the six platelets considered here, the average height of the first and second tercile is 29 ± 1 nm; the average height of the upper tercile is 43 ± 1 nm. Although it is unclear if such a modulation in height of the basal membrane would also occur in platelets spreading on soft substrates, there may be an analogy to TFM data on platelets that revealed hot spots of increased force in certain distinct positions of the platelet adhesion area.25 These force hot spots and the areas of closer substrate adhesion may be related or co-localized, indicated by their stability in time.
For the long lifetimes τ2(x,y), we follow a two-step approach for obtaining a complete height profile map. First, looking at the MIET data, we realize that for some pixels we obtain lifetimes that are longer than τmax. This observation becomes obvious in the cross-section shown in Fig. 2e, red line, and can be explained by the uncertainty associated with fitting lifetime data from TCSPC curves. Indeed, the shape of the MIET calibration curve does not allow for directly determining the height values for lifetimes higher than τmin = 2.44 ns. The reason is the maximum at zmax with a decaying curve for higher z-values and the corresponding ambiguity, i.e. two possible height values for one measured lifetime value. As mentioned above, photons from above 400 nm do not get detected by our MIET setup. Second, we set our results in relation to literature data. If we assume the lower of the two height values, < zmax, to be true, the mean height of the analyzable pixels of the apical membrane is 209 nm, as shown in the histogram in Fig. 2c, red. The lifetimes corresponding to the apical membrane increase from the rim to the center and show a “dip” in the center of the cell, as demonstrated in the long lifetime plot in Fig. 1e and in the cross-section in Fig. 2e (red). Assuming the lower of the two possible heights, this dip would directly transfer to a decreased platelet height in the center of the cell, which is in contradiction to published data, in particular SEM, AFM and SICM results1,10,11,15 that by contrast show an increased height of the apical membrane in the center of the platelet. We can therefore safely assume that the real height values in the cell center lie all the way to the right of the MIET calibration curve, i.e. right of the maximum τmax. The fact that the lifetime values in the center of the cell are never lower than τmin supports this hypothesis. According to this line of arguments, in the example shown in Fig. 1 and 2, where the central region of the apical membrane reaches a mean lifetime of 2.76 ± 0.04 ns, we obtain a height of ∼298 nm. Subtracting the height of the lower membrane (30 nm in this example), we obtain a thickness at the cell center of ∼268 nm. This is in agreement with results from isoSTED measurements, where similar blood platelet thicknesses were found,22,23 however, our data are taken on unfixed, living platelets. A detailed knowledge of the thickness and 3D shape of cells is very helpful, e.g., when studying them in (micro)flow conditions or for understanding platelet-platelet interactions.
Rapid MIET imaging
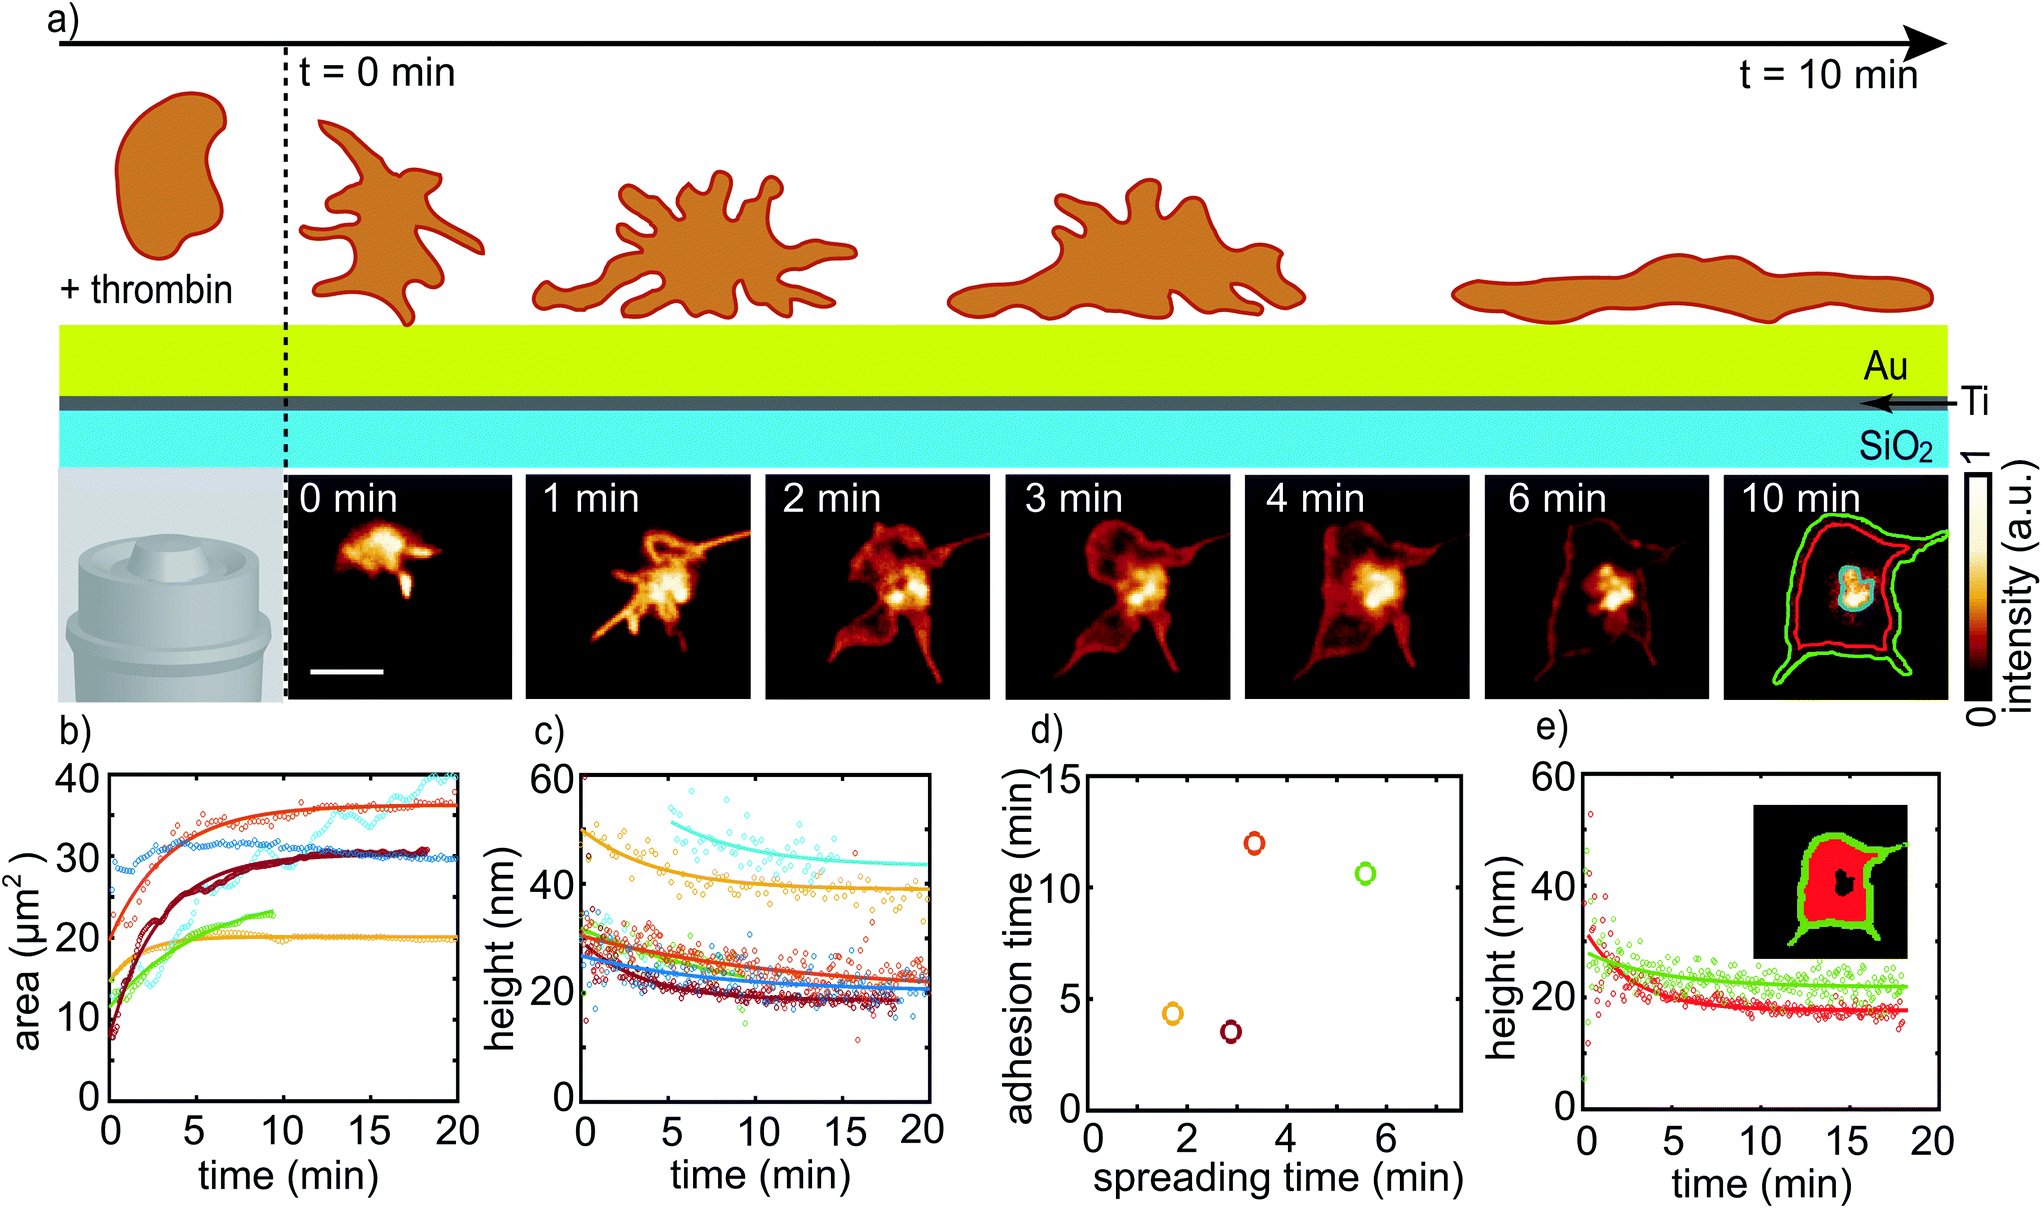
Platelets are extremely dynamic cells and spread within a few minutes.6,24,25,27,41 Thus, we apply a fast scanning MIET mode to follow the spreading process in a time-resolved manner. This approach allows us to investigate the dynamic process with a temporal resolution of 3.3 fps, which we decrease by binning to 0.2 fps (4.5 s per frame). Thus, we obtain a good compromise between the spreading speed of the cells and the number of photons necessary for MIET imaging.An illustration of the spreading process is shown in Fig. 3a, top, together with a typical image sequence between t = 0 min and t = 10 min (bottom). For most cells investigated here the platelet area does not change considerably at later times points. t = 0 min denotes the starting point of the scanning. The exact time between activation by thrombin and t = 0 min is variable and depends on how fast the adhering platelet is localized and the microscope focused. Once we identify a platelet in its initial spreading state, we start to scan a small area of 10 × 10 μm2 and wait for the platelet to fully adhere. The final spread area of approximately 30 μm2 for the example shown in Fig. 3a is reached with a time constant of 2.88 min as shown in Fig. 3b. The area data sets are fitted by an exponential growth function to obtain the spread time for each platelet and the time constants vary between 2 and 6 min as shown in Fig. 3d (x-axis). We exclude the dark and light blue curves from this analysis; for the dark blue curve, the recording started only after the spreading process had already begun and extended filopodia affected the initial area. In the case of the light blue curve, the area is influenced by extending and retracting filopodia during the whole spreading time. The data curve shown in dark red denotes the increasing area of the platelet presented in Fig. 3a. These data were recorded at 37 °C. The additional 5 data sets were recorded at room temperature and we observe no difference in platelet behavior, although the comparatively short spreading time may be due to the increased temperature. We include only platelets in the analysis that adhere to the substrate and spread via lamellipodia.41 Our observed spreading times agree well with earlier studies.6,24,25,27,41
For the example shown in Fig. 3a and ESI S1,† at the beginning of the spreading process, between t = 0 min and t = 1 min, we observe long, thin filopodia, which seem to search the substrate for optimal adhesion. These filopodia then increase in number and elongate. Between t = 2 min and t = 3 min, the filopodia start to expand laterally. As the platelet flattens, the filopodia are replaced by a thin lamellipodium centered around a bright spot. Such behavior is seen for all platelets considered in this work. This observation is in agreement with previous work, where platelets first form filopodia which are then transformed into lamellipodia, in particular if they spread on structured substrates41 or if the substrate is coated with low-density fibrinogen.27,42
For further height analysis, the platelet spread area is split into separate regions as visualized in Fig. 3a at t = 10 min. The very bright emission in the cell center is likely linked to internalization of the membrane probe by endocytosis, as it was observed for a Nile Red analogue of dSQ12S.43 For the reconstruction of our data, the signal from this region introduces artifacts and we thus exclude it from the analysis of later time points. For earlier points the intensity of the whole platelet is comparable and thus does not interfere with our analysis. TCSPC histograms of the remaining pixels are added and fitted with a bi-exponential decay. The short lifetime is converted into the height of basal membrane with help of a MIET calibration curve like the one shown in Fig. 2b and plots of height against time are shown in Fig. 3c for 6 different platelets. Each color indicates an individual cell with the same color coding as for Fig. 3b. We observe a decrease of the basal membrane height over time, which indicates that the basal membrane of the platelet more closely approaches the metal surface as the spreading process proceeds. For the early time points, in some cases, it is impossible to distinguish between the contribution from the apical and the basal membrane as the membranes are not spread and unfolded yet. The data at later time points are fitted by an exponential decay function. The adhesion time constants vary between 3 to 12 min, and are thus larger than but in the same range as the spreading time constants of area increase. In Fig. 3d, we show adhesion times (y-axis, from Fig. 3c) plotted against spreading times (x-axis, from Fig. 3b). The platelet data shown in dark and light blue are omitted as we do not obtain a spreading time for those.
From Movie S1† it is evident that the rim of the platelet shows a higher level of activity than the central area. The morphological activity was previously described for thrombin-activated platelets using SICM.14 In order to investigate the basal membrane activity, the platelet is segmented into two regions, as shown in Fig. 3a for t = 10 min and Fig. 3e, inset. The data in Fig. 3e and Movie S2† show that the inner area of the platelet (red) starts off higher, but then reaches a lower height than the rim (green). As discussed in the SICM study in ref. 14, the reason might be that the rim has a higher activity compared to the rest of the platelet body.
Conclusions
Typical mammalian cells are several micrometers thick28,29 and extend well past the focal depth of a few hundreds of nanometers accessible by MIET imaging. Therefore, in previous studies it was safe to assume that all signal originated from the basal membrane of the cells under investigation. We show that single-color MIET imaging with a leaflet-specific fluorescent membrane probe allows for disentangling the contributions from the basal and apical membrane and obtaining accurate height profiles for the basal membrane. Even the apical membrane can be reconstructed when taking into account additional information gained by other methods. Thus, we are able to reconstruct the platelet shape in 3D. Whereas we applied the method to a particularly thin cell type, it may also be used to study flat parts of other cells, e.g. lamellipodia, axons or pili.Apart from demonstrating the capability of single-color MIET imaging for distinguishing close-by membrane structures, our study quantifies platelet adhesion and spreading in a temporally and spatially resolved manner. Thus, we determine the three-dimensional structure of the basal membrane and find areas that are particularly close to the substrate and we speculate that they could be colocalized with force hot spots observed previously in traction force microscopy experiments.25 The application of rapid MIET imaging to living cells allows us to distinguish the temporal evolution of adhesion for the very active outermost rim of the platelets and the central part that comes closer to the substrate as the platelet spreads.
This rapid MIET imaging mode, in particular, could well be applied to the study of other dynamic cell systems and in general the intracellular machinery which regulates cell spreading and adhesion, including intergins, signaling molecules and receptors. In this respect, it would be very interesting to study platelets from patients with bleeding disorders such as Glanzmann's thrombasthenia. By combining MIET with other super-resolution microscopy techniques, future prospects of our research could be extended to imaging distinct molecules simultaneously with the membrane. This option is becoming more feasible thanks to the development of new fluorescent dyes that will allow us to label specific molecules in non-nucleated platelets.
Conflicts of interest
There are no conflicts to declare.Acknowledgements
We thank J. Hanke for help with preliminary experiments, J. C. Thiele for help with the analysis software and N. Karedla for help with building the rapid FLIM setup, and the University Medical Center Göttingen, in particular T. Legler and J. Riggert, for providing the platelet concentrates. This work was funded by the German Research Foundation (DFG) in the framework of SFB 937, project A12 and A14 and under Germany's Excellence Strategy - EXC 2067/1-390729940. The work was further financially supported by the European Research Council (ERC, Grant No. CoG 724932).References
- A. D. Michelson, Platelets, Academic Press, Amsterdam, Boston, 3rd edn, 2013 Search PubMed.
- D. Blockmans, H. Deckmyn and J. Vermylen, Blood Rev., 1995, 9, 143–156 CrossRef CAS.
- J. C. Loftus and R. M. Albrecht, J. Cell Biol., 1984, 99, 822–829 CrossRef CAS.
- O. Behnke, J. Ultrastruct. Res., 1968, 24, 51–69 CrossRef CAS.
- B. Diagouraga, A. Grichine, A. Fertin, J. Wang, S. Khochbin and K. Sadoul, J. Cell Biol., 2014, 204, 177–185 CrossRef CAS.
- A. K. Paknikar, B. Eltzner and S. Köster, Prog. Biophys. Mol. Biol., 2019, 144, 166–176 CrossRef CAS.
- S. W. Hui and J. L. Costa, J. Microsc., 1979, 115, 203–206 CrossRef CAS.
- H. van Nispen tot Pannerden, F. de Haas, W. Geerts, G. Posthuma, S. van Dijk and H. F. G. Heijnen, Blood, 2010, 116, 1147–1156 CrossRef CAS.
- I. D. Pokrovskaya, M. A. Aronova, J. A. Kamykowski, A. A. Prince, J. D. Hoyne, G. N. Calco, B. C. Kuo, Q. He, R. D. Leapman and B. Storrie, J. Thromb. Haemostasis, 2016, 14, 572–584 CrossRef CAS.
- M. Fritz, M. Radmacher and H. Gaub, Biophys. J., 1994, 66, 1328–1334 CrossRef CAS.
- Z. Yanjun, X. Liu, L. Liu, A.-M. Zaske, Z. Zhou, Y. Fu, X. Yang, J. Conyers, M. Li, Y. Zhang, J. Dong and J. Zhang, Thromb. Haemostasis, 2013, 110, 331–399 CrossRef.
- J. Rheinlaender, S. Vogel, J. Seifert, M. Schächtele, O. Borst, F. Lang, M. Gawaz and T. E. Schäffer, Thromb. Haemostasis, 2015, 113, 305–311 CrossRef.
- M.-J. Kraus, J. Seifert, E. F. Strasser, M. Gawaz, T. E. Schäffer and J. Rheinlaender, Platelets, 2016, 27, 541–546 CrossRef CAS.
- J. Seifert, J. Rheinlaender, F. Lang, M. Gawaz and T. E. Schäffer, Sci. Rep., 2017, 7, 4810 CrossRef.
- X. Liu, Y. Li, H. Zhu, Z. Zhao, Y. Zhou, A.-M. Zaske, L. Liu, M. Li, H. Lu, W. Liu, J.-F. Dong, J. Zhang and Y. Zhang, Platelets, 2014, 26, 480–485 CrossRef.
- R. Heintzmann and G. Ficz, Briefings Funct. Genomics Proteomics, 2006, 5, 289–301 CrossRef.
- L. Schermelleh, R. Heintzmann and H. Leonhardt, J. Cell Biol., 2010, 190, 165–175 CrossRef CAS.
- L. MacDonald, G. Baldini and B. Storrie, Membrane Trafficking, Springer, New York, 2014, pp. 255–275 Search PubMed.
- R. Schmidt, C. A. Wurm, S. Jakobs, J. Engelhardt, A. Egner and S. W. Hell, Nat. Methods, 2008, 5, 539–544 CrossRef CAS.
- S. W. Hell, R. Schmidt and A. Egner, Nat. Photonics, 2009, 3, 381–387 CrossRef CAS.
- R. Schmidt, C. A. Wurm, A. Punge, A. Egner, S. Jakobs and S. W. Hell, Nano Lett., 2009, 9, 2508–2510 CrossRef CAS.
- D. Aquino, A. Schönle, C. Geisler, C. V. Middendorff, C. A. Wurm, Y. Okamura, T. Lang, S. W. Hell and A. Egner, Nat. Methods, 2011, 8, 353–359 CrossRef CAS.
- Y. Okamura, R. Schmidt, I. Raschke, M. Hintze, S. Takeoka, A. Egner and T. Lang, Biophys. J., 2011, 100, 1855–1863 CrossRef CAS.
- S. S. Henriques, R. Sandmann, A. Strate and S. Köster, J. Cell Sci., 2012, 125, 3914–3920 CrossRef CAS.
- J. Hanke, D. Probst, A. Zemel, U. S. Schwarz and S. Köster, Soft Matter, 2018, 14, 6571–6581 RSC.
- J. Hanke, C. Ranke, E. Perego and S. Köster, Soft Matter, 2019, 15, 2009–2019 RSC.
- D. Lee, K. P. Fong, M. R. King, L. F. Brass and D. A. Hammer, Biophys. J., 2012, 102, 472–482 CrossRef CAS.
- A. I. Chizhik, J. Rother, I. Gregor, A. Janshoff and J. Enderlein, Nat. Photonics, 2014, 8, 124 CrossRef CAS.
- T. Baronsky, D. Ruhlandt, B. R. Brückner, J. Schäfer, N. Karedla, S. Isbaner, D. Hähnel, I. Gregor, J. Enderlein and A. Janshoff, et al. , Nano Lett., 2017, 17, 3320–3326 CrossRef CAS.
- A. M. Chizhik, D. Ruhlandt, J. Pfaff, N. Karedla, A. I. Chizhik, I. Gregor, R. H. Kehlenbach and J. Enderlein, ACS Nano, 2017, 11, 11839–11846 CrossRef CAS.
- A. M. Chizhik, C. Wollnik, D. Ruhlandt, N. Karedla, A. I. Chizhik, L. Hauke, D. Hähnel, I. Gregor, J. Enderlein and F. Rehfeldt, Mol. Biol. Cell, 2018, 29, 846–851 CrossRef CAS.
- A. Ghosh, A. Sharma, A. I. Chizhik, S. Isbaner, D. Ruhlandt, R. Tsukanov, I. Gregor, N. Karedla and J. Enderlein, Nat. Photonics, 2019, 13, 860–865 CrossRef CAS.
- M. Collot, R. Kreder, A. L. Tatarets, L. D. Patsenker, Y. Mely and A. S. Klymchenko, Chem. Commun., 2015, 51, 17136–17139 RSC.
- S. Isbaner, N. Karedla, D. Ruhlandt, S. C. Stein, A. Chizhik, I. Gregor and J. Enderlein, Opt. Express, 2016, 24, 9429–9445 CrossRef.
- J. A. Nelder and R. Mead, Comput. J., 1965, 7, 308–313 CrossRef.
- J. Enderlein, Chem. Phys., 1999, 247, 1–9 CrossRef CAS.
- N. Karedla, A. I. Chizhik, I. Gregor, A. M. Chizhik, O. Schulz and J. Enderlein, ChemPhysChem, 2014, 15, 705–711 CrossRef CAS.
- A. I. Chizhik, I. Gregor, B. Ernst and J. Enderlein, ChemPhysChem, 2013, 14, 505–513 CrossRef CAS.
- N. Karedla, Single-Molecule Metal-Induced Energy Transfer, Springer International Publishing, 2017 Search PubMed.
- I. S. Yermolenko, O. V. Gorkun, A. Fuhrmann, N. P. Podolnikova, V. K. Lishko, S. P. Oshkadyerov, S. T. Lord, R. Ros and T. P. Ugarova, J. Biol. Chem., 2012, 287, 41979–41990 CrossRef CAS.
- R. Sandmann and S. Köster, Sci. Rep., 2016, 6, 22357 CrossRef CAS.
- M. Jiroušková, J. K. Jaiswal and B. S. Coller, Blood, 2007, 109, 5260–5269 CrossRef.
- Z. Darwich, A. S. Klymchenko, D. Dujardin and Y. Mély, RSC Adv., 2014, 4, 8481–8488 RSC.
Footnote |
| † Electronic supplementary information (ESI) available: Supplementary figures and supplementary movies. See DOI: 10.1039/D0NR05611A |
| This journal is © The Royal Society of Chemistry 2020 |