
 Open Access Article
 This Open Access Article is licensed under a Creative Commons Attribution-Non Commercial 3.0 Unported Licence
Graphene oxide sheets and quantum dots inhibit α-synuclein amyloid formation by different mechanisms†
Marziyeh
Ghaeidamini
,
David
Bernson
 *,
Nima
Sasanian
,
Ranjeet
Kumar
and
Elin K.
Esbjörner
*
*,
Nima
Sasanian
,
Ranjeet
Kumar
and
Elin K.
Esbjörner
*
Division of Chemical Biology, Department of Biology and Biological Engineering, Chalmers University of Technology, Kemivägen 10, S-412 96 Gothenburg, Sweden. E-mail: david.bernson@chalmers.se; eline@chalmers.se
First published on 15th September 2020
Abstract
Aggregation and amyloid formation of the 140-residue presynaptic and intrinsically disordered protein α-synuclein (α-syn) is a pathological hallmark of Parkinson's disease (PD). Understanding how α-syn forms amyloid fibrils, and investigations of agents that can prevent their formation is therefore important. We demonstrate herein that two types of graphene oxide nanoparticles (sheets and quantum dots) inhibit α-syn amyloid formation by different mechanisms mediated via differential interactions with both monomers and fibrils. We have used thioflavin-T fluorescence assays and kinetic analysis, circular dichroism, dynamic light scattering, fluorescence spectroscopy and atomic force microscopy to asses the kinetic nature and efficiency of this inhibitory effect. We show that the two types of graphene oxide nanoparticles alter the morphology of α-syn fibrils, disrupting their interfilament assembly and the resulting aggregates therefore consist of single protofilaments. Our results further show that graphene oxide sheets reduce the aggregation rate of α-syn primarily by sequestering of monomers, thereby preventing primary nucleation and elongation. Graphene quantum dots, on the other hand, interact less avidly with both monomers and fibrils. Their aggregation inhibitory effect is primarily related to adsorption of aggregated species and reduction of secondary processes, and they can thus not fully prevent aggregation. This fine-tuned and differential effect of graphene nanoparticles on amyloid formation shows that rational design of these nanomaterials has great potential in engineering materials that interact with specific molecular events in the amyloid fibril formation process. The findings also provide new insight into the molecular interplay between amyloidogenic proteins and graphene-based nanomaterials in general, and opens up their potential use as agents to manipulate fibril formation.
Introduction
Multiple age-related human disorders, including Parkinson's and Alzheimer's disease are pathologically associated with the self-assembly of disease-specific proteins into highly stable and β-sheet rich amyloid fibrils.1,2 Strategies to modulate or interfere with the amyloid formation processes guided by an increasingly detailed understanding of the underlying aggregation mechanisms is therefore an important step towards the development of new treatments.3,4Parkinson's disease (PD), is a neurodegenerative disease characterised by degeneration of dopaminergic neurons, leading to muscle rigidity, bradykinesia and resting tremor, followed by cognitive impairment at the later stages of the disease.5 A main pathological hallmark of PD is the accumulation of Lewy bodies in dopaminergic neurons. Lewy bodies are intracellular inclusions containing amyloid fibrils formed by α-synuclein (α-syn), a 140-residue presynaptic protein.6,7 α-syn, while being highly stable in its monomeric form under physiological pH conditions in vitro, readily self-assembles into amyloid fibrils if destabilised by for example low pH,8 orbital shaking,9 air–water interfaces,10 or destabilising missense mutations.11 Amyloid fibrils of α-syn, as well as of other amyloidogenic proteins, form by self-polymerization reactions that involve primary as well as secondary nucleation reactions together with fibril elongation (monomer addition to fibril ends).12 This results in the formation of mature fibrils, but also in the generation of intermediate species, so-called oligomers, which are often cytotoxic13 and with exposed hydrophobic regions.14 The aggregation of α-syn and other amyloidogenic proteins can be inhibited by a wide range of biological and pharmacological modifiers, including small molecules,15–17 lipid membranes,18,19 functional polymers,20 peptides,21 protein chaperones,22,23 and antibodies.24,25 Aggregation inhibition is indeed one of the most common targets of Parkinson's disease-modifying therapies currently in clinical trials.26 Nanomaterials are being increasingly explored in this context, and materials such as gold nanoparticles, magnetic nanoparticles, graphene oxide, graphene quantum dots, carbon nanotubes, and fullerene have been shown to effectively modulate and suppress fibrillation of proteins such as amyloid-β, insulin and islet amyloidogenic polypeptide (IAPP).27–31 However, it is also frequently reported that nanoparticles catalyse protein aggregation,32–34 suggesting that their presence in the body could contribute to neurotoxicity.35 In some investigations, carbon-based nanomaterials also appear to promote amyloid fibril formation, indicating protein specificity as well as fine-tuned importance of the exact physical properties and chemical modifications resulting from the synthesis method used; graphene-based materials can for example vary significantly with respect to size, shape, thickness, and surface charge.29,36 Studies of how amyloid proteins interact with different nanomaterials in their monomeric form, as well as during the aggregation process, are therefore important to mechanistically understand their function and towards realizing their putative therapeutic potential.
Graphene-based water soluble nanoparticles, including graphene oxide (GO) sheets and graphene quantum dots (GQD) have received considerable recent attention for their potential use in various biomedical applications including gene delivery,37 tumour treatment,38 photodynamic therapy,39 antibacterial materials,40 cellular imaging38,41 and biosensing.38 In addition, they act as effective inhibitors of the in vitro aggregation of full length and fragmented forms of the Alzheimer-associated amyloid-β peptide29,42–44 and also the diabetes-associated human islet amyloid polypeptide.45,46 Two recent studies have shown that various functionalised graphene nanoparticles inhibit and disaggregate α-synuclein fibrils, resulting in the prevention of α-syn pathology in a mouse model of Parkinson's disease.47,48 This biophysical study follows up on these findings and explores, from a kinetic and mechanistic perspective, the different inhibitory effects of GO sheets and GQD nanoparticles obtained via direct carbonization of citric acid. We report that subtle modification of the surface chemistry and dimensionality of these graphene nanomaterials can tune not only the rate of the protein aggregation reaction, but also the mechanism by which inhibition occurs and the structure and morphology of the ensuing aggregates. The results provide deepened insights into the aggregation modulatory function of graphene-based nanomaterials that may be relevant for their future putative therapeutic potential.
Experimental
Synthesis and characterization of Graphene oxide (GO) and Graphene quantum dot (GQD) nanoparticles
Water-soluble graphene oxide (GO) and graphene quantum dot (GQD) nanoparticles were prepared via direct carbonization and polymerization of citric acid (CA, Sigma Aldrich) through pyrolysis treatment in an inert atmosphere, following the procedures described by Dong et al.49 Briefly, 1 g of CA was added into a 5 mL flask and heated to 200 °C. This resulted in liquidation of the CA and a colour change from transparent to pale yellow, and then orange within 30 minutes due to the formation of GQDs. Upon keeping the reaction mixture at this temperature for 2 hours, the orange liquid transformed into a black solid suggesting the formation of GO. Finally, the GQD and GO nanoparticles were neutralized with 1 M NaOH (Sigma Aldrich, St Louis, MO, USA) under stirring and subjected to 1 hour of sonication in an ultrasonic bath. The materials were stored at room temperature until further characterization and use. The functional groups of GO and GQD were characterized by FTIR spectroscopy using a Shimadzu FTIR1650 spectrophotometer (Shimadzu Corp., Tokyo, Japan) to collect spectra in the 500–4000 cm−1 range, following sample preparation in KBr.α-Synuclein expression and purification
Wild type α-synuclein (α-syn, 14.4 kDa, 140 residues) was expressed in E. coli and purified as previously described.50 The α-syn-carrying plasmid was transformed into E. coli BL21 (DE3) by the calcium heat-shock method, and protein expression was induced by IPTG. The bacterial lysate was then heated at 90 °C for 10 min followed by centrifugation for 30 min at 15![[thin space (1/6-em)]](https://www.rsc.org/images/entities/char_2009.gif) 000g. The centrifuged lysate was filtered (Nalgene rapid-flow filter, 0.2 μm PES membrane; Thermo Fisher Scientific, Waltham, MA, USA), loaded onto a pre-equilibrated 5 mL HiTrap Q FF anion exchange column (GE Healthcare, Chicago, IL, USA) and eluted by a linear gradient of 1 M NaCl in 20 mM Tris-HCl, pH 8.0. Fractions containing α-syn were combined and concentrated with Ultra-15 Ultracel 10 K centrifugal filter devices (Millipore, Burlington, MA, USA). The concentrate was injected on to a HiLoad 16/600 Superdex 75 pg column (GE Healthcare, Chicago, IL, USA) and eluted with 20 mM Tris-HCl buffer, pH 7.4. Fractions containing monomeric a-syn were identified by a single-band on SDS-PAGE and a single elution peak in SEC. To calculate protein concentrations, the extinction coefficient of 5960 M−1 cm−1 at 280 nm for α-syn was used. Protein samples were snap-frozen in liquid N2 and stored at −80 °C until use. Prior to each biophysical experiment, monomeric α-syn was purified by size exclusion chromatography to obtain a pure monomer fraction. This is important to obtain reproducible amyloid formation kinetics that are free from artefacts due to preformed seeds in the starting solution.51 For this, α-syn was injected onto a Superdex 75 GL 10/300 gel filtration column (GH Healthcare, Uppsala, Sweden), and eluted using 0.8 mL min−1 of a 25 mM Tris-HCl buffer with 150 mM NaCl, pH 7.5; highly pure and monomeric α-syn was obtained (Fig. S1†). The protein concentration was determined by integrating the area under the collected peak or by measuring the UV-vis absorption on a CARY 50 UV-Vis absorption spectrometer (Agilent Technologies, Santa Clara, CA, US), using a quartz cuvette with 10 mm pathlength (Hellma, Mullheim, Germany).
000g. The centrifuged lysate was filtered (Nalgene rapid-flow filter, 0.2 μm PES membrane; Thermo Fisher Scientific, Waltham, MA, USA), loaded onto a pre-equilibrated 5 mL HiTrap Q FF anion exchange column (GE Healthcare, Chicago, IL, USA) and eluted by a linear gradient of 1 M NaCl in 20 mM Tris-HCl, pH 8.0. Fractions containing α-syn were combined and concentrated with Ultra-15 Ultracel 10 K centrifugal filter devices (Millipore, Burlington, MA, USA). The concentrate was injected on to a HiLoad 16/600 Superdex 75 pg column (GE Healthcare, Chicago, IL, USA) and eluted with 20 mM Tris-HCl buffer, pH 7.4. Fractions containing monomeric a-syn were identified by a single-band on SDS-PAGE and a single elution peak in SEC. To calculate protein concentrations, the extinction coefficient of 5960 M−1 cm−1 at 280 nm for α-syn was used. Protein samples were snap-frozen in liquid N2 and stored at −80 °C until use. Prior to each biophysical experiment, monomeric α-syn was purified by size exclusion chromatography to obtain a pure monomer fraction. This is important to obtain reproducible amyloid formation kinetics that are free from artefacts due to preformed seeds in the starting solution.51 For this, α-syn was injected onto a Superdex 75 GL 10/300 gel filtration column (GH Healthcare, Uppsala, Sweden), and eluted using 0.8 mL min−1 of a 25 mM Tris-HCl buffer with 150 mM NaCl, pH 7.5; highly pure and monomeric α-syn was obtained (Fig. S1†). The protein concentration was determined by integrating the area under the collected peak or by measuring the UV-vis absorption on a CARY 50 UV-Vis absorption spectrometer (Agilent Technologies, Santa Clara, CA, US), using a quartz cuvette with 10 mm pathlength (Hellma, Mullheim, Germany).
Thioflavin-T monitored amyloid formation kinetics
SEC-purified α-syn monomers were added to the wells of 96-well black half-area microtiter plates with transparent bottom (Corning Inc., Corning, NY, USA, #3881) and supplemented with Thioflavin-T (ThT) (Sigma Aldrich, St Louis, MO, USA) to final concentrations of 50 μM α-syn and 20 μM ThT, in a 25 mM Tris-HCl buffer (pH 7.5) with 150 mM NaCl. The total sample volume in each well was 80 μL. A 2 mm glass bead was added to each well as previously described,52,53 and the plates were sealed with plastic film (BIO-RAD, Hercules, CA, USA) to avoid sample evaporation. The effects of GO and GQD on α-syn aggregation were assayed by addition of 0–200 μg mL−1 of the nanoparticles. All experiments were performed in triplicate and repeated at least three times. ThT fluorescence was recorded by a Fluostar OPTIMA or Fluostar OMEGA fluorescence plate reader (BMG Labtech, Ortenberg, Germany) at 37 °C in 10-minute intervals for up to 166 h under shaking conditions (300 rpm, 5 min before each read-out). The ThT fluorescence was read with bottom optics using a 440 ± 10 nm bandpass filter for excitation and a 490 ± 10 nm bandpass filter for emission. The resulting kinetic traces were analysed in terms of lag-time, half-time and maximum slope. The lag-time was defined as the time at which the fibril mass fraction (as determined by ThT emission) reached 0.1. The slope was defined as the slope of a linear equation fitted to the data between fibril mass fraction 0.3–0.7, and the half-time was computed by setting y = 0.5 for the same linear equation.Fluorescence spectroscopy
Steady-state fluorescence spectra were recorded using a Varian Eclipse fluorimeter (Agilent Technologies, Santa Clara, CA, USA) and a quartz micro-cuvette with 60 μL sample volume and 3 mm path length, (Hellma Analytics, Mullheim, Germany). Intrinsic α-synuclein fluorescence (emanating from tyrosines) was measured in the 290–540 nm range upon excitation at 280 nm.Circular dichroism (CD) spectroscopy
CD spectra were recorded between 190–280 nm on Jasco J-810 CD spectropolarimeter (Jasco, Tokyo, Japan) using a quartz cell with 1 mm pathlength (Hellma Micro Absorption Cuvettes Z800015). The scan speed was set to 50 nm min−1 and the response time was 0.5 seconds. 5 successive spectra were recorded and averaged by the computer. All spectra were corrected for background contributions by subtracting appropriate buffer blanks. All experiments were performed at room temperature.Atomic force microscopy (AFM)
AFM samples were prepared by depositing 10 μL solution onto freshly cleaved mica, followed by 15 min incubation to allow fibrils to settle on the surface. The mica surfaces were thereafter rinsed 5 times with triple-distilled Milli-Q water and dried under a gentle stream of nitrogen gas. Images were obtained using an NTEGRA Prima (NT-MDT, Moscow, Russia) setup equipped with a gold-coated single crystal silicon cantilever (NT-MDT, NSG01) with a resonance frequency of 150 kHz in tapping-mode. Images were recorded in 512 × 512 pixels, at a 0.5 Hz scan rate and then processed using the Gwyddion software package by polynomial background subtraction followed by planar subtraction and adjustment of linear aberrations.54 Individual fibril lengths were measured manually using Gwyddion. For measuring fibril heights, the height profile of each fibril was measured perpendicularly to the fibril axis, and the associated mica background was subtracted using Gwyddion.Dynamic light scattering (DLS) and Zeta potential
DLS measurements were carried out on a Zetasizer nano (Malvern Panalytical Ltd, Malvern, UK) at room temperature using plastic cuvettes. The zeta potential of GO and GQD nanoparticles were also measured on the Zetasizer nano at room temperature at a concentration of 100 μg mL−1.Results and discussion
Characterization of graphene oxide (GO) and graphene quantum dot (GQD) nanoparticles
The chemical and physical properties of the GO and GQD nanoparticles were analysed by a combination of FTIR, UV-Vis absorption spectroscopy, DLS, and AFM (Fig. 1). The FTIR spectra in Fig. 1A and B show that both GO and GQD nanoparticles exhibit infra-red absorption from carboxyl (peaks due to C![[double bond, length as m-dash]](https://www.rsc.org/images/entities/char_e001.gif) O at 1721 cm−1) and hydroxyl groups (O–H stretching vibrations in a broad band at ∼3500 cm−1 and O–H bending vibrations at 1419 cm−1), consistent with their solubility in water.49 The existence of C–H in GQD is confirmed by presence of an absorption band at 2967 cm−1 (Fig. 1B). Additionally, the GO nanoparticles show absorption in the C–O stretching vibration band (1296 cm−1) that are not present in GQD; this suggests presence of epoxide groups on its surface and is consistent with that complete carbonization of citric acid has taken place.49 The carbonization of citric acid and formation of graphite structure were further confirmed by the presence of a peak of the 002 plane ranging at 2θ from 15 to 40° in X-ray powder diffraction (XRD) (ESI Fig. S2†). The GQD nanoparticles display characteristic visible light absorption in a narrow band centred at 359 nm (ref. 49) (Fig. 1D); the exact position of this band has been suggested to be sensitive to the size and shape of GQDs.55 The GO nanoparticles, by contrast, display broad and unspecific absorption (Fig. 1C) in the visible range, consistent with previous reports.49 Dynamic light scattering (DLS) was used to determine the hydrodynamic diameter of the GO and GQD nanoparticles. The intensity averaged size distributions of GO and GQD (Fig. 1E and F) show that our synthesis method, followed by sonication, yields monodisperse nanoparticle preparations with average diameters of 314 ± 50 nm and 65 ± 10 nm for GO and GQD respectively. It was also confirmed that both GO and GQD nanoparticles exhibit excitation-dependent photoluminescence (ESI Fig. S3†) in accord with previous reports.49 The particle height, as measured by AFM, (Fig. 1G and H) was approximately 1.5 nm for both particle preparations, which is in agreement with other reports, but likely an overestimation due to water adlayers between the graphene sheet and the mica surface.56 The zeta potential of the GO and GQD nanoparticles was determined to −38 mV and −8 mV respectively, indicating differences in their surface-exposed functional groups. The measured zeta potential values agree well with those reported by others,57 further supporting the synthesis of typical GO and GQD nanoparticles.
O at 1721 cm−1) and hydroxyl groups (O–H stretching vibrations in a broad band at ∼3500 cm−1 and O–H bending vibrations at 1419 cm−1), consistent with their solubility in water.49 The existence of C–H in GQD is confirmed by presence of an absorption band at 2967 cm−1 (Fig. 1B). Additionally, the GO nanoparticles show absorption in the C–O stretching vibration band (1296 cm−1) that are not present in GQD; this suggests presence of epoxide groups on its surface and is consistent with that complete carbonization of citric acid has taken place.49 The carbonization of citric acid and formation of graphite structure were further confirmed by the presence of a peak of the 002 plane ranging at 2θ from 15 to 40° in X-ray powder diffraction (XRD) (ESI Fig. S2†). The GQD nanoparticles display characteristic visible light absorption in a narrow band centred at 359 nm (ref. 49) (Fig. 1D); the exact position of this band has been suggested to be sensitive to the size and shape of GQDs.55 The GO nanoparticles, by contrast, display broad and unspecific absorption (Fig. 1C) in the visible range, consistent with previous reports.49 Dynamic light scattering (DLS) was used to determine the hydrodynamic diameter of the GO and GQD nanoparticles. The intensity averaged size distributions of GO and GQD (Fig. 1E and F) show that our synthesis method, followed by sonication, yields monodisperse nanoparticle preparations with average diameters of 314 ± 50 nm and 65 ± 10 nm for GO and GQD respectively. It was also confirmed that both GO and GQD nanoparticles exhibit excitation-dependent photoluminescence (ESI Fig. S3†) in accord with previous reports.49 The particle height, as measured by AFM, (Fig. 1G and H) was approximately 1.5 nm for both particle preparations, which is in agreement with other reports, but likely an overestimation due to water adlayers between the graphene sheet and the mica surface.56 The zeta potential of the GO and GQD nanoparticles was determined to −38 mV and −8 mV respectively, indicating differences in their surface-exposed functional groups. The measured zeta potential values agree well with those reported by others,57 further supporting the synthesis of typical GO and GQD nanoparticles.
 | ||
| Fig. 1 Physical and chemical characterization of graphene oxide sheets (GO) and graphene quantum dots (GQD). (A and B) FTIR spectrum of (A): GO, and (B): GQD. (C and D) UV-Vis absorption spectrum of (C): GO, and (DGQD). (E and F) Intensity-weighted DLS size distribution of (E) sonicated GO particles (1 hour, ultrasonic bath) and (F) GQD particles (G and H) AFM micrographs of (G) GO and (H) GQD. All scale bars are 1 μm. | ||
GO and GQD nanoparticles inhibit α-syn fibril formation
Thioflavin T (ThT) assays, in plate reader format, were used to monitor the kinetics of the aggregation of 50 μM of SEC-purified monomeric α-syn (ESI Fig. S1†) into amyloid fibrils in absence and presence of increasing concentrations of GO and GQD nanoparticles. The resulting kinetic curves, shown with three technical replicates of each condition overlaid in Fig. 2A and B, show that both GO and GQD inhibit α-syn aggregation in a concentration-dependent manner, which for GO appears to saturate within the assayed range. Consistent with these observations, the end-point ThT fluorescence is also reduced in both cases, suggesting that less fibrils are formed, although both we and others have pointed out that the complex photophysics of ThT when bound to amyloid fibrils and the possible quenching induced by photo-active inhibitors (as used here) precludes such direct conclusions to be drawn.58–61 Interestingly, we observe that addition of a low (25 μg ml−1) concentration of GO increases rather than slows down the aggregation rate of α-syn. This is also reflected in the decreased aggregation half-time (Fig. 3A). A similar, albeit less pronounced effect, is observed for GQD (Fig. 2B and 3A). This points to that the nanoparticle-to-protein ratio sensitively determines the aggregation modulatory effect of both GO and GQDs. Although it is known that different types of nanoparticles can have different aggregation modulatory effects, such dual behaviour has not been reported; instead previously published work on α-syn fibril formation have pointed out only the inhibitory function of graphene-based nanomaterials.47,48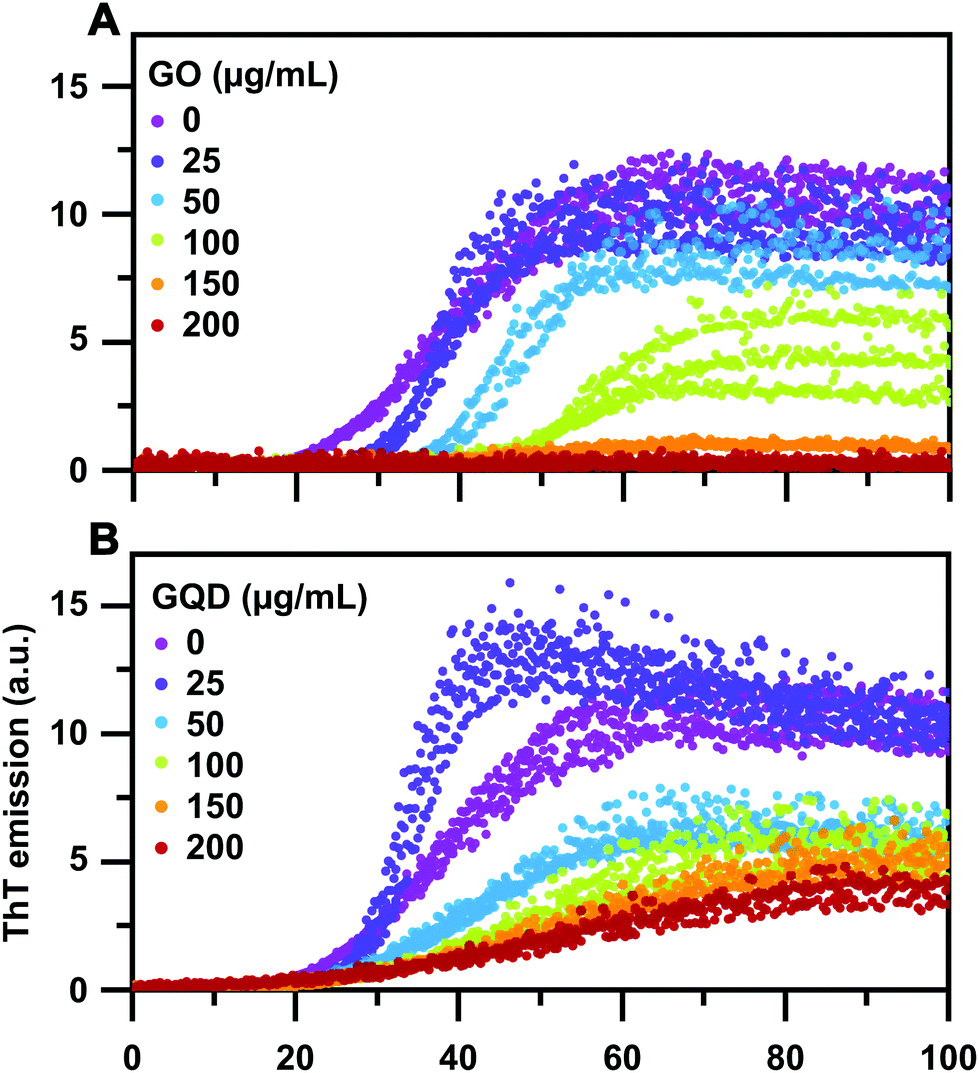 | ||
| Fig. 2 Aggregation kinetics of 50 μM α-syn in presence of (A) GO and (B) GQD nanoparticles monitored by ThT fluorescence. The experiments were performed in 25 mM Tris-HCl buffer, with 150 mM NaCl at pH 7.4 and 37 °C with shaking at 200 rpm. Each concentration was run in technical triplicates, the plot shows data from all triplicates. | ||
 | ||
| Fig. 3 Kinetic parameters describing the aggregation data in Fig. 2. (A) Half-time of aggregation, computed as the time at which the fibril mass fraction reaches 0.5. (B) Lag-time, computed as the time at which the fibril mass fraction reaches 0.1. (C) Maximum slope, computed as the slope of a linear fit between fibril mass fraction 0.3–0.7. All data are computed from normalised triplicate measurements (Fig. S3†), error bars represent the standard deviation. | ||
Due to the observation of an aggregation-enhancing effect at low nanoparticle-to-protein ratios in combination with a saturation effect at high ratios (Fig. 2) it was not possible to obtain sufficient data in order to globally fit the aggregation kinetics to rate laws51 in order to quantitatively describe the inhibitory mechanisms of action. Still, it is meaningful to discuss the differences between GO and GQD in mechanistic terms, based on the clearly different effects that these two nanoparticles have on the shapes of the aggregation curves (see ESI Fig. S4† for normalized curves). To describe this in quantitative terms, we computed the half-time, lag-time, and the maximum slope of all kinetic traces (Fig. 3, see the Experimental section for details). The data in Fig. 3 show that whilst GO and GQD have relatively similar concentration-dependent effects on the aggregation half-times (Fig. 3A), GO extends the lag time much more than GQD (Fig. 3B) and has a more significant effect on the maximum slope (Fig. 3C). This strongly suggests that GO and GQD inhibit α-syn by different mechanisms. The concentration-dependent extension of lag time in presence of GO is consistent with significant inhibition of primary nucleation, which appears not to occur in the case of GQD. Both nanoparticles affect the maximum slope which indicates inhibition of secondary processes and/or elongation.12,62 Interestingly, this also emulates observed effects of GQD nanoparticles on the aggregation of the diabetes-related islet amyloid polypeptide.46 The analysis presented in Fig. 3 furthermore shows that the enhanced aggregation rate in presence of low concentrations of both GO and GQD results from a significant increase in the maximum slope of the aggregation, suggesting acceleration of secondary processes rather than primary nucleation.
Since GO, in particular, was able to enhance α-syn aggregation at low nanoparticle-to-protein ratios whilst inhibiting at high GO concentrations, we also tested if it was possible to modulate its effect by addition bovine serum albumin (BSA) to form a protein corona on the GO nanoparticles.63 BSA was added at the start of the aggregation experiment, at two different molar concentrations (15 and 50 μM) to samples with α-syn alone and α-syn with 200 μg ml−1 of GO nanoparticles (corresponding to complete inhibition according to the data shown in Fig. 2A). The resulting kinetic traces (Fig. 4A) show that BSA had no effect on the GO-mediated inhibition, inferring that the α-syn interaction is stronger than that between BSA and GO. We also tested to what extent GO and GQD can modulate an ongoing aggregation reaction, by adding the nanoparticles at different time points after the start of the reaction (Fig. 4B and C). Addition of 200 μg mL−1 GO (Fig. 4B) at any time point abruptly inhibited aggregation as measured by the immediate halt of ThT fluorescence increase, suggesting adsorption of monomers and hence significant reduction of the effective protein concentration in the aggregating solution. GQD particles, on the other hand, have a slight retarding effect, when added at the beginning of the exponential growth phase (15 h), but the aggregation thereafter resumes with a similar rate as before addition, suggesting a weaker interaction with monomers in this case.
 | ||
| Fig. 4 (A) Aggregation kinetics of 50 μM α-syn in presence of GO and bovine serum albumin (BSA). (B and C) Inhibition of the aggregation of 50 μM α-syn upon addition of (B) GO and (C). The aggregation kinetics were monitored by ThT fluorescence and performed in 25 mM Tris-HCl buffer, with 150 mM NaCl at pH 7.4 and 37 °C with shaking at 200 rpm. Each sample was run in technical triplicates, the plots show average data from all triplicates. | ||
Altogether, our analysis of the effect of GO and GQD on the aggregation kinetics of α-syn clearly demonstrates concentration-dependent inhibitory effects, consistent with the growing body of literature on the effect of graphene nanoparticles on amyloid formation in general,42–44 and corroborates in particular two recently published studies on inhibition on α-syn aggregation.47,48 Our results furthermore extends the knowledge of how graphene-based nanomaterials interact with amyloid proteins by pin-pointing differences in the aggregation kinetics in presence of GO and GQD, which in turn infers that they act by different inhibitory mechanisms. By assaying the aggregation rate of α-syn over a range of nanoparticle concentrations, we also report that graphene-based materials can, under certain conditions, also enhance aggregation.
The inhibitory effects of GO and GQD are governed by their physicochemical properties
In order to better understand how GO and GQD nanoparticles exert their aggregation inhibitory effects, we used different biophysical assays to probe the interactions between the nanoparticles and the monomeric and fibrillar α-syn. First, taking advantage of the intrinsic fluorescence emanating from the four tyrosine residues in α-syn and the optical activity of GO and GQD nanoparticles, we probed monomer interaction by tyrosine quenching (Fig. 5A and B). A significant concentration-dependent quenching was observed for both GO and GQD, consistent with reports that GO can act as a universal quencher of aromatic amino acids via both static mechanisms and dynamic quenching;64 our results show that the quenching was not of Förster resonance energy transfer type, as no increase in GO/GQD emission in the ∼400 nm region was observed after the intrinsic fluorescence from the GO/GQD nanoparticles had been subtracted (for non-subtracted spectra, see ESI Fig. S5†). The degree of quenching (and hence the interaction) of monomeric α-syn with respectively GO and GQD was analysed using Stern–Volmer type plots as shown in Fig. 5C, where F0/F represents the ratio of the emission from α-syn alone (F0) and the emission from α-syn in presence of nanoparticles (F). The differences in tyrosine fluorescence quenching between GO and GQD is negligible, except at very high nanoparticle concentration suggesting that monomers may interact similarly with the two nanoparticle types. We next repeated the tyrosine quenching experiment with pre-formed α-syn fibrils (ESI Fig. S6†), observing substantially stronger quenching for GO than for GQD (Fig. 5C). This suggests that fibrillar α-syn adsorbs more effectively on the GO surface, possibly due to the larger surface area of the GO particles, which has previously been shown to be an important modulating parameter in other protein:graphene systems.65,66
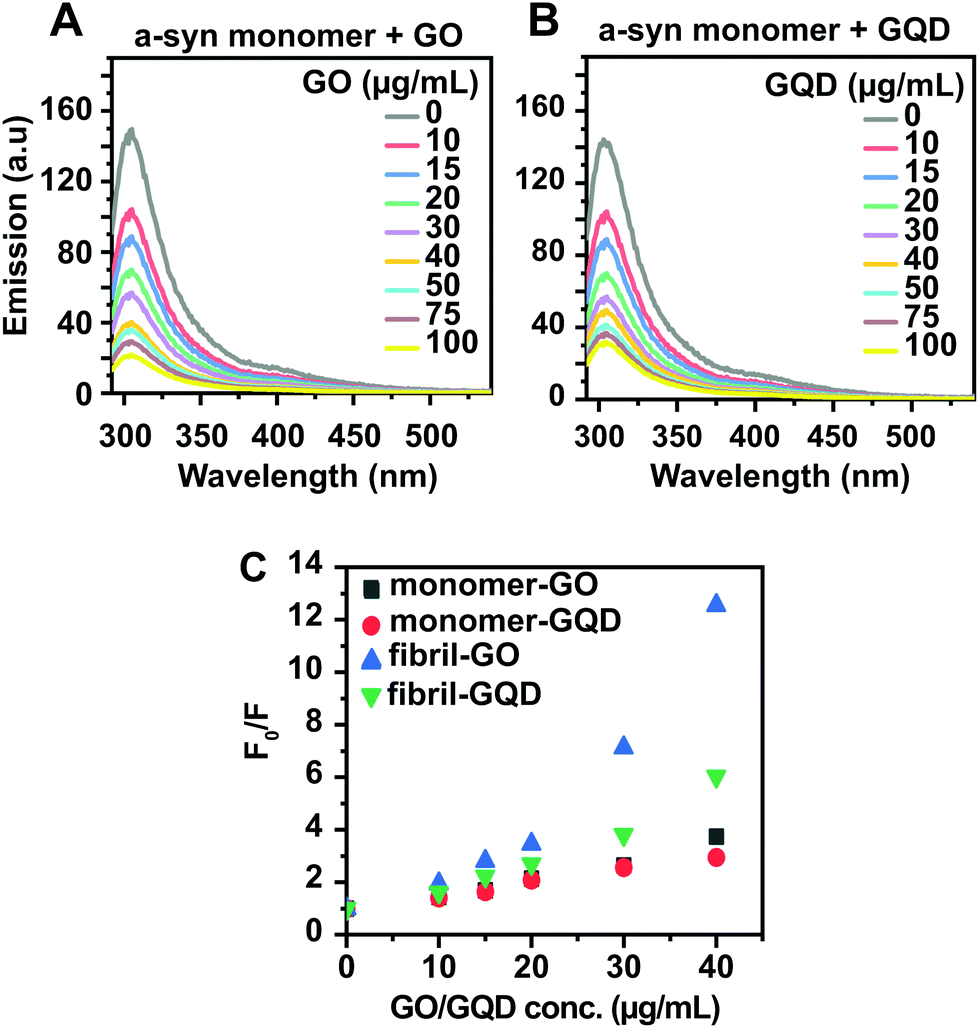 | ||
| Fig. 5 (A and B) Tyrosine fluorescence quenching of 50 μM monomeric α-syn titrated with (A) GO and (B) GQD. The intrinsic emission from the nanoparticles alone has been subtracted from each spectrum. (C) Stern–Volmer plots of quenching efficiency of GO and GQD on tyrosine fluorescence in α-syn monomers and fibrils, computed from the data in (A and B) and Fig. S5† (for fibrils). | ||
We also used DLS to probe the α-syn nanoparticle interaction in terms of size distribution alterations (Fig. 6). The intrinsic size distributions GO and GQD are shown in the top panels in Fig. 6A and B and correspond to the data shown in Fig. 1. Monomeric α-syn (Fig. 6C and D), has an average hydrodynamic diameter of 5 ± 2 nm in accord with previously published results.67 Upon addition of 50 μg mL−1 of GO nanoparticles to the α-syn monomer solution, the protein monomer peak in the intensity-weighted distribution completely disappears (Fig. 6E) whereas the size and monodispersity of the GO nanoparticles themselves exhibit apparent increase from 314 ± 50 nm to 441 ± 213 nm. This strongly suggests that α-syn monomers adsorb avidly to the GO surface as part of the aggregation inhibitory mechanism and is therefore consistent with the primary nucleation inhibitory effect that we propose for GO.
 | ||
| Fig. 6 Hydrodynamic radii distributions of α-syn (monomers and fibrils) and GO/GQD solutions measured by dynamic light scattering. (A) GO nanoparticles, (B) GQD nanoparticles (C and D) α-syn monomers (data duplicated for easier comparison across figure columns). (E and F) α-syn monomers in presence of (E) GO and (F) GQD. (G and H) α-syn mixture of monomers and fibrils obtained after 40 h incubation (data duplicated for easier comparison across figure columns) (I and J) α-syn mixture of monomers and fibrils in presence of (I) GO and (J) GQD. | ||
The size increase would, if caused by α-syn alone, result in multiple protein layers. It is therefore likely that α-syn to some extent also lead to GO aggregation. For GQD nanoparticles, the result is different. Upon addition of 50 μg mL−1 GQD, the α-syn monomer peak remains visible and there is only very slight size shift or broadening of the GQD peak (Fig. 6F). This result, as opposed to the tyrosine quenching data (Fig. 5), suggests that the interaction between monomeric α-syn and GQD nanoparticles is not as strong as with GO nanoparticles. The comparatively minor increase in size of GQD upon adsorption of α-syn furthermore suggests that a more traditional protein corona is formed.
The DLS experiments were repeated using α-syn samples that had been pre-incubated with and without 50 μg mL−1 concentrations of GO and GQD at 37 °C and 300 rpm shaking for 40 hours to reach approximately the midpoint of the sigmodal kinetic curves shown in Fig. 2A and B, e.g. the samples should contain both monomers and fibrils. The intensity weighted size distribution of the aggregated α-syn sample alone (Fig. 6G and H) displays three peaks of which the sub-10 nm species corresponds to the monomer. The ∼100 and >1000 nm reflect the formation of different fibrillar species. The sample containing 50 μg ml−1 of GO (Fig. 6I), appears with one peak, corresponding to a hydrodynamic diameter of 690 ± 110 nm, suggesting that both monomeric and fibrillar species associate with GO, forming co-aggregates. In the corresponding experiment with GQD (Fig. 6J), the three α-syn specific peaks remain. Furthermore, there is an overlap in size between the GQD nanoparticles themselves and the ∼100 nm α-syn peak preventing any distinction between the two species based on DLS. Nevertheless, the DLS data support the result in Fig. 5 that GQD nanoparticles interact less strongly with fibrillar α-syn, and furthermore suggests that this holds also for monomers. A possible explanation to the discrepancy between the tyrosine quenching experiments (indicating similar binding of monomeric α-syn go GO and GQD) and the DLS experiments (showing that all monomeric α-syn is adsorbed to GO, but not to GQD) is that the quenching capacity of the nanoparticles has a relatively small “sphere-of-action”. The tyrosine residues in α-syn reside in the highly acidic C-terminal region which is unlikely to directly interact with GO and GQD due to electrostatic repulsion. Hence, this loosely associated region may not be susceptible to tyrosine quenching even if the rest of the protein is tightly bound to the GO particle.
In any case, GO appears to have a higher protein binding capacity than GQD, which could be attributed in part to its physical characteristics, with a larger surface area per particle. This has previously been demonstrated as an important factor in amyloid-β aggregation65 and is in line with recent observations that the physicochemical properties of nanoparticles can greatly affect its capacity to perturb the aggregation of α-syn.48
GO and GQD changes the morphology of α-syn fibrils
Circular dichroism (CD) spectroscopy was used to monitor the secondary structure of aggregated α-syn after 6 days of incubation at 37 °C with shaking at 200 rpm in presence of different concentrations of GO and GQD (0–200 μg mL−1) nanoparticles (Fig. 7A and B respectively). The far-UV CD spectra of aggregated α-syn in absence of any nanoparticles (black lines in Fig. 7A and B) display negative ellipticity at 218 nm and positive ellipticity at around 200 nm, consistent with its expected transformation into β-sheet rich amyloid fibrils upon long term incubation. The magnitude of the CD signal in both of these bands decreases with increasing concentrations of GO (Fig. 7A) or GQD (Fig. 7B) nanoparticles, suggesting that less fibrils are formed. This observation is consistent with the ThT intensity reductions reported in Fig. 2, and with observations by Kim et al.68 Furthermore, at the highest GO concentration, α-syn retains its random coil configuration as shown by the negative ellipticity at 200 nm, further substantiating the conclusion from Fig. 2A that GO can completely inhibit α-syn aggregation if added at sufficient concentration, but also that monomeric α-syn remains unstructured when adsorbed to the GO surface. | ||
| Fig. 7 (A and B) Circular dichroism spectra of 50 μM α-synuclein incubated for 6 days at 200 rpm shaking, 37 °C, in presence of increasing concentration of (A) GO, and (B) GQD. Both samples show predominant β-sheet content, which diminishes with increasing nanoparticle concentration. | ||
AFM (Fig. 8) was thereafter used to examine the morphology of α-syn fibrils formed under the same conditions as those analysed by CD. The images reveal that α-syn alone assembles into well-defined mature fibrils with typical lengths of (1620 ± 560 nm) and a height of (9.3 ± 2.7 nm). For α-syn fibrils formed in presence of low concentrations of GO (25–50 μg mL−1) we still observed these typical amyloid fibril morphologies, but with increasing nanoparticle concentration the fibrils decrease in both length and thickness (Fig. 8B and C). Notably, formation of oligomers was not observed. In the presence of 100 μg mL−1 GO nanoparticles, α-syn aggregates are markedly shorter (462 ± 192 nm) and thinner (4.4 ± 1.1 nm) with a significant curvilinear appearance. The reduced length could be attributed to particle-induced fibril fragmentation.69 The halving of fibril thickness on the other hand indicates a change in fibril structure that is consistent with the formation of single filaments rather than the double filaments observed in recent high resolution structures of fibrils formed from full-length α-syn.70,71 This, in turn, would explain the curvilinear appearance of fibrils formed in presence of GO and GQD (Fig. 8), given the reported reduced bending rigidity of ribbon-like α-syn fibrils.72 The existence of single protofilaments is furthermore consistent with a report that GQD may disintegrate α-syn fibrils,47 although we observed no changes in fibril morphology when 200 μg mL−1 GO was added to pre-formed α-syn fibrils (ESI Fig. S7†). No fibrils could be observed at the highest GO concentration (200 μg mL−1) consistent with the lack of increase in ThT emission (Fig. 2) and the random coil CD signature of α-syn fibrils formed under this condition (Fig. 7). For GQD nanoparticles, we find a less pronounced reduction in length of the α-syn fibrils (possibly related to reduced shearing by the smaller size GQD particles and hence a lesser fragmentation effect). The fibrils are, furthermore, still present at the highest GQD concentration supporting the notion that GQD-mediated inhibition is incomplete (Fig. 2) due to limited adsorption of both monomers and fibrils (Fig. 6). The curvilinear structures observed with GO are not present, even though the fibrils formed have reduced height. These structural and morphological differences between the fibrils formed in presence of GO and GQD demonstrate that graphene-based materials not only inhibit fibril formation, but also affect the nature of the assembled structures. This is an illustrative example of the sensitivity of amyloid fibril formation reactions towards solution conditions, and presence of surfaces and demonstrates the polymorphic nature of α-syn amyloid assemblies.
 | ||
| Fig. 8 (A) AFM images of 50 μM α-synuclein incubated in the presence of 0–200 μg mL−1 of GO and GQD, in 25 mM Tris-HCl, 150 mM NaCl, pH 7.4, 37 °C with shaking at 200 rpm after 120 hours. Each sample was diluted 10-fold so final α-synuclein and buffer concentration was 5 μM and 2.5 μM with 15 μM NaCl respectively. All scale bars show 2 μm. (B and C) Length (B) and height (C) analysis of AFM images of 50 μM α-synuclein incubated in the presence of 0–150 μg mL−1 of GO and GQD. Images were individually analysed using Gwyddion and ImageJ, at least 20 fibrils were counted for each image. The error bars represent the standard deviation. | ||
Conclusions
We have used kinetic assays in combination with other biophysical experiments to describe the aggregation modulating effect of two types of graphene nanoparticles on the aggregation of Parkinson's disease-related protein α-syn. We show that both graphene oxide sheets (GO) and graphene quantum dots (GQD) under most experimental conditions effectively inhibit α-syn aggregation, but also reveal that aggregation enhancing effects can be obtained at low nanoparticle-to-protein ratios. Using fluorescence spectroscopy and DLS, we show that the inhibitory effect of the nanoparticles arises from interactions with both α-syn monomers and fibrils. Moreover, both GO and GQD alters the morphology of α-syn fibrils, promoting the formation of thin assemblies consisting of one single protofilament, which could perturb secondary nucleation as well as promote fibril disaggregation due to the loss of stabilising interfilament interactions.Importantly, our study reveals that GO and GQD inhibit α-syn aggregation by partially different mechanisms. GO effectively sequesters both α-syn monomers and fibrils onto the nanoparticle surface. This reduces the lag time and alters the maximum slope of the aggregation kinetics profile, suggesting that monomer sequestration importantly slows down primary nucleation, but also fibril elongation. This conclusion is consistent with the observation that addition of GO can halt α-syn aggregation at any time-point of the aggregation reaction and not only when present from start. GQD, on the other hand, appears to interact less strongly with both α-syn monomers and fibrils. Our kinetic analysis consequently reveals no effect on primary nucleation. Instead, GQD appears to mainly reduce α-syn's aggregation rate by interfering with secondary processes, thus affecting only the slope of the kinetic profile. Consequently, we also show that GQD is incapable of halting α-syn aggregation once the reaction has started.
The interactions between α-syn and the GO and GQD nanoparticles are likely mediated by electrostatic interactions between the positive charge clusters in the N-terminal region of α-syn and the negatively charged carboxyl groups on the surface of GO and GQD, leaving the acidic α-syn C-terminus solvent exposed, akin to how α-syn binds acidic lipid membranes,73 but, as evidenced by CD spectroscopy (Fig. 7), without the induction of α-helical structure. This explains the lack of a difference in the degree fluorescence quenching of the C-terminal tyrosines in α-syn monomers in presence of GO and GQD (Fig. 5), that occur despite their clearly higher affinity for GO according to DLS (Fig. 6). We show that GO has a more negative zeta potential than GQD suggesting higher availability of surface-accessible carboxyl groups allowing for avid multivalent interactions with α-syn monomers preventing, more effectively than GQD, their participation in primary nucleation and fibril elongation.
Altogether, this study shows that graphene oxide nanoparticles are potent materials for interfering with α-syn amyloid fibril formation, and highlights how their inhibitory mechanisms can be fine-tuned by their morphological and chemical properties. This contributes to the molecular understanding of how nanomaterials may be rationally designed and potentially used to combat Parkinson's disease and other protein aggregation disorders.
Conflicts of interest
There are no conflicts to declare.Acknowledgements
This work was supported by grants to E. K. E. from the Swedish Research Council (Grant 2016-03902) and to E. K. E. and N. S. from Chalmers Excellence Initiative Nano.References
- F. Chiti and C. M. Dobson, Annu. Rev. Biochem., 2006, 75, 333–366 CrossRef CAS.
- T. P. Knowles, M. Vendruscolo and C. M. Dobson, Nat. Rev. Mol. Cell Biol., 2014, 15, 384–396 CrossRef CAS.
- T. Härd and C. Lendel, J. Mol. Biol., 2012, 421, 441–465 CrossRef.
- T. C. T. Michaels, A. Saric, J. Habchi, S. Chia, G. Meisl, M. Vendruscolo, C. M. Dobson and T. P. J. Knowles, Annu. Rev. Phys. Chem., 2018, 69, 273–298 CrossRef CAS.
- M. Goedert, Nat. Rev. Neurosci., 2001, 2, 492–501 CrossRef CAS.
- M. G. Spillantini, R. A. Crowther, R. Jakes, M. Hasegawa and M. Goedert, Proc. Natl. Acad. Sci. U. S. A., 1998, 95, 6469–6473 CrossRef CAS.
- M. G. Spillantini, M. L. Schmidt, V. M.-Y. Lee, J. Q. Trojanowski, R. Jakes and M. Goedert, Nature, 1997, 388, 839 CrossRef CAS.
- A. K. Buell, C. Galvagnion, R. Gaspar, E. Sparr, M. Vendruscolo, T. P. Knowles, S. Linse and C. M. Dobson, Proc. Natl. Acad. Sci. U. S. A., 2014, 111, 7671–7676 CrossRef CAS.
- Y. Y. Huang, T. P. J. Knowles and E. M. Terentjev, Adv. Mater., 2009, 21, 3945–3948 CrossRef CAS.
- S. Campioni, G. Carret, S. Jordens, L. Nicoud, R. Mezzenga and R. Riek, J. Am. Chem. Soc., 2014, 136, 2866–2875 CrossRef CAS.
- M. H. Polymeropoulos, C. Lavedan, E. Leroy, S. E. Ide, A. Dehejia, A. Dutra, B. Pike, H. Root, J. Rubenstein, R. Boyer, E. S. Stenroos, S. Chandrasekharappa, A. Athanassiadou, T. Papapetropoulos, W. G. Johnson, A. M. Lazzarini, R. C. Duvoisin, G. Di Iorio, L. I. Golbe and R. L. Nussbaum, Science, 1997, 276, 2045–2047 CrossRef CAS.
- S. Linse, Biophys. Rev., 2017, 9, 329–338 CrossRef CAS.
- R. Kayed, E. Head, J. L. Thompson, T. M. McIntire, S. C. Milton, C. W. Cotman and C. G. Glabe, Science, 2003, 300, 486–489 CrossRef CAS.
- B. Bolognesi, J. R. Kumita, T. P. Barros, E. K. Esbjörner, L. M. Luheshi, D. C. Crowther, M. R. Wilson, C. M. Dobson, G. Favrin and J. J. Yerbury, ACS Chem. Biol., 2010, 5, 735–740 CrossRef CAS.
- A. K. Buell, E. K. Esbjörner, P. J. Riss, D. A. White, F. I. Aigbirhio, G. Toth, M. E. Welland, C. M. Dobson and T. P. Knowles, Phys. Chem. Chem. Phys., 2011, 13, 20044–20052 RSC.
- R. Mishra, B. Bulic, D. Sellin, S. Jha, H. Waldmann and R. Winter, Angew. Chem., Int. Ed., 2008, 47, 4679–4682 CrossRef CAS.
- R. Staats, P. Flagmeier and M. Vendruscolo, Biophys. J., 2018, 114, 77a CrossRef.
- L. Giehm, D. I. Svergun, D. E. Otzen and B. Vestergaard, Proc. Natl. Acad. Sci. U. S. A., 2011, 108, 3246–3251 CrossRef CAS.
- M. Grey, C. J. Dunning, R. Gaspar, C. Grey, P. Brundin, E. Sparr and S. Linse, J. Biol. Chem., 2015, 290, 2969–2982 CrossRef CAS.
- C. Cabaleiro-Lago, I. Lynch, K. Dawson and S. Linse, Langmuir, 2009, 26, 3453–3461 CrossRef.
- P. M. Heegaard, U. Boas and D. E. Otzen, Macromol. Biosci., 2007, 7, 1047–1059 CrossRef CAS.
- F. A. Aprile, E. Kallstig, G. Limorenko, M. Vendruscolo, D. Ron and C. Hansen, Sci. Rep., 2017, 7, 9039 CrossRef.
- A. Rekas, C. G. Adda, J. A. Aquilina, K. J. Barnham, M. Sunde, D. Galatis, N. A. Williamson, C. L. Masters, R. F. Anders, C. V. Robinson, R. Cappai and J. A. Carver, J. Mol. Biol., 2004, 340, 1167–1183 CrossRef CAS.
- L. Breydo, D. Morgan and V. N. Uversky, Mol. Neurobiol., 2016, 53, 1949–1958 CrossRef CAS.
- S. Emadi, H. Barkhordarian, M. S. Wang, P. Schulz and M. R. Sierks, J. Mol. Biol., 2007, 368, 1132–1144 CrossRef CAS.
- V. L. Dawson and T. M. Dawson, Sci. Transl. Med., 2019, 11, eaba1659 CrossRef CAS.
- J. Guo, J. Li, Y. Zhang, X. Jin, H. Liu and X. Yao, PLoS One, 2013, 8, e65579 CrossRef CAS.
- C. Li and R. Mezzenga, Nanoscale, 2013, 5, 6207–6218 RSC.
- Q. Li, L. Liu, S. Zhang, M. Xu, X. Wang, C. Wang, F. Besenbacher and M. Dong, Chem. – Eur. J., 2014, 20, 7236–7240 CrossRef CAS.
- L. Xie, Y. Luo, D. Lin, W. Xi, X. Yang and G. Wei, Nanoscale, 2014, 6, 9752–9762 RSC.
- M. Yousaf, H. Huang, P. Li, C. Wang and Y. Yang, ACS Chem. Neurosci., 2017, 8, 1368–1377 CrossRef CAS.
- Y. D. álvarez, J. A. Fauerbach, J. S. V. Pellegrotti, T. M. Jovin, E. A. Jares-Erijman and F. D. Stefani, Nano Lett., 2013, 13, 6156–6163 CrossRef.
- V. L. Colvin and K. M. Kulinowski, Proc. Natl. Acad. Sci. U. S. A., 2007, 104, 8679–8680 CrossRef CAS.
- S. Linse, C. Cabaleiro-Lago, W.-F. Xue, I. Lynch, S. Lindman, E. Thulin, S. E. Radford and K. A. Dawson, Proc. Natl. Acad. Sci. U. S. A., 2007, 104, 8691–8696 CrossRef CAS.
- T. T. Win-Shwe and H. Fujimaki, Int. J. Mol. Sci., 2011, 12, 6267–6280 CrossRef CAS.
- S. Mohammadi, M. Nikkhah and S. Hosseinkhani, Int. J. Nanomed., 2017, 12, 8831 CrossRef CAS.
- L. Feng, S. Zhang and Z. Liu, Nanoscale, 2011, 3, 1252–1257 RSC.
- X. Wang, X. Sun, J. Lao, H. He, T. Cheng, M. Wang, S. Wang and F. Huang, Colloids Surf., B, 2014, 122, 638–644 CrossRef CAS.
- J. Ge, M. Lan, B. Zhou, W. Liu, L. Guo, H. Wang, Q. Jia, G. Niu, X. Huang, H. Zhou, X. Meng, P. Wang, C. S. Lee, W. Zhang and X. Han, Nat. Commun., 2014, 5, 4596 CrossRef CAS.
- B. Z. Ristic, M. M. Milenkovic, I. R. Dakic, B. M. Todorovic-Markovic, M. S. Milosavljevic, M. D. Budimir, V. G. Paunovic, M. D. Dramicanin, Z. M. Markovic and V. S. Trajkovic, Biomaterials, 2014, 35, 4428–4435 CrossRef CAS.
- X. T. Zheng, A. Ananthanarayanan, K. Q. Luo and P. Chen, Small, 2015, 11, 1620–1636 CrossRef CAS.
- S. Bag, A. Sett, S. DasGupta and S. Dasgupta, RSC Adv., 2016, 6, 103242–103252 RSC.
- Y. Liu, L.-P. Xu, W. Dai, H. Dong, Y. Wen and X. Zhang, Nanoscale, 2015, 7, 19060–19065 RSC.
- Z. Yang, C. Ge, J. Liu, Y. Chong, Z. Gu, C. A. Jimenez-Cruz, Z. Chai and R. Zhou, Nanoscale, 2015, 7, 18725–18737 RSC.
- P. Nedumpully-Govindan, E. N. Gurzov, P. Chen, E. H. Pilkington, W. J. Stanley, S. A. Litwak, T. P. Davis, P. C. Ke and F. Ding, Phys. Chem. Chem. Phys., 2016, 18, 94–100 RSC.
- M. Wang, Y. Sun, X. Cao, G. Peng, I. Javed, A. Kakinen, T. P. Davis, S. Lin, J. Liu, F. Ding and P. C. Ke, Nanoscale, 2018, 10, 19995–20006 RSC.
- D. Kim, J. M. Yoo, H. Hwang, J. Lee, S. H. Lee, S. P. Yun, M. J. Park, M. Lee, S. Choi, S. H. Kwon, S. Lee, S. H. Kwon, S. Kim, Y. J. Park, M. Kinoshita, Y. H. Lee, S. Shin, S. R. Paik, S. J. Lee, S. Lee, B. H. Hong and H. S. Ko, Nat. Nanotechnol., 2018, 13, 812–818 CrossRef CAS.
- H. Mohammad-Beigi, A. Hosseini, M. Adeli, M. R. Ejtehadi, G. Christiansen, C. Sahin, Z. Tu, M. Tavakol, A. Dilmaghani-Marand, I. Nabipour, F. Farzadfar, D. E. Otzen, M. Mahmoudi and M. J. Hajipour, ACS Nano, 2019, 13, 3243–3256 CrossRef CAS.
- Y. Dong, J. Shao, C. Chen, H. Li, R. Wang, Y. Chi, X. Lin and G. Chen, Carbon, 2012, 50, 4738–4743 CrossRef CAS.
- T. Werner, R. Kumar, I. Horvath, N. Scheers and P. Wittung-Stafshede, Sci. Rep., 2018, 8, 5465 CrossRef.
- G. Meisl, J. B. Kirkegaard, P. Arosio, T. C. Michaels, M. Vendruscolo, C. M. Dobson, S. Linse and T. P. Knowles, Nat. Protoc., 2016, 11, 252 CrossRef CAS.
- I. Horvath, T. Werner, R. Kumar and P. Wittung-Stafshede, Q. Rev. Biophys., 2018, 51, e6 CrossRef.
- S. K. Sharma, E. Chorell, P. Steneberg, E. Vernersson-Lindahl, H. Edlund and P. Wittung-Stafshede, Sci. Rep., 2015, 5, 12531 CrossRef CAS.
- D. Necas and P. Klapetek, Cent. Eur. J. Phys., 2012, 10, 181–188 Search PubMed.
- J. Peng, W. Gao, B. K. Gupta, Z. Liu, R. Romero-Aburto, L. Ge, L. Song, L. B. Alemany, X. Zhan and G. Gao, Nano Lett., 2012, 12, 844–849 CrossRef CAS.
- C. J. Shearer, A. D. Slattery, A. J. Stapleton, J. G. Shapter and C. T. Gibson, Nanotechnology, 2016, 27, 125704 CrossRef.
- M. K. Kumawat, M. Thakur, R. Bahadur, T. Kaku, S. P. R. , A. Ninawe and R. Srivastava, Mater. Sci. Eng., C, 2019, 103, 109774 CrossRef CAS.
- M. Groenning, J. Chem. Biol., 2010, 3, 1–18 CrossRef.
- I. M. Kuznetsova, A. I. Sulatskaya, V. N. Uversky and K. K. Turoverov, PLoS One, 2012, 7, e30724 CrossRef CAS.
- D. J. Lindberg, A. Wenger, E. Sundin, E. Wesen, F. Westerlund and E. K. Esbjörner, Biochemistry, 2017, 56, 2170–2174 CrossRef CAS.
- D. J. Lindberg, M. S. Wranne, M. G. Gatty, F. Westerlund and E. K. Esbjörner, Biochem. Biophys. Res. Commun., 2015, 458, 418–423 CrossRef CAS.
- A. Munke, J. Persson, T. Weiffert, E. De Genst, G. Meisl, P. Arosio, A. Carnerup, C. M. Dobson, M. Vendruscolo, T. P. J. Knowles and S. Linse, Proc. Natl. Acad. Sci. U. S. A., 2017, 114, 6444–6449 CrossRef CAS.
- G. Duan, S. G. Kang, X. Tian, J. A. Garate, L. Zhao, C. Ge and R. Zhou, Nanoscale, 2015, 7, 15214–15224 RSC.
- S. Li, A. N. Aphale, I. G. Macwan, P. K. Patra, W. G. Gonzalez, J. Miksovska and R. M. Leblanc, ACS Appl. Mater. Interfaces, 2012, 4, 7069–7075 CrossRef CAS.
- Y. Chen, Z. Chen, Y. Sun, J. Lei and G. Wei, Nanoscale, 2018, 10, 8989–8997 RSC.
- Y. Zhang, C. Wu, S. Guo and J. Zhang, Nanotechnol. Rev., 2013, 2, 27–45 CAS.
- A. S. Morar, A. Olteanu, G. B. Young and G. J. Pielak, Protein Sci., 2001, 10, 2195–2199 CrossRef CAS.
- D. Kim, J. M. Yoo, H. Hwang, J. Lee, S. H. Lee, S. P. Yun, M. J. Park, M. Lee, S. Choi and S. H. Kwon, Nat. Nanotechnol., 2018, 13, 812 CrossRef CAS.
- Y. H. Liao, Y. J. Chang, Y. Yoshiike, Y. C. Chang and Y. R. Chen, Small, 2012, 8, 3631–3639 CrossRef CAS.
- R. Guerrero-Ferreira, N. M. Taylor, A. A. Arteni, P. Kumari, D. Mona, P. Ringler, M. Britschgi, M. E. Lauer, A. Makky, J. Verasdonck, R. Riek, R. Melki, B. H. Meier, A. Bockmann, L. Bousset and H. Stahlberg, eLife, 2019, 8, e48907 CrossRef CAS.
- B. Li, P. Ge, K. A. Murray, P. Sheth, M. Zhang, G. Nair, M. R. Sawaya, W. S. Shin, D. R. Boyer, S. Ye, D. S. Eisenberg, Z. H. Zhou and L. Jiang, Nat. Commun., 2018, 9, 3609 CrossRef.
- A. Makky, L. Bousset, J. Polesel-Maris and R. Melki, Sci. Rep., 2016, 6, 37970 CrossRef CAS.
- C. Galvagnion, J. Parkinson's Dis., 2017, 7, 433–450 CAS.
Footnote |
| † Electronic supplementary information (ESI) available: ESI data and figures. See DOI: 10.1039/d0nr05003b |
| This journal is © The Royal Society of Chemistry 2020 |