In situ unraveling of the effect of the dynamic chemical state on selective CO2 reduction upon zinc electrocatalysts†
Tai-Lung
Chen‡
a,
Hsiao-Chien
Chen‡
ab,
Yen-Po
Huang
a,
Sheng-Chih
Lin
a,
Cheng-Hung
Hou
 c,
Hui-Ying
Tan
a,
Ching-Wei
Tung
a,
Ting–Shan
Chan
*d,
Jing-Jong
Shyue
 ce and
Hao Ming
Chen
 *ad
*ad
aDepartment of Chemistry, National Taiwan University, Taipei 10617, Taiwan. E-mail: haomingchen@ntu.edu.tw
bDepartment of Photonics, National Cheng Kung University, Tainan 70101, Taiwan
cResearch Center for Applied Sciences, Academia Sinica, Taipei 11529, Taiwan
dNational Synchrotron Radiation Center, Hsinchu 30076, Taiwan
eDepartment of Materials Science and Engineering, National Taiwan University, Taipei 10617, Taiwan
First published on 3rd August 2020
Abstract
Unraveling the reaction mechanism behind the CO2 reduction reaction (CO2RR) is a crucial step for advancing the development of efficient and selective electrocatalysts to yield valuable chemicals. To understand the mechanism of zinc electrocatalysts toward the CO2RR, a series of thermally oxidized zinc foils is prepared to achieve a direct correlation between the chemical state of the electrocatalyst and product selectivity. The evidence provided by in situ Raman spectroscopy, X-ray absorption spectroscopy (XAS) and X-ray diffraction significantly demonstrates that the Zn(II) and Zn(0) species on the surface are responsible for the production of carbon monoxide (CO) and formate, respectively. Specifically, the destruction of a dense oxide layer on the surface of zinc foil through a thermal oxidation process results in a 4-fold improvement of faradaic efficiency (FE) of formate toward the CO2RR. The results from in situ measurements reveal that the chemical state of zinc electrocatalysts could dominate the product profile for the CO2RR, which provides a promising approach for tuning the product selectivity of zinc electrocatalysts.
Introduction
Massive amounts of CO2 from anthropogenic activities has been constantly released to the atmosphere, and it is estimated that dozens of gigatons of CO2 will be continually emitted in coming decades, which will cause the global warming by 1.3 °C.1 For the purpose of suppressing serious impacts caused by global warming, numerous intuitive and effective approaches to realize carbon neutrality and solve the current environmental dilemma have been investigated. Among the proposed techniques, the electrochemical CO2 reduction reaction (CO2RR) has been taken as the most practical candidate due to its low cost and high accessibility and feasibility with few conditional demands (the CO2RR can be easily conducted under ambient pressure and at room temperature).2–6 Moreover, this electrochemical process is capable of converting CO2 into more valuable fuels, like carbon monoxide (CO), methane (CH4), formate, ethylene (C2H4) and other hydrocarbons, showing its great potential in industrial applications.When it comes to electrocatalytic CO2 reduction reactions, the most paramount concern is the product selectivity and efficiency. From the early 1980s, researchers have worked on various bulk metals for aqueous CO2 electroreduction, and they roughly classified these metal catalysts into several different groups according to their product selectivity, such as Sn for producing formate, Cu for producing hydrocarbons and alcohols, and Au, Ag and Zn for generating CO.2,3 It was generalized that the product profile during the CO2RR is undoubtedly potential-dependent and highly correlated with the surface states, like grain boundaries, roughness, crystal facets, etc.7–10 For instance, morphology-controlled single crystals composed of Cu (100) facets would significantly facilitate ethylene generation during the CO2RR.11 Furthermore, the chemical state of Cu including the oxidation state and coordination environment also plays a pivotal role in improving the CO2RR selectivity toward C2+ product generation. It has been proved that the remaining Cu(I) species on the surface of Cu catalysts could notably lower the onset potential and enhance the ethylene selectivity.12 In addition, single-atom iron on an N-doped carbon support also exhibited distinguished selectivity toward CO in the case of Fe3+–N–C, relative to Fe2+–N–C, due to its faster CO2 adsorption along with weaker absorption of CO.13
In recent years, approximate single selectivity to CO has been achieved by deploying specific noble metal electrocatalysts.5,14–17 Nonetheless, zinc has been found as another potential catalyst for the selective production of CO toward the CO2RR due to its non-precious, non-toxic and Earth-abundant nature. For instance, Zn-based catalysts, such as dendritic Zn, porous Zn catalysts, Zn foam and hexagonal Zn catalysts, have been demonstrated to effectively convert CO2 into CO with an over 80% faradaic efficiency (FECO).18–21 On the other hand, some literature studies have also reported that the generation of formate based on zinc electrocatalysts occurred at higher applied cathodic potentials.22,23 The evidence from the perpendicular-oriented analysis by X-ray photoelectron spectroscopy has proved that metallic zinc would undergo spontaneous oxidation and form the passivating oxide film on the surface when it is exposed to air and/or moisture.24,25 The outermost native zinc oxide atop the metal surface is dense and could prevent the underlying metallic zinc from participating in the electrocatalytic process, indicating that the actual active site on the surface might not be defined according to the original electrocatalyst surface. This phenomenon thus usually leads to a misunderstanding of the correlation between product selectivity and zinc electrocatalysts when in situ characterization studies are not performed to identify the chemical state of zinc electrocatalysts during the electrochemical CO2RR process.
The CO and formate production pathways have been acknowledged as competing reactions during the CO2RR. The major discrepancy in these two pathways is the binding orientation of CO2 molecules on catalytically active sites. More specifically, CO is the major product once carbon atoms in CO2 bind with the active sites, while formate is yielded with a preferred binding of oxygen in CO2 on surface sites. As is well known, the binding situation between reactants and catalytic sites is governed by the nature of catalytic sites on the surface, which can be tuned by modifying the local structure as well as coordinating species around the active sites. For instance, copper catalysts have been recently reported to show different CO2RR product selectivity due to the fact that the electronic structures of Cu active sites are effectively modified by boron or subsurface oxygen.26–28 For these reasons, the distinct selectivity of zinc electrocatalysts toward the CO2RR can be expected to be achieved by adjusting their surface chemical states during electrocatalysis. However, the correlations between the chemical states of zinc catalysts and CO2RR product profiles have not been clarified yet. For deep understanding of the fundamental catalytic mechanism of zinc catalysts toward the CO2RR, in situ X-ray approaches as judicious tools for unveiling the dynamic variations on the catalyst surface are indispensable.29–36
In the present work, to unravel the effect of the dynamic chemical state of zinc on the product selectivity during the CO2RR, a series of zinc oxide electrocatalysts with various degrees of oxidation were prepared through a thermal oxidation approach under an argon atmosphere. The results indicated that the high-temperature oxidation process could destroy the outmost dense zinc oxide atop the metal surface and then further oxidize the inner part of the zinc foil. As a result, the thermally destroyed zinc electrocatalyst exhibited a higher tendency to be electrochemically reduced during the CO2RR process. More significantly, based on in situ XAS characterization and electrochemical results, it can be manifested that the chemical state of zinc could strongly affect the CO2RR product profiles, in which Zn(II) and Zn(0) species dominate the selectivity toward CO and formate, respectively.
Results and discussion
Characterization of pristine zinc foil and oxidized zinc foil
The evidence of pristine zinc foil undergoing spontaneous oxidation is demonstrated by a depth-profiling X-ray photoelectron spectroscopy (XPS) measurement, by which the spectra of Zn 2p3/2, O 1s, and C 1s would be collected on different depths and the corresponding high-resolution chemical analysis can be carried out. During the XPS measurement, an ion gun was used to etch the surface of zinc foil for a certain period of time corresponding to different depths. As shown in Fig. 1, in addition to the presence of some carbon species on the outermost surface, the depth profile of pristine zinc foil showed that a roughly 105 nm zinc oxide layer appears on the surface of zinc foil. This result indicated that the oxide layer could easily form on the surface of zinc foil, which contributed to the preservation of interior metallic zinc. With the protection of immediately formed native oxide, the inner zinc was prone to maintain stability, and further oxidation would not happen at room temperature or even in slightly heated environments.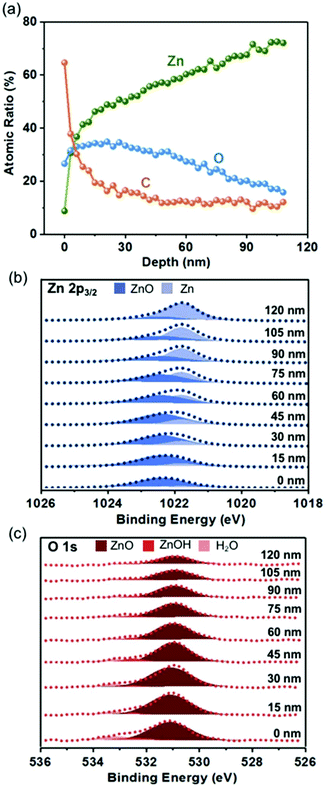 | ||
| Fig. 1 Depth analysis of pristine Zn foil. (a) Quantification of elemental analysis from XPS. Fitting results of XPS spectra as a function of depth for (b) Zn 2p3/2 and (c) O 1s. | ||
To further effectively destroy this native oxide, thermal oxidation at 200, 300, 400 and 500 °C under an argon atmosphere was conducted, and the resulting samples were denoted as O-Zn-200, O-Zn-300, O-Zn-400 and O-Zn-500, respectively. The crystal structures of O-Zn-200, O-Zn-300, O-Zn-400, and O-Zn-500 were determined by X-ray diffraction (XRD) in a range of 2θ between 30° and 70°. As shown in Fig. S1,† all the diffraction peaks of O-Zn-200 and O-Zn-300 were assigned to the hexagonal metallic zinc (JCPDS No. 87-0713) with the presence of a small amount of ZnO species in the O-Zn-300 sample. The dominant diffraction signal of metallic zinc in the O-Zn-200 sample indicated that the native oxide film as a dense protective layer could effectively prevent further oxidation of interior metallic zinc. Furthermore, ZnO with a wurtzite structure (JCPDS No. 80-0075) was formed significantly when the oxidation temperature was increased to 400 °C. The newly emerging ZnO diffraction peaks demonstrated that the oxidation processes at 400 and 500 °C resulted in a destruction of native zinc oxide and the exposure of internal metallic zinc for further oxidation.
The high-resolution XPS spectra of Zn 2p3/2, O 1s, and C 1s of different samples exhibited binding energy peaks at around 1022.2, 530.8 and 285.4 eV, respectively, as shown in Fig. 2, Fig. S2 and Fig. S3.† The Zn 2p3/2 spectrum of O-Zn-200 showed the presence of plenty of metallic zinc in addition to zinc oxide, demonstrating that the surface oxide layer could isolate the inner zinc from further oxidation. This dense oxide layer was slightly destroyed through the thermal oxidation at 300 °C, as demonstrated by a decrease of metallic zinc. Obviously, O-Zn-400 and O-Zn-500 with the destructed protection layer were oxidized to ZnO completely within the measurable depth of XPS. These phenomena were consistent with the results of XRD. In addition, O 1s XPS spectra showed peaks at 532.6 eV and 531.0 eV, assigned to –OH and oxide species, respectively, which confirmed the existence of Zn–OH species on the surface even though the Zn(OH)2 signals were not observed in XRD analysis.25,37 It had been reported that the ZnO surface exposed to air may easily form Zn(OH)2.38 Additionally, the synthesized ZnO nanowire through thermal evaporation showed the presence of Zn(OH)2 which was attributed to the absorption of atmospheric moisture. Therefore, the Zn(OH)2 species on zinc foils was ascribed to the adsorption of moisture during transferring the samples from the furnace to vacuum container.39 Moreover, the morphologies of zinc foil were observed to change during the thermal oxidation process (Fig. 2). Specifically, O-Zn-200 displayed a rock-like and dense surface, and this morphology was well retained for the O-Zn-300 sample. Once the sample was subjected to the thermal oxidation process at 400 °C and 500 °C, it is noted that the dense oxide layer suffered from destruction, resulting in the formation of a cracked surface. The formation of cracks facilitated the oxidation of the internal zinc foil, thus increasing the degree of oxidized zinc. Additionally, the depth-profiling XPS spectra of O-Zn-200 showed that the zinc oxide layer was about 126 nm in depth, which was slightly higher than that of native zinc oxide (105 nm) on pristine zinc foil (Fig. S4†). When the oxidation temperature was increased up to 400 °C, the oxidation layer depth was further increased to 175 nm, indicating that the protection layer of native oxide was destroyed and the oxidation degree of zinc foil augmented due to the formation of the cracked surface. The thicknesses of O-Zn-200, O-Zn-300, O-Zn-400 and O-Zn-500 were also confirmed with cross-section SEM images. As shown in Fig. S5,† a smooth surface with a 120 nm thick dense oxide layer can be observed on O-Zn-200, indicating that the native oxide was not destroyed at a relatively low temperature. As the processing temperature increased, the surface dense oxidation layer was slightly undermined on O-Zn-300. It can be further seen that the flat oxidation layer still remained on the sample with about 130 to 140 nm in thickness, isolating the unreacted zinc beneath, while the sample surface gradually became rough with few pores. Furthermore, the dense oxidation layer was observed to be obviously damaged by higher heating temperatures. However, the thickness of oxide layers was hardly defined due to the ambiguous boundaries with the absence of the native oxide, and it is noteworthy that the surface was no longer flat, which featured a bumpy surface and massive pores. Such phenomena were in agreement with the results of XRD that the obvious formation of ZnO species occurred until the temperature reached up to 400 °C.
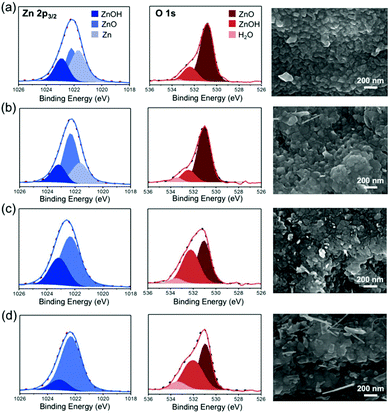 | ||
| Fig. 2 Fitting results of Zn 2p3/2 and O 1s XPS spectra and corresponding SEM images for (a) O-Zn-200, (b) O-Zn-300, (c) O-Zn-400 and (d) O-Zn-500 samples. | ||
Electrochemical performance for the CO2RR
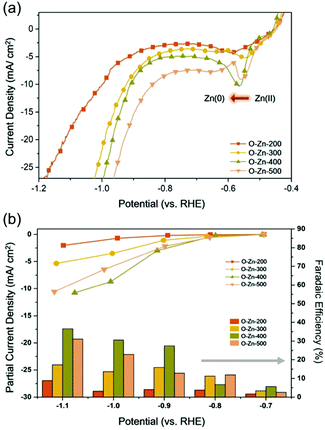
To evaluate the electrocatalytic activity of the as-prepared Zn electrodes for the CO2RR, linear sweep voltammetry (LSV) measurements were conducted on O-Zn-200, O-Zn-300, O-Zn-400 and O-Zn-500 in N2 or CO2 saturated 0.1 M KHCO3 solution, as shown in Fig. 3a and Fig. S6.† Obviously, the increase in current density under a CO2 atmosphere relative to that under a N2 atmosphere represented their electrocatalytic ability toward the CO2RR. Additionally, compared to O-Zn-200 and O-Zn-300, it can be seen that the reduction peaks of Zn2+/Zn of O-Zn-400 and O-Zn-500 were sufficiently distinct, further confirming that a large portion of oxidized zinc was reduced to metallic zinc on samples treated at higher temperatures.To assess the faradaic efficiency (FE) of each sample toward the CO2RR, constant potential amperometry was performed in the selected potential range from −0.70 to −1.10 V (vs. RHE) under CO2-saturated 0.1 M KHCO3 solution. As calculated, CO was the major product on O-Zn-200 with a maximum FE of 79.7% at −1.00 V (Fig. S7†), and such selectivity could also be observed in the case of O-Zn-300 with FECO of 76.6% at the same potential, which was similar to previous results.3,7 Interestingly, the selectivity was observed dramatically altered on O-Zn-400 and O-Zn-500, as shown in Fig. 3b. It can be seen that only 42.8% of FECO at −1.00 V was obtained on O-Zn-400. On the other hand, the selectivity toward formate for all samples was found to increase once the applied potential was extended more negatively. Specifically, O-Zn-200 exhibited only 8.9% of FEHCOOH at −1.00 V, and the corresponding value notably increased to 36.6% for O-Zn-400. Moreover, the partial current density of formate (jHCOOH) for O-Zn-400 at −1.00 V had a more than 5-fold increase over that of O-Zn-200 (Fig. 3b). It is worth noting that the cathodic potentials used for the CO2RR on all samples were more negative than the reduction potential of Zn2+, suggesting that the enhancement of FEHCOOH might be ascribed to the formation of metallic Zn.
In situ Raman spectroscopy, in situ XAS and in situ XRD probing oxidized zinc electrocatalysts
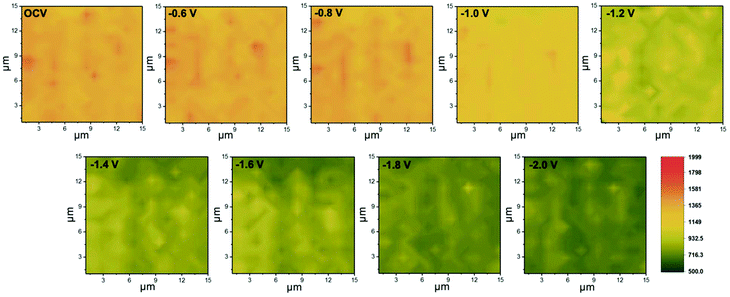
To examine the surface feature of the as-prepared Zn-based electrocatalysts, Raman spectroscopy was employed to monitor the structural changes during the CO2RR. Fig. 4a shows the typical Raman spectra of the as-prepared Zn-based samples. The peaks at 437 and 566 cm−1 are assigned to the E2H and A1(LO) modes of ZnO, respectively.40 The evidence of increasing oxidation temperature inducing the ZnO formation could be demonstrated by the comparison of peak intensities, which showed the peak intensity in the order of O-Zn-500 > O-Zn-400 > O-Zn-300 > O-Zn-200. Furthermore, in situ Raman spectroscopy was also used to comprehensively monitor the structural changes on applied potentials during the CO2RR. As shown in Fig. 4b, the peak intensity at 566 cm−1 did not change obviously with increasing cathodic potentials from OCV to −0.8 V. With progressively increasing cathodic potentials, the Raman peak intensity of all samples decreased, with O-Zn-400 and O-Zn-500 showing more significant decreases. It is noteworthy that the metallic Zn is Raman inactive; thus the reduction of the peak intensity of all samples was attributed to the electrochemical reduction of ZnO to metallic Zn. Moreover, the exposed surface of O-Zn-400 during the CO2RR could be further characterized by in situ Raman mapping in a region of 15 × 15 μm2 with the selected peak at 566 cm−1 (Fig. 5). The entire surface of oxidized Zn foil was covered by ZnO species although the oxidation depth was not very uniform, as demonstrated by the uneven distribution of Raman intensity. Similarly, the results were in accordance with those of Raman spectra with single point measurement that exhibited a significant decrease of ZnO peak intensity when the cathodic potential was increased from −1.0 V to −2.0 V. This phenomenon demonstrated that the initial surface ZnO gradually transformed to metallic Zn with the increase of cathodic potentials during the CO2RR.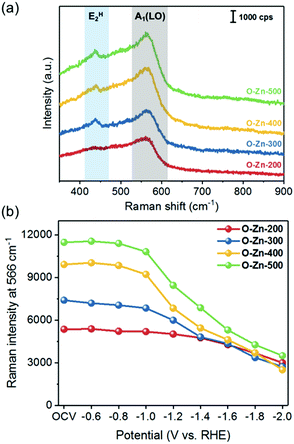 | ||
| Fig. 4 (a) Raman spectra of O-Zn-200, O-Zn-300, O-Zn-400 and O-Zn-500, and (b) their peak intensity at 566 cm−1 based on in situ Raman monitoring. | ||
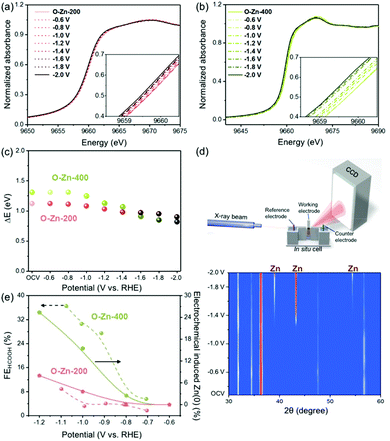
Additionally, to reveal the correlation between chemical states of Zn and the product profile during the CO2RR, in situ X-ray absorption near edge structure (XANES) spectroscopy for the O-Zn-200 and O-Zn-400 samples was conducted (Fig. 6a and b). According to the valence of zinc (either Zn(0) or Zn(II)), the extent of oxidation of all samples can be estimated as a mixture of Zn and ZnO in different proportions. The XANES spectrum of O-Zn-200 in electrolytes showed the K-edge at 9660.1 eV based on a maximum in the XANES first derivative, while Zn with the K-edge at 9659.0 eV and ZnO with the K-edge at 9661.0 eV were observed (Fig. 6a). By calculation, the degree of oxidation on the zinc foil was estimated to be 56% (Fig. 6c). Furthermore, it is found that the oxidation state of O-Zn-200 did not change with increasing cathodic potentials from OCV to −0.8 V (vs. RHE), which was consistent with the thermodynamic potential of −0.76 V for reducing ZnO to Zn. Interestingly, only a negligible part of O-Zn-200 could be electrochemically reduced when the cathodic potential was increased from −1.0 V to −2.0 V. As a consequence, the degree of electrochemical reduction for O-Zn-200 was 3.6%, 8.0%, 12.5%, 13.4%, 15.2% and 19.6% at an applied potential of −1.0, −1.2, −1.4, −1.6, −1.8 and −2.0 V, respectively. Furthermore, it could be concluded that the higher FEHCOOH and lower FECO were obtained when a much higher ratio of reduced zinc was formed on the O-Zn-200 surface, indicating that the active sites for producing formate and CO might be metallic Zn and oxidized ZnO species, respectively. These results can be further proved by the in situ XANES spectra of the O-Zn-400 sample under the CO2RR conditions (Fig. 6b). With increasing the cathodic potentials, the oxidation state of the O-Zn-400 sample changed to lower values, which was evidenced by the decreased intensity of white lines and the shift of excitation energy toward lower energies. Compared with the case of the O-Zn-200 sample, O-Zn-400 was observed to have a more pronounced edge shift with progressively increasing cathodic potentials, suggesting that the O-Zn-400 was prone to be reduced during the electrochemical CO2RR (Fig. 6c). These results could be explained by the less dense layer of surface oxide formed by the thermal oxidation process. Additionally, the degree of electrochemical reduction of O-Zn-400 was 15.5%, 25.4%, 33.8%, 56.3%, 64.8% and 69.0% at a potential of −1.0, −1.2, −1.4, −1.6, −1.8 and −2.0 V, respectively. The results of in situ XRD also supported the results of in situ XAS. The in situ XRD apparatus, illustrated in Fig. 6d, was employed to capture further information on the structural changes of O-Zn-400. As is shown, the phase of reduced Zn(0) was observed to gradually emerge when the applied potential was higher than −1.0 V. In the meantime, it can be noted that the diffraction peaks assigned to ZnO were still present but a little weaker even though the potential was as negative as −2.0 V. Combining surface reduced Zn(0) with the FEHCOOH shown in Fig. 6e, it can be obviously seen that the degree of electrochemical reduction on zinc catalysts was capable of affecting the FECOOH at individual applied potential, which was evidenced by the similar trends of FEHCOOH and electrochemically induced Zn(0) under applied cathodic potentials (Fig. 6e). Therefore, it could be deduced that the Zn(0) species on the Zn foil would dominate the production of formate during the CO2RR.
To unravel the effect of the dynamic chemical state on selective CO2 reduction upon zinc electrocatalysts, a schematic process of zinc electrocatalysis was proposed and is illustrated in Fig. 7a based on the results of in situ XANES, XRD and Raman spectroscopy. Initially, the as-prepared sample surface in the electrolyte was characterized as ZnO due to the oxidation treatment induced by a high-temperature process. The surface structure of oxidized ZnO did not change within the cathodic potential range from −0.6 V to −0.8 V because the potential did not reach the thermodynamic potential for reducing ZnO to Zn. Once the cathodic potential was extended to −1.0 V, which was higher than the thermodynamic potential, the ZnO was observed to be only slightly reduced to Zn. However, it had been reported that the metallic zinc would undergo a spontaneous oxidation process when it was exposed to oxygen. It can be expected that the oxygen in the electrolyte ([O]electrolyte) resulted in a dynamic oxygen-induced oxidation–electrochemical reduction (Ooxygen–REC) cycle during applying cathodic potentials for the CO2RR. At a cathodic potential of −1.0 V, this dynamic cycle was dominated by the spontaneous re-oxidation; thus only a small portion of reduced metallic zinc was detected. With further increasing the cathodic potential from −1.2 V to −2.0 V, the electrochemical reduction would dominate the dynamic Ooxygen–REC cycle, thereby causing an obvious transformation of ZnO to metallic Zn.
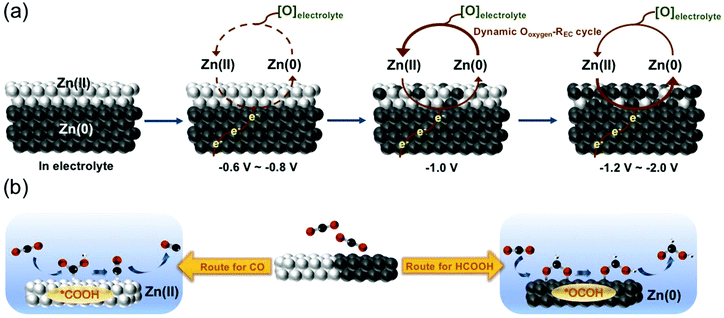 | ||
| Fig. 7 (a) Schematic process of the zinc electrocatalyst during the CO2RR. (b) Schematic mechanisms of the CO2RR for Zn(II) and Zn(0) electrocatalysts. | ||
Based on the schematic process of the dynamic Ooxygen–REC cycle on Zn electrocatalysts and CO2RR product profiles, it can be concluded that the chemical state of zinc sites plays pivotal roles in controlling the product selectivity, as reflected in the production of CO from the intermediate carboxyl (*COOH) species and formate product from the intermediate formate (*OCHO). Jaramillo et al. theoretically demonstrated the volcano plots using the binding energy of *COOH and *OCHO species as descriptors, which showed that Zn lied near the peak to generate formate via interacting strongly with*OCHO.41 Additionally, the theoretical limiting potentials on different metal surfaces were also calculated based on those two different intermediates, and relatively low limiting potential of formate was estimated on Zn compared with the other two-electron reduction reaction, manifesting the tendency toward the formation of formate.42 Furthermore, the results of in situ measurements and CO2RR product profiles indicated that the increase of applied negative potential was accompanied by the increase of FEHCOOH; meanwhile, the chemical state of the zinc catalyst was prone to transform to Zn(0), suggesting that the active site Zn(0) dominated the formate production while Zn(II) dominated the CO production. Considering the reaction pathways for producing CO and formate, the major discrepancy in these two pathways is the binding orientation between CO2 molecules and catalytically active sites, in which CO would be the major product with a preferred binding of carbon atoms in CO2 with active sites while formate was yielded once oxygen atoms in CO2 attached to the catalytic site (as schematically shown in Fig. 7b). It can be deduced that oxygen-bound intermediates to Zn(0) could be attributed to their high oxygen binding affinity to metallic Zn, and then the high FE for formate.43
Additionally, the time-dependent status of active sites upon the electrocatalysts was carried out through on-line analysis of product distribution. The distribution of metallic zinc and oxidized zinc reached equilibrium steady-states under different applied cathodic potentials and showed corresponding product tendency distribution. In other words, the distribution and stability of active sites could be realized via the product profile. Hence, a long term stability test based on on-line GC analysis was conducted with a gas flow cell to better understand the evolution of the product over time. CO was selected as the major product target during the stability test because the liquid phase product of formate is hardly tracked and quantified in real-time. As shown in Fig. S8,† the testing results showed that the duration can last more than 650 minutes long with ∼70% and ∼40% faradaic efficiency to produce CO on O-Zn-200 and O-Zn-400, respectively.
Conclusions
In summary, a series of oxide-derived Zn catalysts was developed to unravel the reaction mechanism behind the CO2RR. The different Zn-based catalysts were fabricated by destructing the compact surface native oxide layer under different oxidation conditions, which were further used to evaluate the product selectivity during the CO2RR. Based on the results of XRD and XPS, these zinc electrocatalysts were observed to be roughly divided into two groups, samples with and without the protection of a dense native oxide layer, which showed totally different product selectivity toward the CO2RR. Intriguingly, the Zn foil treated at lower oxidation temperatures (200 and 300 °C) showed higher selectivity toward CO, while those treated at higher oxidation temperatures (400 and 500 °C) showed higher selectivity toward formate. Combining the in situ Raman spectroscopy, in situ XAS, in situ XRD and electrochemical results, we proposed that the active sites for producing CO and formate were oxidized ZnO and metallic zinc, respectively. With careful inspection of early works studying the metallic Zn electrocatalyst for CO2 reduction, the relatively low cathodic potential was applied. It is noted that a spontaneous oxidation process could occur and facilitate generation of ZnO on the catalyst surface. However, the generated ZnO could not be reduced to metallic Zn at such lower cathodic potential, suggesting that the real active sites during the CO2RR in early works were ZnO. Such results led to a misunderstanding of metallic Zn electrocatalysts correlating with CO production without deploying in situ measurements. This work represents the first example in unraveling the significant effect of the dynamic chemical state on selective CO2 reduction upon zinc electrocatalysts.Experimental
Materials
Zn foil (99.99%, 0.1 mm thick) was washed with DI water (18.2 MΩ) and sonicated for 30 minutes to clean up the surface of the material. Potassium hydrogen carbonate (KHCO3), dimethyl sulfoxide (DMSO) and deuterium oxide (D2O) were purchased from Acros Organics. Potassium chloride was purchased from Fisher Scientific. The CO2 gas (99.999%) was purchased from Shen-Yi Gas Co. These chemicals were used without further purification.Preparation of zinc electrocatalysts
A piece of zinc foil was first etched in dilute nitric acid to remove surface layers. After it was rinsed in DI water and sonicated for 20 minutes, the zinc foil was placed in a tube furnace under a constant flow of Ar gas (100 sccm) for the oxidation treatment at specified temperatures (200, 300, 400 and 500 °C). After the catalyst preparation was completed, the resulting samples were directly stored and sealed under vacuum conditions to prevent them from being oxidized.Structural characterization
Scanning electron microscopy (SEM) images were obtained with a JEOL JEM-2100F, and energy-dispersive X-ray spectroscopy (EDX) line scans were conducted with an Oxford INCAx-act system. The crystalline structure analysis was carried out by X-ray diffraction (XRD, Bruker D2 Phaser) using Cu Kα radiation (λ = 1.54 Å). The XPS analysis was performed with a PHI 5000 Versa Probe (ULVAC-PHI, Japan) system, using a monochromatic Al Kα X-ray source. In order to avoid surface potential build-up during the measurement, all spectra were acquired while the sample surface was neutralized by an e− and an Ar+ beam with an acceleration voltage of 10 V. To conduct depth profile analysis, an Ar+ ion beam is used for the etching process, with an acceleration voltage of 0.5 kV and 600 nA current; each process lasts for 30 seconds with an etching rate of about 2 Å per second depending on material properties. In situ Raman spectroscopy was performed with a UniDRON (CL Technology) with a 50× objective lens and a 532 nm laser.Electrochemical measurement
Electrochemical data were collected using an Autolab PGSTAT302N potentiostat (Metrohm Autolab) at room temperature. All measurements were conducted in a customized H-type cell consisting of two gastight cells separated by an anion-exchange membrane (FuMA-Tech, Fumasep FAA-3-PK-130). 0.1 M KHCO3 solution was chosen as the electrolyte, CO2 was bubbled into the electrolyte for at least 30 minutes to ensure that the electrolyte was CO2-saturated (pH 6.8). Zinc catalysts were fixed with a platinum clip electrode with 1 cm × 1 cm area immersing in the electrolyte. A platinum wire was used as an auxiliary electrode and Ag/AgCl (3 M KCl) served as the reference electrode. Chronoamperometry was carried out to analyze product distribution at various potentials. Linear sweep voltammetry (LSV) was performed with a scan rate 10 mV s−1, and potentiostatic electrochemical impedance spectroscopy (PEIS) was conducted to determine the uncompensated solution resistance (Ru).CO2 reduction reaction product studies
Product distribution analysis was conducted after 20 coulombs of charge collected under constant potential. Gas products were analyzed by gas chromatography (Agilent 7890A, Agilent Technologies) with a thermal conductivity detector (TCD) for H2 and CO quantitation. Liquid products (formate) were analyzed by NMR (Bruker AVIII HD-400 MHz NMR) 100 μL of DMSO (1.41 × 10⁻³ M) was added to 10 mL reaction electrolyte; subsequently 600 μL of well-mixed solution was then mixed with 200 μL of D2O. Quantity of formic acid can be calculated with DMSO serving as an internal standard.| Partial Current Density = current density × F.E. |
XAS analysis. Operando quick-scanning X-ray absorption spectroscopy
The measurements for Zn K-edge absorption were performed at TPS 44A, Hsinchu, Taiwan. The corresponding data were recorded in total-fluorescence-yield mode. To obtain a quality spectrum, we applied the Quick-XAS mode in a time-resolution of 5 seconds. The X-ray absorption experimental data were collected in total-fluorescence-yield mode, in which the metallic Zn foil was taken as reference for energy calibration. Using Demeter, all X-ray absorption spectra were processed by subtracting the baseline of pre-edge and normalizing that of post-edge; such data processing was for both X-ray absorption near edge spectra (XANES).Conflicts of interest
There are no conflicts to declare.Acknowledgements
The authors acknowledge support from the Ministry of Science and Technology, Taiwan (Contract No. MOST 108-2628-M-002-004-RSP and 108-2113-M-213-006).Notes and references
- S. J. Davis, K. Caldeira and H. D. Matthews, Science, 2010, 329, 1330–1333 CrossRef CAS PubMed.
- Y. Hori, K. Kikuchi and S. Suzuki, Chem. Lett., 1985, 14, 1695–1698 CrossRef.
- Y. Hori, H. Wakebe, T. Tsukamoto and O. Koga, Electrochim. Acta, 1994, 39, 1833–1839 CrossRef CAS.
- C. J. Chang, S. F. Hung, C. S. Hsu, H. C. Chen, S. C. Lin, Y. F. Liao and H. M. Chen, ACS Cent. Sci., 2019, 5, 1998–2009 CrossRef CAS PubMed.
- C. J. Chang, S. C. Lin, H. C. Chen, J. Wang, K. J. Zheng, Y. Zhu and H. M. Chen, J. Am. Chem. Soc., 2020, 142, 12119–12132 CrossRef CAS PubMed.
- S. C. Lin, C. C. Chang, S. Y. Chiu, H. T. Pai, T. Y. Liao, C. S. Hsu, W. H. Chiang, M. K. Tsai and H. M. Chen, Nat. Commun., 2020, 11, 3525 CrossRef CAS PubMed.
- J. Rosen, G. S. Hutchings, Q. Lu, S. Rivera, Y. Zhou, D. G. Vlachos and F. Jiao, ACS Catal., 2015, 5, 4293–4299 CrossRef CAS.
- A. Verdaguer-Casadevall, C. W. Li, T. P. Johansson, S. B. Scott, J. T. McKeown, M. Kumar, I. E. Stephens, M. W. Kanan and I. Chorkendorff, J. Am. Chem. Soc., 2015, 137, 9808–9811 CrossRef CAS PubMed.
- X. Feng, K. Jiang, S. Fan and M. W. Kanan, J. Am. Chem. Soc., 2015, 137, 4606–4609 CrossRef CAS PubMed.
- A. Dutta, M. Rahaman, N. C. Luedi, M. Mohos and P. Broekmann, ACS Catal., 2016, 6, 3804–3814 CrossRef CAS.
- N. T. Suen, Z. R. Kong, C. S. Hsu, H. C. Chen, C. W. Tung, Y. R. Lu, C. L. Dong, C. C. Shen, J. C. Chung and H. M. Chen, ACS Catal., 2019, 9, 5217–5222 CrossRef CAS.
- H. Mistry, A. S. Varela, C. S. Bonifacio, I. Zegkinoglou, I. Sinev, Y. W. Choi, K. Kisslinger, E. A. Stach, J. C. Yang, P. Strasser and B. R. Cuenya, Nat. Commun., 2016, 7, 12123 CrossRef PubMed.
- J. Gu, C. S. Hsu, L. Bai, H. M. Chen and X. Hu, Science, 2019, 364, 1091–1094 CrossRef CAS PubMed.
- Y. Chen, C. W. Li and M. W. Kanan, J. Am. Chem. Soc., 2012, 134, 19969–19972 CrossRef CAS PubMed.
- C. T. Dinh, F. P. García de Arquer, D. Sinton and E. H. Sargent, ACS Energy Lett., 2018, 3, 2835–2840 CrossRef CAS.
- K. Sun, L. Wu, W. Qin, J. Zhou, Y. Hu, Z. Jiang, B. Shen and Z. Wang, J. Mater. Chem. A, 2016, 4, 12616–12623 RSC.
- A. Dutta, C. E. Morstein, M. Rahaman, A. Cedeño López and P. Broekmann, ACS Catal., 2018, 8, 8357–8368 CrossRef CAS.
- J. Rosen, G. S. Hutchings, Q. Lu, R. V. Forest, A. Moore and F. Jiao, ACS Catal., 2015, 5, 4586–4591 CrossRef CAS.
- W. Luo, J. Zhang, M. Li and A. Züttel, ACS Catal., 2019, 9, 3783–3791 CrossRef CAS.
- P. Moreno-Garcia, N. Schlegel, A. Zanetti, A. Cedeño López, M. J. Galvez-Vazquez, A. Dutta, M. Rahaman and P. Broekmann, ACS Appl. Mater. Interfaces, 2018, 10, 31355–31365 CrossRef CAS PubMed.
- H. Won da, H. Shin, J. Koh, J. Chung, H. S. Lee, H. Kim and S. I. Woo, Angew. Chem., Int. Ed., 2016, 55, 9297–9300 CrossRef PubMed.
- H. S. Jeon, I. Sinev, F. Scholten, N. J. Divins, I. Zegkinoglou, L. Pielsticker and B. R. Cuenya, J. Am. Chem. Soc., 2018, 140, 9383–9386 CrossRef CAS PubMed.
- I. S. Kwon, T. T. Debela, I. H. Kwak, H. W. Seo, K. Park, D. Kim, S. J. Yoo, J. G. Kim, J. Park and H. S. Kang, J. Mater. Chem. A, 2019, 7, 22879–22883 RSC.
- S. Yngman, S. R. McKibbin, J. V. Knutsson, A. Troian, F. Yang, M. H. Magnusson, L. Samuelson, R. Timm and A. Mikkelsen, J. Appl. Phys., 2019, 125, 025303 CrossRef.
- B. Zhang, H. B. Zhou, E. H. Han and W. Ke, Electrochim. Acta, 2009, 54, 6598–6608 CrossRef CAS.
- R. M. Aran-Ais, D. Gao and B. Roldan Cuenya, Acc. Chem. Res., 2018, 51, 2906–2917 CrossRef CAS PubMed.
- Y. Zhou, F. Che, M. Liu, C. Zou, Z. Liang, P. De Luna, H. Yuan, J. Li, Z. Wang, H. Xie, H. Li, P. Chen, E. Bladt, R. Quintero-Bermudez, T. K. Sham, S. Bals, J. Hofkens, D. Sinton, G. Chen and E. H. Sargent, Nat. Chem., 2018, 10, 974–980 CrossRef CAS PubMed.
- Y. J. Zhang and A. A. Peterson, Phys. Chem. Chem. Phys., 2015, 17, 4505–4515 RSC.
- Y. Zhu, J. Wang, H. Chu, Y. C. Chu and H. M. Chen, ACS Energy Lett., 2020, 5, 1281–1291 CrossRef CAS.
- Y. Zhu, H. C. Chen, C. S. Hsu, T. S. Lin, C. J. Chang, S. C. Chang, L. D. Tsai and H. M. Chen, ACS Energy Lett., 2019, 4, 987–994 CrossRef CAS.
- S. F. Hung, Y. T. Chan, C. C. Chang, M. K. Tsai, Y. F. Liao, N. Hiraoka, C. S. Hsu and H. M. Chen, J. Am. Chem. Soc., 2018, 140, 17263–17270 CrossRef CAS PubMed.
- S. F. Hung, Y. Y. Hsu, C. J. Chang, C. S. Hsu, N. T. Suen, T. S. Chan and H. M. Chen, Adv. Energy Mater., 2018, 8, 1701686 CrossRef.
- S. C. Lin, C. S. Hsu, S. Y. Chiu, T. Y. Liao and H. M. Chen, J. Am. Chem. Soc., 2017, 139, 2224–2233 CrossRef CAS PubMed.
- C. W. Tung, Y. Y. Hsu, Y. P. Shen, Y. Zheng, T. S. Chan, H. S. Sheu, Y. C. Cheng and H. M. Chen, Nat. Commun., 2015, 6, 8106 CrossRef CAS PubMed.
- C. W. Tung, T. R. Kuo, C. S. Hsu, Y. Chuang, H. C. Chen, C. K. Chang, C. Y. Chien, Y. J. Lu, T. S. Chan, J. F. Lee, J. Y. Li and H. M. Chen, Adv. Energy Mater., 2019, 9, 1901308 CrossRef.
- S. F. Hung, Y. Zhu, G. Q. Tzeng, H. C. Chen, C. S. Hsu, Y. F. Liao, H. Ishii, N. Hiraoka and H. M. Chen, ACS Energy Lett., 2019, 4, 2813–2820 CrossRef CAS.
- J. Winiarski, W. Tylus, K. Winiarska, I. Szczygieł and B. Szczygieł, J. Spectrosc., 2018, 2018, 1–14 CrossRef.
- P. Bhattacharya, R. Fornari and H. Kamimura, Comprehensive Semiconductor Science and Technology, Elsevier, Amsterdam, 2011 Search PubMed.
- T. Ghoshal, S. Biswas, S. Kar, A. Dev, S. Chakrabarti and S. Chaudhuri, Nanotechnology, 2008, 19, 065606 CrossRef PubMed.
- M. Guc, F. Tsin, J. Rousset, Y. E. Romanyuk, V. Izquierdo-Roca and A. Pérez-Rodríguez, J. Phys. Chem. C, 2017, 121, 3212–3218 CrossRef CAS.
- J. T. Feaster, C. Shi, E. R. Cave, T. Hatsukade, D. N. Abram, K. P. Kuhl, C. Hahn, J. K. Nørskov and T. F. Jaramillo, ACS Catal., 2017, 7, 4822–4827 CrossRef CAS.
- J. S. Yoo, R. Christensen, T. Vegge, J. K. Norskov and F. Studt, ChemSusChem, 2016, 9, 358–363 CrossRef CAS PubMed.
- Y. R. Luo, Comprehensive Handbook of Chemical Bond Energies, CRC Press, 2007 Search PubMed.
Footnotes |
| † Electronic supplementary information (ESI) available. See DOI: 10.1039/d0nr03475d |
| ‡ These authors contributed equally. |
| This journal is © The Royal Society of Chemistry 2020 |

