W-Doped TiO2 for photothermocatalytic CO2 reduction†
Yingying
Li
ab,
Andrew G.
Walsh
b,
Dashuai
Li
a,
David
Do
b,
He
Ma
a,
Changhua
Wang
a,
Peng
Zhang
 *b and
Xintong
Zhang
 *a
*a
aKey Laboratory for UV-Emitting Materials and Technology of Ministry of Education, Northeast Normal University, Changchun 130024, China. E-mail: xtzhang@nenu.edu.cn
bDepartment of Chemistry, Dalhousie University, Halifax, NS, Canada. E-mail: peng.zhang@dal.ca
First published on 6th August 2020
Abstract
TiO2 is one of the most widely used photocatalysts and photothermocatalysts. Tailoring their structure and electronic properties is crucial for the design of high-performance TiO2 catalysts. Herein, we report a strategy to significantly enhance the performance of TiO2 in the photothermocatalytic reduction of CO2 by doping high crystalline nano-TiO2 with tungsten. A variety of tungsten doping concentrations ranging from 2% to 10% were tested and they all showed enhanced catalytic activities. The 4% W-doped TiO2 exhibited the highest activity, which was 3.5 times greater than that of the undoped TiO2 reference. Structural characterization of these W-doped TiO2 catalysts indicated that W was successfully doped into the TiO2 lattice at relatively low dopant concentration. Synchrotron X-ray absorption spectroscopy at both the W L3- and Ti K-edges was further used to provide insight into the local structure and bonding properties of the catalysts. It was found that the replacement of Ti with W led to the formation of Ti vacancies in order to maintain the charge neutrality. Consequently, dangling oxygen and oxygen vacancies were produced that acted as catalytically active sites for the CO2 reduction. As the W doping concentration increased from 2% to 4%, more such active sites were generated which thus resulted in the enhancement of the catalytic activity. When the W doping concentration was further increased to 10%, the extra W species that cannot replace the Ti in the lattice aggregated to form WO3. Due to the lower conduction band of WO3, the catalytic O sites were deactivated and CO2 reduction was inhibited. This work presents a useful strategy for the development of highly efficient catalysts for CO2 reduction as well as new insights into the catalytic mechanism in cation-doped TiO2 photothermocatalysis.
Introduction
Photothermocatalytic CO2 reduction is a promising method for producing solar fuels.1–5 Designing suitable catalysts with desirable structure and reactivity is crucial for this process.6,7 TiO2 is a widely studied catalyst in this regard and has demonstrated excellent activity in photothermocatalysis.8–10 In order to achieve high performance, many approaches have been reported to tailor the structure of TiO2,11 such as the addition of co-catalysts,12 the formation of heterojunctions,13 self-doping14,15 and foreign atom-doping.16 Since CO2 activation is the initial step in the reduction process, defects in the TiO2 catalyst are regarded as efficient catalytic sites for initial CO2 absorption and the subsequent charge transfer.17,18 Doping is considered to be beneficial in generating such defects.19 Particularly, doping TiO2 with aliovalent cations can produce and stabilize catalytically active defects due to the charge compensation mechanism.20–24Among the variety of doping elements available, the radius of W6+ is very close to that of Ti4+; thus, doping W into the TiO2 lattice can produce desired defects and electronic effects without significantly modifying the underlying crystal structure.25 As the valence of W is higher than that of Ti, Ti vacancies often appear that can modify the electronic properties of catalysts and improve their performance.26–28 Many methods have been used to dope W into TiO2 catalysts, such as surface doping, bulk doping, and co-doping (i.e. mixed surface and bulk doping).29–31 Among these doping methods, rapid annealing has been considered as an effective approach that can improve the TiO2 catalytic properties.32–34
In this work, we report W doping of one-dimensional nano-TiO2 by rapid annealing for the photothermocatalytic CO2 reduction. Since rutile TiO2 has greater thermal stability than other crystal phases,25 and often shows desirable defect effects,35 it was chosen as the model catalyst in this work. We show that the photothermocatalytic CO2 reduction properties of W-doped TiO2 were significantly improved compared with the undoped TiO2. A detailed picture on the catalytic mechanism is also presented.
Experimental
Synthesis of samples
One-dimensional rutile TiO2 nanostructures were synthesized by annealing molten salt as reported in a previous work.36 2 g P25 powder, 8 g NaCl and 2 g Na2HPO4·12H2O were ground for 30 min. The mixture was calcinated at 825 °C for 8 h. After calcination, the soluble salt and impurities were removed by boiling in deionized water followed by drying at 110 °C for 24 h. Then, X grams of (NH4)10W12O41 ∼ XH2O was added to 4 grams of TiO2, (where X was determined according to the molar ratios of W/Ti used of 0%, 2%, 4% and 10%) and ground to form a fine powder. Finally, the powder was calcined at 750 °C for 30 s in a rapid annealing furnace. The samples are named as TW0, TW2, TW4 and TW10, respectively.Characterization
X-ray powder diffraction (XRD) patterns were collected on a Rigaku, D/MAX-2500 X-ray diffractometer with Cu Kα radiation. The test of all samples was carried out on the quartz substrate. The morphology of the samples was observed using scanning electron microscopy (SEM) on a Quanta 250 FEG; the accelerating voltage was 30.00 kV. X-ray photoelectron spectroscopy (XPS) experiments were carried out using an ESCALAB 250Xi instrument. UV-Vis diffuse reflectance (DR) spectra of the samples were obtained using a PerkinElmer UV WinLab spectrophotometer. Electron spin resonance (ESR) spectra were generated using a Bruker EMXnano spectrometer. Spectra were recorded at 110 K. X-ray absorption spectroscopy (XAS) measurements were conducted using the Sector 9-BM and Sector 20-BM beamlines of the Advanced Photon Source at Argonne National Laboratory (Argonne, IL) with the samples being placed in a washer. Except for the (NH4)10W12O41 reference, W measurements for the samples were taken in fluorescence mode, whereas Ti measurements and W measurements for the (NH4)10W12O41 reference were recorded in transmission mode. At least five scans were used for each measurement.Photothermocatalytic reduction of CO2
Photothermal CO2 reduction was carried out in an autoclave having a total volume of 100 mL. First, 0.05 g powder and 2 mL deionized water, which was degassed with ultrasonication for 10 min, were added to the system. The reactor was then sealed and blown with CO2 (99.999%) for 20 min to ensure the reaction system was filled with pure carbon dioxide. Next, the system was irradiated using a 150 W UV lamp (Hayashi UV410). The light intensity was determined to be 5.3 mW cm−2 at a wavelength of 365 nm using a light intensity meter (UV-A single channel). The reaction temperature was monitored/controlled with a thermocouple and remained essentially unchanged at 393 K (see Fig. S1†). The generation of CO was monitored using a gas chromatograph (model GC-2014, Shimadzu Co., Ltd). The photothermocatalytic activity was tested twice per sample. Note that the structure of the sample with the best activity (TW4) was also tested after reaction, as shown in Fig. S2 and S3.† There was no visible change in the structure of the sample before and after the catalytic reaction.XAS data analysis
XAS data processing and fitting for the W-doped TiO2 samples were performed with data programs Athena and Artemis.37 Using a reference (NH4)10W12O41 compound (W-reference), the amplitude reduction factor (S02) was determined to be 0.72 by fixing known coordination number (CN) values based on crystallographic data, which was then fixed for the doped sample fittings. A k-range of 3.0–10.4 Å−1 was used for the EXAFS fitting of all samples. Both the Debye–Waller (σ2) and E0 shift values were correlated for samples having two tungsten-oxygen shells in order to reduce the number of free running parameters.Results and discussion
Morphology and structure
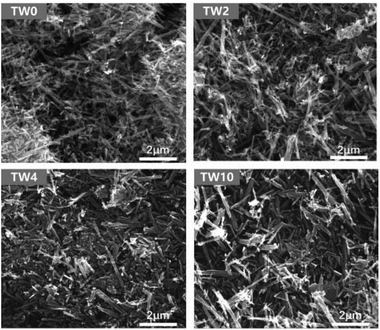
As seen in the SEM images in Fig. 1, all samples contained one-dimensional nanostructure features that can be characterized as either nanowires or nanorods. The length of the samples was mainly between 0.6 μm and 2 μm, while their diameters were mostly between 60 nm and 120 nm. When W was doped into TiO2, there was no appreciable morphological change to the samples. The elemental mapping images are presented in Fig. S4–6.† These maps showed that tungsten did not have the obvious aggregation on the TiO2 surface.In addition to SEM, XRD was further used to characterize the structure of the samples. The four samples all showed the same main peaks of XRD (in Fig. 2a), which correspond to the rutile phase of TiO2 (PDF#21-1276) seen in Fig. 2c. These results indicate that upon W doping, the original TiO2 lattice structure was maintained as indicated in Fig. 2a. Upon increasing the W concentration to 10%, the magnified XRD plot in Fig. 2b contained new low-intensity peaks at 22.7°, 24.0°, 28.2°, 33.1° and 34.0°. They were assigned to WO3 (PDF#05-0388), whose model is shown in Fig. 2d. The low peak intensity for WO3 in TW10 indicates that, when the tungsten doping concentration increased to 10%, a small amount of WO3 were formed. It is worth noting that for TW4, such peaks are barely visible. In addition, such WO3 structure cannot be detected in the subsequent XAS fitting analysis, evidencing its negligible effect on the overall structure of TW4. Therefore, the 4% doping represents a maximum concentration for the bulk lattice doping of TiO2; beyond this point, tungsten oxide starts to form outside of the TiO2 lattice.
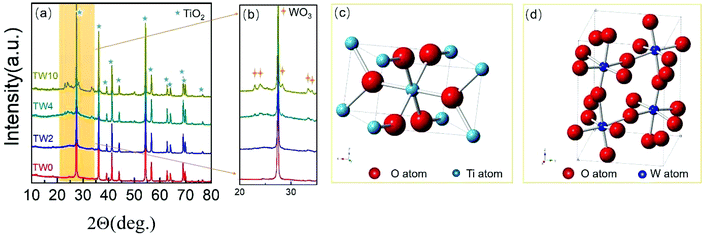 | ||
| Fig. 2 (a) XRD patterns and (b) magnified XRD patterns in the region of 20–35 degrees of TW0, TW2, TW4 and TW10. (c) TiO2 and (d) WO3 unit cell images. | ||
Photothermocatalytic performance
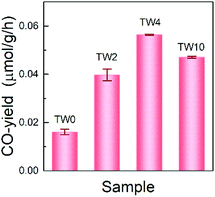
The photothermocatalytic performance of the four samples were determined by investigating CO2 reduction under UV light at 393 K; the results are shown in Fig. 3. Note that there is only CO-production in the system, which is consistent with findings from previous work on TiO2 that, without the addition of co-catalyst, the catalyst can hardly carry on multiple electron and hole transfers to produce hydrocarbons.38 As can be seen in Fig. 3, the three W-doped catalysts showed significant improvement over TW0 in CO-production. A noticeable trend was observed in the CO-yield as the doping concentration increased. The CO-yield increased from 0.016 μmol g−1 h−1 to 0.039 μmol g−1 h−1 upon increasing the tungsten doping to 2% and reached a maximum of 0.056 μmol g−1 h−1 at 4% W. Once the tungsten concentration increased further from 4% to 10%, the yield decreased by roughly 0.009 μmol g−1 h−1. Overall, TW4 showed the best catalytic activity, which produced 3.5 times more CO than TW0.Mechanism for enhancing CO2 reduction photothermocatalytic activity by W doping
To study the factors affecting photothermocatalysis, the electronic properties of the catalysts were investigated. The bonding environments of the catalysts were first analysed using XPS. To closely compare the differences between the catalysts with and without tungsten doping, the sample with the best catalytic performance and the original sample were selected for close comparison. Since the Ti 3d and W 4f binding energies (BEs) overlap, the W XPS spectra are not shown. The valence band of TW4 showed a positive shift of 0.26 eV away from the Fermi level than TW0, as displayed in Fig. 4a. This shift is consistent with the work by Ruiz et al., who proposed that such a shift is caused by the donor state introduced in the band gap due to the formation of defects by doping.39 The optical properties of TW4 also confirmed that there was a shallow state in the band gap, which was reflected in the absorption in the near infrared region as shown in Fig. S7.† As seen in Fig. 4b, there are two individual peaks for at 458.01 eV and 463.07 eV for the TW0 sample. These peaks can be indexed to the 2p3/2 and 2p1/2 transitions of Ti4+. For TW4, these two peaks were not shifted indicating that the general bonding properties of Ti remained unchanged after 4% W doping.40Fig. 4c shows the three O 1s XPS peaks of TW0 and TW4. By fitting the spectra, three peaks assigned as Ti–O, surface hydroxyl oxygen (–OH) and adsorption oxygen groups were obtained. TW4 showed a 0.13 eV negative shift to lower binding energy, implying the formation of oxygen-related defects due to W doping. Upon W doping into TiO2, the oxygen bonding with Ti had a structural change with the lattice rearranged. A more detailed discussion about this phenomenon will be presented with the XAS results later in this section.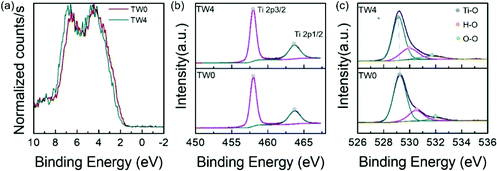 | ||
| Fig. 4 (a) Valence band and XPS spectra of (b) Ti 2p and (c) O 1s core level of the as-prepared samples. | ||
In addition, ESR spectra were also collected (Fig. S8†) to provide evidence into the defect structure of the catalysts. All samples showed a signal at around g = 2.005. The signals in this region are related to the defects on oxygen in TiO2. As the original sample was annealed at high temperatures, defects could have been created during crystallization.36 This result is consistent with the optical properties of the samples with an absorption in the region of visible or near infrared as shown in Fig. S7.†
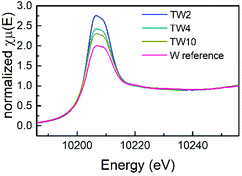
XAS measurements were conducted to obtain more information on the atomic structure and electronic properties of W and Ti in the catalysts. Firstly, as can be seen in the X-ray absorption near edge spectroscopy (XANES) spectra shown in Fig. 5, the four samples exhibited similar peak shapes to one another. Therefore, they share similar electronic properties. The W reference sample had the least intense white line amongst the four samples, which is indicative of the sample having the highest d electron density. In addition, the white line intensity increased as the W doping content decreased: the next most intense white line came from the TW10 sample, followed by the TW4 sample with TW2 having the most intense white line. A clear downward trend with respect to d electron density is seen as the amount of doped tungsten decreased within the samples measured. A low d electron density corresponds to a greater positive charge of the element studied. Therefore, this result indicates that TW2 has the highest tungsten positive charge, followed by TW4 with TW10 having the lowest tungsten positive charge of the three doped samples. The reference compound has the lowest W positive charge amongst all the samples. It should be noted that the observed variations in the positive charge for tungsten are relatively small and do not significantly affect the overall oxidation state of tungsten.
Extended X-ray absorption fine structure (EXAFS) measurements were performed in order to obtain details on the local structure of the three doped samples with respect to the W-reference (see Fig. S9 and S10† for raw data). The Fourier-transformed EXAFS (FT-EXAFS) spectra and their best fits are provided in Fig. 6. Each FT-EXAFS spectrum showed an intense peak in the region between 1–2 Å, which corresponds to interactions between metal and non-metal atoms; in this case, the interactions are between tungsten and oxygen. The W-reference CNs for the fitting results shown in Table 1 were obtained through analysis of the crystal structure of the compound. An upward trend within the first tungsten-oxygen shell CN of the doped samples is observed as the amount of dopant is decreased.
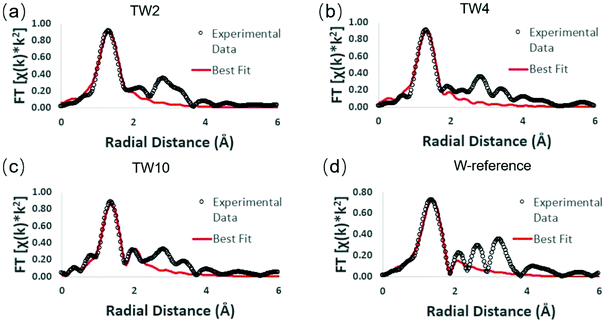 | ||
| Fig. 6 W L3-edge FT-EXAFS spectra of different samples: (a) TW2, (b) TW4, (c) TW10, and (d) W-reference. | ||
| Sample | Shell | CNa | R (Å) | σ 2 | E 0 | R-Factor |
|---|---|---|---|---|---|---|
| a Coordination number. Reference compound values fixed from crystallographic data. | ||||||
| TW2 | W–O | 4.8 (9) | 1.78 (2) | 0.009 (3) | 3 (3) | 0.020 |
| TW4 | W–O | 3.6 (9) | 1.78 (2) | 0.006 (3) | 3 (3) | 0.022 |
| TW10 | W–O | 3.1 (9) | 1.80 (2) | 0.005 (4) | 9 (3) | 0.012 |
| 1.2 (7) | 2.36 (7) | |||||
| W-reference | W–O | 4.33 | 1.81 (3) | 0.011 (7) | 12 (6) | 0.019 |
| 1.67 | 2.22 (5) | 0.009 (8) | ||||
In order to understand these EXAFS fitting results, the unit cell structure of TiO2 and the W-reference needs to be considered. The TiO2 unit cell is essentially an octahedron structure containing one titanium atom bonded to six oxygen atoms. The six Ti–O bonds can be divided into two groups, four of them having a bond distance of 1.965 Å and the other two having a bond distance of 1.984 Å. The difference in bond distance between these groups of bonds, however, is very small (0.019 Å) and thus these six metal–oxygen bonds can be considered as one shell in the EXAFS fitting. The W-reference compound also has an octahedron structure; it has four of the tungsten-oxygen bonds at 1.852 Å and the other two at 2.242 Å. Compared with TiO2, these two groups of W–O bonds show a large difference in bond distance (0.39 Å) and therefore should be fitted with two shells in EXAFS.
The fitting results show that the trend of CNs over the three doped samples is consistent with the results determined from XANES. The higher positive charge of the W-doped catalysts as observed in Fig. 5 can be attributed to electronegative oxygen atoms withdrawing electrons from tungsten. A higher CN of the shortest bond distance W–O shell (i.e. more O atoms bonded to W) would result in more electron transfer from tungsten to oxygen, leading to a more positive charge on tungsten. Notably, the CN for the W–O shell of TW2 is close to 5, which is close to that of a standard titanium atom in the TiO2 unit cell (CN = 6). This finding indicates that tungsten atoms have been doped into the TiO2 lattice and evenly replaced the titanium atoms, which increased the W–O CN with respect to W-reference.41,42 To keep the neutral charge of semiconductor after doping W of higher valence (6+), some vacancies of the Ti atom (4+) will appear.43 Another possibility is to form lower valent Ti species in the sample. However, the XPS (Fig. 4) and ESR (Fig. S8†) experiments indicate that no such Ti species are present. For the XANES spectra of the Ti K-edge, as shown in Fig. S11,† there was little change in white line intensity of the four samples. It was confirmed that the structure of Ti had a slight disturbance when W doping into TiO2. Combining these analyses, Ti vacancies were responsible for the neutral charge. Therefore, the dangling oxygen was produced due to bonding with Ti vacancy.
When the tungsten concentration increases from 2% to 4%, the amount of Ti vacancies should also increase to keep the charge neutrality of the semiconductor. Consequently, the amount of dangling oxygen atoms increased and more oxygen atoms became unstable. Since the valence of W is higher than that of Ti, the Ti vacancies should be mainly formed in the nearest shell around the W centre.
As seen in Table 1, the CN of the W–O shell in TW2 is higher than TW4, which indicates that oxygen vacancies were produced around the tungsten centre when the dopant concentration increased from 2% to 4%. The difference in W–O shell CN is attributable to the increased Ti vacancies. The dangling oxygen atoms between W and Ti vacancies tended to be unstable and easily escaped from the lattice during heating in the synthesis. This also means that the amount of oxygen vacancies and dangling oxygen atoms were increased from 2% to 4% W doping. This is consistent with the XANES result that the amount of positive charge of tungsten in TW4 was lower than that in TW2. As such, the unique structure of W-doped TiO2 containing cation (Ti) and anion (O) vacancies and dangling oxygen could lead to an increase of photothermocatalytic activity of the catalysts as seen in the catalytic result (Fig. 3). The higher tungsten doping concentration in TW4 leads to higher amounts of these active catalytic sites, resulting in higher catalytic activity. Meanwhile, TW10 has two W–O shells in the EXAFS fitting results, with the W–O shell at a longer distance caused by the formation of WO3 outside of the TiO2 lattice. In contrast, such two W–O shells structure cannot be detected in the EXAFS fitting analysis of TW4. This result is consistent with the XRD data shown in Fig. 2. As will be discussed later in this section, the formation of such WO3 species causes a change in the mechanism for the photothermocatalytic CO2 reduction reaction, leading to a decrease in catalytic activity of TW10.
To further study the structure of W-doped TiO2, the Ti K-edge FT-EXAFS spectra are shown in Fig. S12.† The major EXAFS peak in the region from 1–2 Å CN comes from the first shell of the Ti–O bonds. The increased intensity of this peak with the increased W-doping concentration indicates that the Ti–O CN increased. From ESR results (Fig. S8†), since the original TiO2 had defects, the unstable, defect-containing Ti sites with a lower Ti–O CN were more easily replaced with W dopant. As the W-dopant concentration increased, more of such low CN Ti sites will be replaced by tungsten. As a result, the CNs of Ti–O increased with increased W-doping concentration.
Based on the W L3-edge and the Ti K-edge XAS analyses, a summary of the doping-induced structural change is illustrated in Fig. 7. When W was doped into TiO2, Ti vacancies and dangling oxygen atoms were generated. These oxygen atoms would either stay or escape to form oxygen vacancies in the lattice during heating in the synthesis. As the W doping concentration increased, the number of Ti vacancies and defective oxygen atoms also increased.
Based on the above results, the following mechanism is presented on the W-doped TiO2 photothermocatalytic reduction of CO2:
1. When low concentration of W was doped into TiO2, W replaced Ti in the TiO2 lattice. To keep the charge neutrality, Ti vacancies were generated. At the same time, the oxygen bonded with Ti vacancies became dangling oxygen. The dangling oxygen and related oxygen vacancies were beneficial for CO2 absorption and charge transfer. In addition, new energy levels were formed in the band gap acting as electron trapping centres to prolong the charge carrier lifetime (Fig. 8a).44 Both of these two aspects improve the photothermocatalytic reaction of CO2 with H2O. Therefore, the catalytic activity of TW2 was significantly improved relative to TW0.
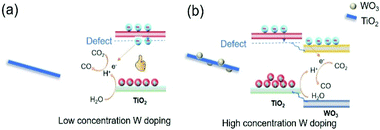 | ||
| Fig. 8 Scheme of W-doped TiO2 over different doping concentration, (a) low concentration and (b) high concentration. | ||
2. Upon increasing the doping concentration from 2% to 4%, more Ti atoms were replaced by W atoms, which resulted in more Ti vacancies. The amount of dangling oxygen and the number of oxygen vacancies near the W centres also increased. Since the amount of catalytically active sites of oxygen vacancies and dangling oxygen increased, the catalytic activity of TW4 was further improved.
3. Upon increasing the W doping concentration to 10%, the extra W species that were not doped into the TiO2 lattice aggregated to form WO3. Since the conduction band of WO3 was lower than that of TiO2, electrons trapped by the O defects flowed to the WO3 conduction band (Fig. 8b). Consequently, the catalytically active O sites cannot be used for the reaction, inhibiting the photocatalytic CO2 reduction. As such, the photothermocatalytic properties of TW10 decreased in comparison with TW4.
Conclusions
In conclusion, we have reported a W doping strategy to significantly enhance the photothermocatalytic activity of TiO2 CO2 reduction. W doping concentrations ranging from 2% to 10% were used and they all exhibited enhanced catalytic activities. The 4% W-doped TiO2 was found to have the highest activity, 3.5 times greater than the relevant TiO2 reference. SEM, XRD, ESR, UV-Vis and XPS characterizations of these W-doped TiO2 catalysts proved the successfully doping of tungsten into the TiO2 lattice when the dopant concentration was not high. We further utilized X-ray absorption near edge structure (XANES) and extended X-ray absorption fine structure (EXAFS) at W L3- and Ti K-edges to shed light into the atomic structure and bonding properties of the catalysts. It was demonstrated that the replacement of Ti with W dopant resulted in the formation of Ti vacancies to maintain the charge neutrality of the semiconductor. As a consequence, dangling oxygen and oxygen vacancies were generated and served as catalytically active sites for the catalytic reduction. When the W concentration increased from 2% to 4%, more of these active sites were formed and thus enhanced the catalytic activity. When the W concentration was too high (10%), the extra W atoms that cannot dope into the TiO2 lattice aggregated to form WO3. It was proposed that the lower conduction band of WO3 deactivated the catalytic O sites and prevented CO2 reduction. These findings provide atomic-level insights into the catalytic mechanism on W-doped TiO2 photothermocatalysis; they also offer an effective strategy for developing highly efficient catalysts for CO2 photothermal reduction.Conflicts of interest
There are no conflicts to declare.Acknowledgements
This work was supported by the Natural Science Foundation of China (91833303, 51072032, 51102001 and 51872044), Jilin Province Science and Technology Development Project (20180101175JC), the 111 project (No. B13013), China Scholarship Council and NSERC Canada. This research used resources of the Advanced Photon Source, an Office of Science User Facility operated for the US Department of Energy (DOE) Office of Science by Argonne National Laboratory, and was supported by the US DOE under Contract No. DE-AC02-06CH11357 and the Canadian Light Source (CLS) and its funding partners. The CLS is supported by the CFI, NSERC, NRC, CIHR, the University of Saskatchewan, the Government of Saskatchewan, and Western Economic Diversification Canada. 1.Notes and references
- A. Steinfeld, Sci. Bull., 2019, 64, 485–486 CrossRef CAS.
- J. Zhao, Q. Yang, R. Shi, G. I. N. Waterhouse, X. Zhang, L.-Z. Wu, C.-H. Tung and T. Zhang, NPG Asia Mater., 2020, 12, 5 CrossRef CAS.
- L. Zhu, M. Gao, C. K. N. Peh and G. W. Ho, Mater. Horiz., 2018, 5, 323–343 RSC.
- G. A. Ozin, Adv. Mater., 2015, 27, 1957–1963 CrossRef CAS PubMed.
- A. A. Tountas, X. Peng, A. V. Tavasoli, P. N. Duchesne, T. L. Dingle, Y. Dong, L. Hurtado, A. Mohan, W. Sun, U. Ulmer, L. Wang, T. E. Wood, C. T. Maravelias, M. M. Sain and G. A. Ozin, Adv. Sci., 2019, 6, 1801903 CrossRef PubMed.
- J. K. Stolarczyk, S. Bhattacharyya, L. Polavarapu and J. Feldmann, ACS Catal., 2018, 8, 3602–3635 CrossRef CAS.
- Z. Li, J. Liu, Y. Zhao, R. Shi, G. I. N. Waterhouse, Y. Wang, L.-Z. Wu, C.-H. Tung and T. Zhang, Nano Energy, 2019, 60, 467–475 CrossRef CAS.
- A. Kubacka, M. Fernandez-Garcia and G. Colon, Chem. Rev., 2012, 112, 1555–1614 CrossRef CAS PubMed.
- F. Yu, C. Wang, H. Ma, M. Song, D. Li, Y. Li, S. Li, X. Zhang and Y. Liu, Nanoscale, 2020, 12, 7000–7010 RSC.
- Y. Li, C. Wang, M. Song, D. Li, X. Zhang and Y. Liu, Appl. Catal., B, 2019, 243, 760–770 CrossRef CAS.
- H. Abdullah, M. M. R. Khan, H. R. Ong and Z. Yaakob, J. CO2 Util., 2017, 22, 15–32 CrossRef CAS.
- J. Zhang, Z. Yu, Z. Gao, H. Ge, S. Zhao, C. Chen, S. Chen, X. Tong, M. Wang, Z. Zheng and Y. Qin, Angew. Chem., Int. Ed., 2017, 56, 816–820 CrossRef CAS PubMed.
- J. Wang, G. Ji, Y. Liu, M. A. Gondal and X. Chang, Catal. Commun., 2014, 46, 17–21 CrossRef CAS.
- G. Yin, X. Huang, T. Chen, W. Zhao, Q. Bi, J. Xu, Y. Han and F. Huang, ACS Catal., 2018, 8, 1009–1017 CrossRef CAS.
- J. Huo, Y. Hu, H. Jiang and C. Li, Nanoscale, 2014, 6, 9078–9084 RSC.
- M. Tahir and N. S. Amin, Appl. Catal., B, 2015, 162, 98–109 CrossRef CAS.
- Y. Ji and Y. Luo, J. Am. Chem. Soc., 2016, 138, 15896–15902 CrossRef CAS PubMed.
- N. Zhang, C. Gao and Y. Xiong, J. Energy Chem., 2019, 37, 43–57 CrossRef.
- A. Kubacka, G. Colón and M. Fernández-García, Catal. Today, 2009, 143, 286–292 CrossRef CAS.
- J. Wang, J. Liu, B. Zhang, F. Cheng, Y. Ruan, X. Ji, K. Xu, C. Chen, L. Miao and J. Jiang, Nano Energy, 2018, 53, 144–151 CrossRef CAS.
- T. H. Chiang, H. Lyu, T. Hisatomi, Y. Goto, T. Takata, M. Katayama, T. Minegishi and K. Domen, ACS Catal., 2018, 8, 2782–2788 CrossRef CAS.
- Y. Ham, T. Hisatomi, Y. Goto, Y. Moriya, Y. Sakata, A. Yamakata, J. Kubota and K. Domen, J. Mater. Chem. A, 2016, 4, 3027–3033 RSC.
- T. Takata and K. Domen, J. Phys. Chem. C, 2009, 113, 19386–19388 CrossRef CAS.
- X. Pan, M. Yang, X. Fu, N. Zhang and Y. Xu, Nanoscale, 2013, 5, 3601–3614 RSC.
- M. Aryanpour, R. Hoffmann and F. J. DiSalvo, Chem. Mater., 2009, 21, 1627–1635 CrossRef CAS.
- N. Couselo, F. S. G. a. Einschlag, R. J. Candal and M. Jobbagy, J. Phys. Chem. C, 2008, 112, 1094–1100 CrossRef CAS.
- M. Yadav, A. Yadav, R. Fernandes, Y. Popat, M. Orlandi, A. Dashora, D. C. Kothari, A. Miotello, B. L. Ahuja and N. Patel, J. Environ. Manage., 2017, 203, 364–374 CrossRef CAS PubMed.
- S. Thogiti, J. Y. Park, T. T. C. Thi, D. K. Lee, B. K. Min, H. J. Yun and J. H. Kim, ACS Sustainable Chem. Eng., 2018, 6, 13025–13034 CrossRef CAS.
- A. V. Katarzyna, A. Michalow, A. Heel1, T. Graule, F. A. Reifler, A. Ritter, K. Zakrzewska and M. Rekas, J. Adv. Oxid. Technol., 2008, 11, 56–64 Search PubMed.
- T. Hathway, E. M. Rockafellow, Y.-C. Oh and W. S. Jenks, J. Photochem. Photobiol., A, 2009, 207, 197–203 CrossRef CAS.
- J. Gong, C. Yang, W. Pu and J. Zhang, Chem. Eng. J., 2011, 167, 190–197 CrossRef CAS.
- I. S. Cho, C. H. Lee, Y. Feng, M. Logar, P. M. Rao, L. Cai, D. R. Kim, R. Sinclair and X. Zheng, Nat. Commun., 2013, 4, 1723–1738 CrossRef PubMed.
- D. Wang, Y. Chen, Y. Zhang, X. Zhang, N. Suzuki and C. Terashima, Appl. Surf. Sci., 2017, 422, 913–920 CrossRef CAS.
- S. Gao, D. Wang, Y. Wang, C. Li, Y. Liu, N. Suzuki, C. Terashima, A. Fujishima and X. Zhang, Electrochim. Acta, 2019, 318, 746–753 CrossRef CAS.
- P. Xiong, X. Zhang, F. Zhang, D. Yi, J. Zhang, B. Sun, H. Tian, D. Shanmukaraj, T. Rojo, M. Armand, R. Ma, T. Sasaki and G. Wang, ACS Nano, 2018, 12, 12337–12346 CrossRef CAS PubMed.
- C. Wang, F. Chang, X. Zhang, R. Zhan and Y. Liu, Ceram. Int., 2018, 44, 10249–10257 CrossRef CAS.
- B. Ravel and M. Newville, J. Synchrotron Radiat., 2005, 12, 537–541 CrossRef CAS PubMed.
- H. Zheng, C. Wang, X. Zhang, Y. Li, H. Ma and Y. Liu, Appl. Catal., B, 2018, 234, 79–89 CrossRef CAS.
- A. M. Ruiz, G. Dezanneau, J. Arbiol, A. Cornet and J. R. Morante, Chem. Mater., 2004, 16, 8862–8871 Search PubMed.
- T. Leshuk, R. Parviz, P. Everett, H. Krishnakumar, R. A. Varin and F. Gu, ACS Appl. Mater. Interfaces, 2013, 5, 1892–1895 CrossRef CAS PubMed.
- X. Hu, S. Li, Y. Chen, W. Qu, J. Chen, Z. Ma and X. Tang, Chem. Commun., 2020, 56, 904–907 RSC.
- W. Qu, Y. Chen, Z. Huang, J. Gao, M. Zhou, J. Chen, C. Li, Z. Ma, J. Chen and X. Tang, Environ. Sci. Technol. Lett., 2017, 4, 246–250 CrossRef CAS.
- M. Fernandez-Garcia, A. Martinez-Arias, A. Fuerte and J. C. Conesa, J. Phys. Chem. B, 2005, 109, 6075–6083 CrossRef CAS PubMed.
- T. Bak, W. Li, J. Nowotny, A. J. Atanacio and J. Davis, J. Phys. Chem. A, 2015, 119, 9465–9473 CrossRef CAS PubMed.
Footnote |
| † Electronic supplementary information (ESI) available. See DOI: 10.1039/d0nr03393f |
| This journal is © The Royal Society of Chemistry 2020 |

