
 Open Access Article
 This Open Access Article is licensed under a Creative Commons Attribution-Non Commercial 3.0 Unported Licence
Different binding mechanisms of Staphylococcus aureus to hydrophobic and hydrophilic surfaces†
Erik
Maikranz‡
a,
Christian
Spengler‡
 b,
Nicolas
Thewes
b,
Alexander
Thewes
a,
Friederike
Nolle
b,
Philipp
Jung
c,
Markus
Bischoff
c,
Ludger
Santen
*a and
Karin
Jacobs
*b
b,
Nicolas
Thewes
b,
Alexander
Thewes
a,
Friederike
Nolle
b,
Philipp
Jung
c,
Markus
Bischoff
c,
Ludger
Santen
*a and
Karin
Jacobs
*b
aTheoretical Physics, Saarland University, Center for Biophysics, 66123 Saarbrücken, Germany. E-mail: l.santen@mx.uni-saarland.de
bExperimental Physics, Saarland University, Center for Biophysics, 66123 Saarbrücken, Germany. E-mail: k.jacobs@physik.uni-saarland.de
cInstitute of Medical Microbiology and Hygiene, Saarland University, Center for Biophysics, 66421 Homburg/Saar, Germany
First published on 16th September 2020
Abstract
Bacterial adhesion to surfaces is a crucial step in initial biofilm formation. In a combined experimental and computational approach, we studied the adhesion of the pathogenic bacterium Staphylococcus aureus to hydrophilic and hydrophobic surfaces. We used atomic force microscopy-based single-cell force spectroscopy and Monte Carlo simulations to investigate the similarities and differences of adhesion to hydrophilic and hydrophobic surfaces. Our results reveal that binding to both types of surfaces is mediated by thermally fluctuating cell wall macromolecules that behave differently on each type of substrate: on hydrophobic surfaces, many macromolecules are involved in adhesion, yet only weakly tethered, leading to high variance between individual bacteria, but low variance between repetitions with the same bacterium. On hydrophilic surfaces, however, only few macromolecules tether strongly to the surface. Since during every repetition with the same bacterium different macromolecules bind, we observe a comparable variance between repetitions and different bacteria. We expect these findings to be of importance for the understanding of the adhesion behaviour of many bacterial species as well as other microorganisms and even nanoparticles with soft, macromolecular coatings, used e.g. for biological diagnostics.
Staphylococcus aureus (S. aureus) is an opportunistic pathogen associated with different community- and hospital-acquired infections.1 One reason for its high pathogenicity is the cells’ ability to adhere strongly to various surfaces, including natural and abiotic materials, such as implanted medical devices.2–4 Subsequent to adhesion, the cells may proliferate and form mechanically and chemically robust biofilms.5,6 Because of the latter, S. aureus is a major cause of implant-related infections with severe consequences for the patients’ health.7–11 Furthermore, since in biofilms the cells can be well-protected against environmental influences and have the ability to adhere to many different types of surfaces, they can spread quickly to formerly non-inhabited space, for example in clinical buildings.12 Hence, understanding and controlling the adhesive behaviour of S. aureus is of fundamental importance for health care and engineering.13,14
The state-of-the-art method in quantitative bacterial adhesion research is atomic force microscopy (AFM)-based force spectroscopy with single bacterial probes (single-cell force spectroscopy, SCFS).4,15–18 This method allows the investigation of many different mechanisms on a single-cell or even molecular level. For instance, it can be performed on bare abiotic surfaces, on conditioned surfaces or on natural or natural-like surfaces (e.g. hydroxyapatite) as well as with pretreated cells.19–23 Using SCFS, a previous study demonstrated that bacterial adhesion to hydrophobic surfaces is governed by cell wall macromolecules tethering to the surface.4 As a consequence, the adhesive strength of a single cell is determined by the number of contact-forming macromolecules and by the strength of each individual binding site. The composition of surface macromolecules, as well as important adhesion parameters, such as the bacterial contact area to solid surfaces, are highly cell-individual properties.24 Thus, general statements concerning the adhesion of certain cell types can only be achieved with good statistics obtained from a sufficiently large number of cells and well-characterized sample surfaces. In addition, former studies have shown that the adhesive strength of several bacterial species strongly depends on surface wettability.25–27 Quantitative data is especially available by SCFS studies which demonstrated that adhesion of Lactobacillus plantarum,28Streptococcus mutans29 and S. aureus16,24 to hydrophobic surfaces is about one order of magnitude stronger than to hydrophilic surfaces.
In this paper, we present a detailed characterization of the adhesion of S. aureus cells to abiotic surfaces by evaluating differences in adhesion behaviour to very hydrophilic (5° water contact angle) and hydrophobic (111° water contact angle) Si wafer-based substrates. We performed SCFS experiments with S. aureus strain SA113 cells that are complemented by Monte Carlo simulations. Our study reveals that on hydrophobic surfaces, many macromolecules tether to the surface, while on hydrophilic surfaces, a potential barrier selects only a few tethering macromolecules. Since our model is based on unspecific binding of cell wall macromolecules, the results of this study may also be of relevance to understand the adhesive behaviour of many other bacteria and microorganisms, such as fungi, eukaryotic cells, or nanoparticles covered with soft, macromolecular coatings for applications like printable electronics,30 biological diagnostics, optoelectronic devices, or energy’ harvesting systems.31 The colonisation of diverse and new habitats usually occurs in the presence of a liquid medium, making surface wettability a key parameter for understanding adhesion.
1. Materials and methods
1.1. Substrate preparation
Si wafers (Siltronic AG, Burghausen, Germany) are the basis of the hydrophilic as well as of the hydrophobic substrates used in this study. The Si substrates feature a native silicon oxide layer of 1.7(2) nm (the number in parentheses denotes the error of the last digit) and an RMS (root mean square) surface roughness of 0.09(2) nm.32 Thoroughly cleaning the Si wafers results in a hydrophilic substrate with an advancing water contact angle of 5(2)°, a surface energy of 64(1) mJ m−2 and a zeta-potential of −104.4(1) mV at pH of 7.3.32 The hydrophobic substrates are prepared by covering a Si wafer with a self-assembled monolayer of octadecyltrichlorosilane (OTS) according to a standard protocol.33 The result is a CH3-terminated substrate with an advancing (receding) water contact angle of 111(1)° (107(2)°), an RMS surface roughness of 0.17(3) nm, a surface energy of 24(1) mJ m−2 (ref. 33) and a zeta-potential of −80.0(1) mV.32 The hydrophilic silicon wafers were cleaned as follows: the substrates were immersed for 30 min in fresh solution of H2SO4 (conc.)/H2O2 (30%) (1![[thin space (1/6-em)]](https://www.rsc.org/images/entities/char_2009.gif) :1), then in boiling deionized water for 90 min, during which the water was changed at least four times. Afterwards, the surfaces were dried in a stream of ultrapure nitrogen. The hydrophobic surfaces were cleaned in an ultrasonic bath of ethanol and acetone subsequently for 5 min each. When changing the solvent and at the end of rinsing, the surfaces were dried in a stream of ultrapure nitrogen. For force spectroscopy experiments, substrates were immersed into phosphate-buffered saline (PBS, pH 7.3, ionic strength 0.1728 mol l−1 at 20 °C).
:1), then in boiling deionized water for 90 min, during which the water was changed at least four times. Afterwards, the surfaces were dried in a stream of ultrapure nitrogen. The hydrophobic surfaces were cleaned in an ultrasonic bath of ethanol and acetone subsequently for 5 min each. When changing the solvent and at the end of rinsing, the surfaces were dried in a stream of ultrapure nitrogen. For force spectroscopy experiments, substrates were immersed into phosphate-buffered saline (PBS, pH 7.3, ionic strength 0.1728 mol l−1 at 20 °C).
1.2. Bacteria
Adhesion studies were performed with Staphylococcus aureus strain SA113. This biofilm-positive laboratory strain is a common platform to study cell wall macromolecules of S. aureus.34–37 All bacterial cultures were prepared the same way, starting the day before the force spectroscopy experiments: an overnight culture was prepared in 5 ml tryptic soy broth (TSB) medium and incubated at 37 °C and 150 rpm for 16 h. The next day, 40 μl of the overnight culture were transferred into 4 ml of fresh TSB medium and incubated for another 2.5 h to obtain exponential phase cells. Subsequently, 0.5 ml of this culture were washed three times, using 1 ml PBS each, to remove extracellular material.1.3. Single-cell force spectroscopy
Single bacterial probes were prepared according to a standard protocol:38 tipless cantilevers (MLCT-O, Bruker Nano GmbH, Berlin, Germany) were covered with a thin layer of polydopamine by polymerization of dopamine hydrochloride (99%, Sigma-Aldrich, St Louis, USA) in TRIS buffer (pH 4.8). Afterwards, single bacterial cells were attached to the polydopamine coated cantilever using a micromanipulator; care was taken to ensure that cells never dry out during probe preparation or force measurements. All cantilevers were calibrated before each measurement. Force spectroscopy measurements with single bacterial probes were conducted under ambient conditions in phosphate buffered saline (PBS, pH 7.3) using a Bioscope Catalyst (Bruker Nano GmbH, Berlin, Germany). We performed force–distance measurements with single bacterial cells of S. aureus SA113 on either a hydrophobic or a hydrophilic substrate. From force–distance curves, we cannot discern if bacteria are dead or alive. However, a previous study demonstrated that intentionally killed bacteria showed identical curves to bacteria that are alive and able to divide.39 For the parameters of the curves, values that correspond to similar studies were chosen:16,40–42 the ramp size was 800 nm, the force trigger (denoting the maximal force with which the cell is pressed onto the substrate) was 300 pN and retraction speed was 800 nm s−1.In total, we analysed 64 cells on hydrophobic surfaces and 52 cells on hydrophilic surfaces. On the tested hydrophobic surfaces, the surface delay time, i.e. the time between approach and retraction in which the cell is in contact to the substrate and the cantilever is not moved, had no big influence on the adhesive strength. Therefore all force–distance curves on hydrophobic surfaces were taken with a nominal surface delay of 0 s which corresponds to a ‘real’ contact time below 0.5 s.16,40 On hydrophilic surfaces, however, the surface delay time is an important parameter whose influence should be checked, as follows. In general, values of a few seconds are a common choice to study the influence of surface delay time on bacterial adhesion processes.18,28,41–43 Therefore, on the hydrophilic surface, 52 cells were probed with a surface delay time of 5 s, and 19 cells were probed without additional surface delay time. For curves with surface delay time, the approach speed was set to 100 nm s−1 while it was 800 nm s−1 when no surface delay was applied. For all cells and delay times, 30 repeated force–distance curves have been analysed the following way: the retraction part of each force–distance curve was evaluated to characterise the strength of adhesion. Hence, the maximum force needed to detach an individual cell from the surface (‘adhesion force’) as well as the separation at which bacterium and surface lose contact (‘rupture length’) were determined. For the latter, the Matlab function findchangepts was used: the largest separation where the root mean square of the signal changed the first time significantly from the background noise was defined as the rupture length.
During approach, bacterial cells can be attracted to the surface at rather large separations due to individually tethering long macromolecules (‘snap-in event’).4 We evaluated this mechanism on both surfaces with respect to its maximum attractive force (‘snap-in force’) and the separation at which the attraction starts (‘snap-in separation’). To compute the latter, we used the same method as for computing the rupture length. While on hydrophobic surfaces, reliable approach curves could be measured, on hydrophilic surfaces, due to the use of a soft cantilever to record the expected lower adhesion forces, fewer reliable curves could be observed. The characteristics of retraction as well as approach curves were quantified by computing histograms and mean curves. The characteristics for the histograms where computed from the individual force separation curves and subsequently binned. The error bars in the histograms and the standard error of the mean are computed in the usual manner by dividing the estimated standard deviation by the square root of the number of curves.
Since the extracted adhesion forces for repeated measurements of the same cell on hydrophobic surfaces are strongly correlated, we estimated those errors not in the usual manner: since the number of independent events is given by the number of cells, we divided by the square root of the number of cells. For the computation of the mean curves, all individual curves where interpolated along a given grid of separation values, and subsequently the corresponding mean and standard deviation were computed point-wise.
1.4. Monte Carlo simulation
To simulate SCFS experiments, we modify a stochastic model introduced by Thewes et al.4 The bacterium is considered to be a hard sphere decorated with soft macromolecules. The length fluctuations, as well as mechanical response to stretching of these macromolecules is modelled as worm-like chain (WLC) polymer, where the properties of each macromolecule are sampled from a given distribution. The interaction with the surface is mediated by a simple square potential with a given potential depth V and interaction range. However, before any macromolecule is able to bind to the surface, it needs to overcome a potential barrier of height H. This barrier is overcome with probability e−H. This binding allows the molecules to pull on the bacterium. The pulling forces on the bacterium are balanced by the bending of the cantilever (modelled as the extension of a spring), and the bacterium is moved to equilibrium position between each step of the cantilever. For more information about the simulation procedure, used parameters and model details, see the ESI.†2. Results and discussion
2.1. Experimental data
 | ||
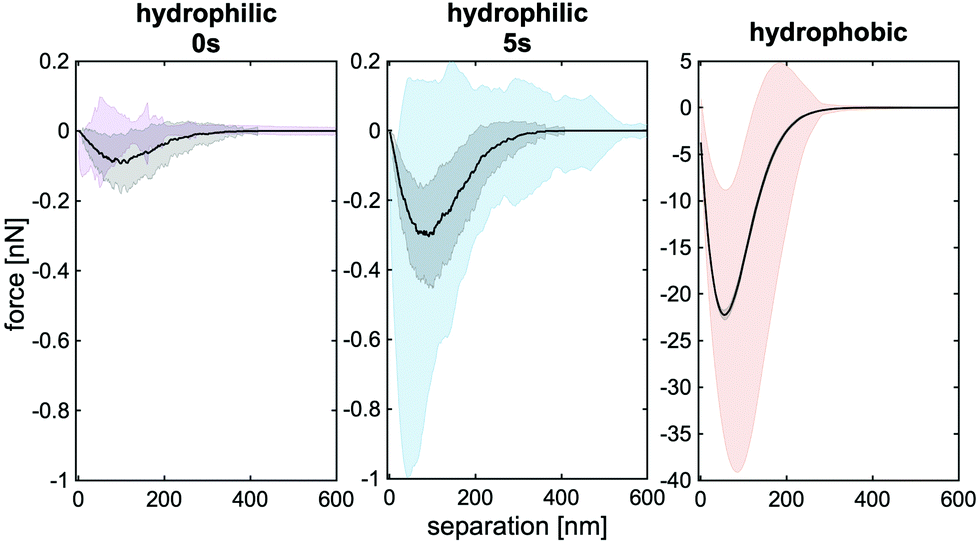
| Fig. 1 (a) Mean SCFS retraction curves (calculated as described in section 1.3) with surface delay times of 0 s (purple, 19 cells) and 5 s (blue, 52 cells) on hydrophilic surface (shaded area is standard deviation). (b, c) Probability density histograms of rupture lengths and adhesion force extracted from single SCFS retraction curves with to (a) corresponding colours. | ||
Quantifying the retraction curves further, we computed the rupture length (indicating the point where the last macromolecule of the bacterium looses contact to the surface) and the adhesion force (maximal force between bacterium and surface) for every curve and computed corresponding histograms (see Fig. 1b and c). The adhesion forces for 0 s surface delay time have mostly values close to 0 pN, but reach values up to hundreds of pN.¶ For 5 s delay time, the adhesion forces have maximum occurrence at about 700 pN but reach values up to several nN. The rupture lengths vary in both cases from several tens of nm to a few hundred nm, whereby for longer surface delay time, larger values are observed more regularly.
Since adhesion is only rarely observed on hydrophilic surfaces without additional delay time and, if it is the case, the forces are rather small, we focus in the following on retraction curves with 5 s delay time. To gain deeper insight in the retraction characteristics of individual bacteria, we show in Fig. 2 mean retraction curves for some cells and mean rupture length and adhesion force for all cells. For every cell, the mean curve is different but their standard deviation markedly overlap (Fig. 2a). The reason for this can be seen in the inset, which shows two exemplary force-separation curves from two successive measurements with the same cell. Although, both curves have similar ‘spiky’ features, they are obviously very different from each other. This fact is also reflected in the mean adhesion forces and rupture lengths: the adhesion forces are all located in a range of about 0.1 to 1.7 nN with error bars (depicting the standard deviation) between 0.5 and 1 nN (Fig. 2b), while the rupture lengths vary around 150 nm and have error bars of more than 100 nm (Fig. 2c).
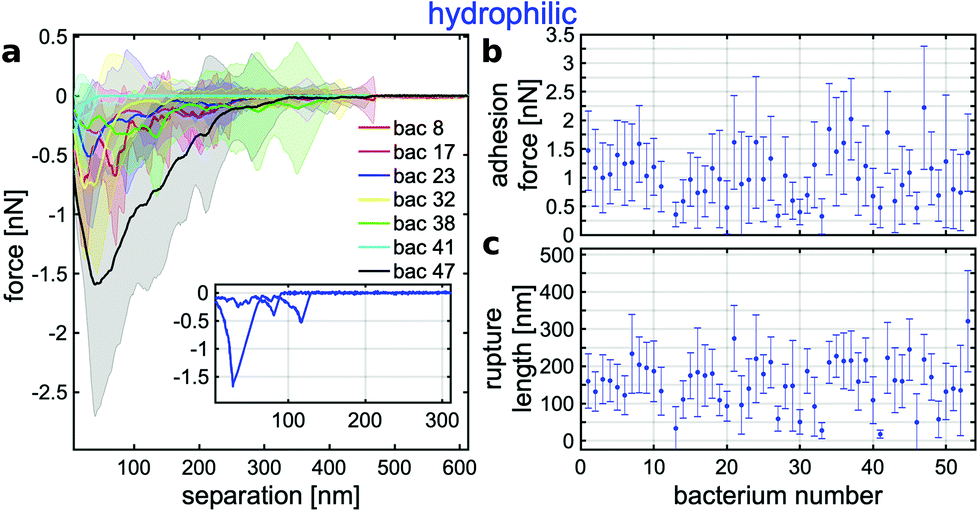 | ||
| Fig. 2 (a) Mean SCFS retraction curves (calculated as described in section 1.3) of 7 exemplary individual bacteria on the hydrophilic surface for a surface delay time of 5 s (shaded area is standard deviation). The inset depicts two exemplary force–distance curves of cell no. 23, whose mean curve is shown in blue in the main diagram. (b, c) Mean adhesion forces and rupture lengths extracted from single SCFS retraction curves of 52 cells (error bars are standard deviation). | ||
An in depth discussion follows in the next section in direct comparison to the results on hydrophobic surfaces.
 | ||
| Fig. 3 (a) Mean SCFS retraction curves (calculated as described in section 1.3) of 7 exemplary bacteria on the hydrophobic surface for 0 s surface delay time (shaded area is standard deviation and very small). The inset depicts two exemplary force–distance curves of cell no. 29, whose mean curve is shown in red in the main diagram. (b, c) Mean adhesion forces and rupture lengths extracted from single SCFS retraction curves of 64 cells (error bars are standard deviation). Note the different scales in this figure and Fig. 2 for the adhesion forces, but identical scale for the rupture lengths. | ||
To analyse the adhesion on hydrophobic surfaces in detail, Fig. 3a depicts – analogously to the data on hydrophilic surfaces – the mean retraction curves of several single cells. Here, every single cell features ‘cup-shaped’ retraction curves with a well-defined minimum and only a very small standard deviation (note the different scale of the adhesion force in comparison to the hydrophilic case). The low variability for different curves from one and the same cell is explicitly shown in the inset, where two repetitive curves with almost identical shapes are depicted. Hence, the variability on hydrophobic surfaces is mainly given from cell to cell, while on hydrophilic surfaces, the cell-to-cell variance is comparable to the variability between repetitive curves. Further, the mean adhesion forces on hydrophobic surfaces (see Fig. 3b) range from 5 to 70 nN with most error bars in the order of a few nN. Therefore, the adhesion force on hydrophobic surfaces seems highly cell specific, while it is highly stochastic on hydrophilic surfaces. The rupture lengths, however, vary on hydrophobic surfaces from repetition to repetition with the same cell (see Fig. 3c) and show very similar performance in magnitude and variability to the behaviour on hydrophilic surfaces. This will be discussed later.
In order to compare the adhesion properties of a typical population of bacteria on hydrophilic and hydrophobic surfaces, we computed mean retraction curves and relevant histograms of all cells measured (see Fig. 4). Interestingly, for both surfaces, the mean retraction curves look very similar but feature completely different force scales (see Fig. 4b).|| This also manifests in the adhesion force histograms: on hydrophilic surfaces, typical adhesion forces are hundreds of pN up to several nN (see Fig. 4c and d) while on hydrophobic surfaces, they are several tens of nN. Their mean values differ by a factor of 25 (1.1(0) nN vs. 28(2) nN).
 | ||
| Fig. 4 (a, c, d) Probability density histograms of rupture lengths and adhesion force of each tested cell on hydrophilic (blue) and hydrophobic (red) surfaces (where histograms overlap, a mixed colour is displayed). (b) Corresponding mean retraction curve (shaded area is standard deviation) calculated from all tested cells calculated as described in section 1.3. (Note the different scales of the y-axes!) | ||
As already mentioned before, the rupture lengths differ much less than the adhesion forces: although, in the rupture length histograms (Fig. 4a), a clear shift to higher rupture lengths on hydrophobic surfaces is observed, the mean rupture lengths differ only by a factor of about 1.5 (from 160(2) nm on hydrophilic surfaces, to 242(2) nm on hydrophobic surfaces). Especially, the tails in both histograms extend to remarkably high rupture lengths. Such high rupture lengths, with values even bigger than 400 nm, are quite notable for surfaces that are unconditioned with biological material. On such surfaces, cell wall macromolecules can just tether non-specifically to the surface. If we consider for proteins 0.36 nm length contribution per amino acid as usually done in single molecule force spectroscopy experiments,42,45 these rupture lengths are comparable to the fully unfolded length of different S. aureus surface proteins, like Serine-aspartate repeat-containing protein C (SdrC, 360 nm45), clumping factor A (ClfA, 285 nm46), and S. aureus surface protein G (SasG, 505 nm47).** Forces to unfold proteins are typically 0.1–0.4 nN,48–50 but are specific to the structure and the pulling speed. In the literature only values are provided for SasG whose E and G5 domains have unfolding forces of 0.25 nN and 0.42 nN, respectively,50 but may depend on the Zn2+ concentration.51 However, the large rupture lengths might also result from the tethering of other cell surface macromolecules like glycolipids (teichoic acids) or extracellular polysaccharides, such as poly-N-acetyl-D-glucosamine (PNAG). This could by analysed in future studies with specific knock-out mutants of S. aureus SA113.
When directly comparing typical retraction curves on hydrophilic and hydrophobic surfaces (Fig. 5a and b), it seems reasonable that single molecule tethering is involved on both types of abiotic surfaces. These show – besides the already mentioned fundamental differences in the curve shapes – also similar features. On hydrophilic surfaces, the retraction curves show several peaks, which resemble partial force stretch curves of worm-like chain polymers (‘WLC-like peaks’), of varying magnitude (Fig. 5a and b). Such WLC behaviour is commonly observed in single force spectroscopy measurements for various proteins.48–50 However, our experiments show most likely the stretching of several macromolecules at the same time, generating more complicated retraction curves. On hydrophobic surfaces, we also often observe single peaks at separations close to the rupture length. These show similar signatures as the retraction curves on hydrophilic surfaces resembling WLC behaviour (inset in Fig. 5a). This marks the adhesion process as a stochastic tethering of individual macromolecules to both surfaces.
 | ||
| Fig. 5 Force-separation curves of two repeated SCFS experiments with one bacterium (per surface) on a hydrophobic (a) and a hydrophilic surface (b) to illustrate similarities and differences. | ||
 | ||
| Fig. 6 (a, c, d) Probability density histograms of snap-in separation and snap-in force of each tested cell on hydrophilic (blue) and hydrophobic (red) surfaces (where histograms overlap, a mixed colour is displayed). (b) Corresponding mean approach curve (shaded area is standard deviation) calculated from all tested cells calculated as described in section 1.3. | ||
In summary, our experimental curves hint to stochastic binding of a rather low number of macromolecules on hydrophilic surfaces, leading to a strong surface delay time dependence and a high variance between individual curves that is comparable to the cell-to-cell variance. A low number of individual macromolecules exert forces in the low nN range and detach at separations varying from tens of nm to remarkably hundreds of nm. On hydrophobic surfaces in contrast, the retractions curves show very low variance between individual curves, adhesion forces of several tens of nN, and rupture lengths in the order of several 100 nm.
In a first step to validate whether these results can be generalized and do not only hold true for the tested strain of S. aureus SA113, we probed two more clinically relevant S. aureus strains, the USA300 CA-MRSA derivative JE2 and the HA-MRSA strain N315, with a smaller number of individuals. The results are given in the ESI† and support our conclusions stated above.
2.2. Monte Carlo simulations
To substantiate the conclusions and hypotheses drawn from the experiments, we performed Monte Carlo (MC) simulations of the bacterial adhesion process, in which the bacterium is modelled as a sphere decorated with thermally fluctuating macromolecules. These molecules bind individually to the surface after overcoming a potential barrier. Once bound to the surface, the potential depth quantifies their bonding strength. Further details and parameter discussion is provided in section 1.4 and the ESI†.As can be seen in Fig. 7, our simulations are able to reproduce the experimental mean SCFS retraction curves on hydrophilic as well as on hydrophobic surfaces with biological reasonable parameters. For both surfaces, the parameters for the cell wall macromolecules were kept the same (see ESI†) and only the potential depth and barrier height were changed. The simulated mean retraction curve (black line) in Fig. 7 features the correct force scale as well as the right rupture lengths. In addition, the strong surface delay time dependence on hydrophilic surfaces can be reproduced (Fig. 7a and b). However, especially on hydrophobic surfaces, the standard deviation in the simulation is much lower than in the experiments meaning that the variability between individual cells is not represented in the simulations (Fig. 7c). This lack of diversity is the result of a fixed high number of macromolecules on the cell surface, that use the same simple force stretch model with identical binding energy. In order to increase the quantitative agreement, a more complete characterisation of the involved surface macromolecules would be necessary. This is, however, beyond the scope of this paper. In addition, the introduction of nano domains of proteins on the cell surface (that are for example suggested for Serine-aspartate repeat-containing protein G (SdrG) on S. epidermis and Collagen adhesin (Cna) protein on S. aureus) would increase the cell to cell variability in our model.42,52
 | ||
| Fig. 7 Comparison of the simulated mean retraction curves (black, with standard deviation as shaded area) that match the experimental results (purple, blue, red). We used 17 kBT (0 kBT) for the potential barrier and 50 kBT (20 kBT) binding energy for hydrophilic (hydrophobic) surfaces. Note the different force scale of the right panel in comparison with the others and the remarkably small standard deviation. | ||
Since the bacteria used are grown under the same conditions, cell-individual surface properties should be mainly responsible for the different adhesion characteristics. To this end we analysed the influence of the potential depth and barrier on individual and mean retraction curves of specific bacteria (Fig. 8). First we observe, for low potential barriers and sufficiently high potential depths, always cup-shaped retraction curves. All the repetitions with the same cell (blue, red, green line) show the same signature and, as expected, bigger potential depths increase the adhesion force. Second, if we increase the potential barrier, we observe a decrease in adhesion force and individual ‘WLC-like peaks’ which vary from repetition to repetition. The lack of variability in repetitions, for low potential barriers, matches the experimental behaviour on hydrophobic surfaces. The drop in adhesion force, the partial WLC behaviour and the strong increase in variability of repetitions matches the observed behaviour on hydrophilic surfaces.
 | ||
| Fig. 8 Simulation results: single (coloured) and mean retraction curves (black) for different potential depth V and potential barriers H and fixed bacteria. Surface delay time is 5 s. | ||
To gain a deeper understanding in the change of adhesion behaviour with varying potential depth and barrier height, we counted the number of macromolecules that in fact bind to the surface and investigated how surface delay time affects this binding (Fig. 9). For low potential barriers, additional surface delay time does not lead to an considerable increase in bound macromolecules. Yet, for high barriers, a substantial increase is observed. This increase in attached molecules leads to an increase in adhesion force (for the corresponding mean retraction curves, see ESI†) which matches the experimental behaviour on hydrophilic surfaces. Furthermore, for low potential barriers, a substantial amount of available macromolecules binds without any delay time, rendering additional binding with more delay time negligible. This leads to only a weak dependence of the adhesion force on surface delay time, like we have observed in the experiments on hydrophobic surfaces. For higher barriers, only few macromolecules bind to the surface, corroborating the notion that indeed on hydrophilic surfaces few, and on hydrophobic surfaces many macromolecules are responsible for adhesion.
 | ||
| Fig. 9 Simulation results: ensemble mean of the number of attached macromolecules for different potential depth V and barriers H, extracted from the first 10 retractions of 20 simulated cells. Shaded area is standard deviation. While blue solid lines indicate 5 s of surface delay time, purple dashed lines indicate 0 s. | ||
In summary, the simulations provide evidence that a large number of macromolecules bind to hydrophobic surfaces, while only a few macromolecules are stochastically selected to bind to hydrophilic surfaces. This leads to almost identical shapes of consecutive curves on hydrophobic surfaces and a high variability of consecutive curves on hydrophilic surfaces. Our model suggest that the reason for the different number of tethering molecules is that on hydrophobic surfaces, many weakly binding macromolecules can attach quickly without hindrances, while on hydrophilic surfaces, a potential barrier selects only few but strongly binding macromolecules.
Although the origin of the potential barrier is unclear, we propose that it stems from conformational changes of the macromolecules and/or disturbances of the hydrogen bond network close to the surface. The latter seems reasonable because hydrophobic interactions are non-directional and fast while hydrogen-bonds are directional and need time to form. This depends, however, on the structure of the involved macromolecules and water network.
3. Conclusions
In conclusion, we have analysed the adhesion characteristics of a high number of force–distance curves of single S. aureus cells to hydrophilic and hydrophobic surfaces. The experimental data could be quantitatively reproduced by MC simulations of the adhesion process using reasonable parameters for the surface potential as well as for the involved macromolecules.Together, our results can explain bacterial adhesion to abiotic surfaces: S. aureus cells adhere to hydrophobic surfaces by many weakly binding macromolecules, while they adhere to hydrophilic surfaces via few, but strongly binding macromolecules. Tethering of many macromolecules on hydrophobic surfaces leads to high adhesion forces and low variability repetitive SCFS retraction experiments with the same cell. In contrast, a potential barrier on hydrophilic surfaces selects only a few strongly binding macromolecules which leads to high variability between repetitive measurements. The origin of this barrier is an interesting subject for future research.
We expect that our results hold true also for other types of bacteria, especially Gram-positive bacteria where no additional diffusion dynamics of macromolecules in the membrane play a role. Therefore, they can have important implications for applications where bacterial adhesion is unwanted: the remarkable difference of binding strength for hydrophilic and hydrophobic surfaces could be used in order to reduce considerably the binding affinity of bacteria to surfaces. Moreover, our results can also help to predict the adhesive strength of bacteria to different types of smooth substrates of which only the surface energies are known. Vice versa, with the help of our results, single adhesion curves on chemically unknown (conditioned) surfaces may be sufficient to derive statements about the substrates’ surface energies and/or involved interactions.
Conflicts of interest
There are no conflicts to declare.Acknowledgements
The authors thank Dr. Thomas Faidt (Saarland University) for the artwork in the TOC graphic. This work was supported by the German Research Foundation (DFG) within the collaborative research centre SFB 1027 (Projects B1 and B2).References
- F. D. Lowy, N. Engl. J. Med., 1998, 339, 520–532 CrossRef CAS.
- R. Yongsunthon, V. G. Fowler, B. H. Lower, F. P. Vellano, E. Alexander, L. B. Reller, G. R. Corey and S. K. Lower, Langmuir, 2007, 23, 2289–2292 CrossRef CAS.
- D. Linke and A. Goldman, Bacterial Adhesion: Chemistry, Biology and Physics, Springer Science & Business Media, 2011, vol. 715 Search PubMed.
- N. Thewes, A. Thewes, P. Loskill, H. Peisker, M. Bischoff, M. Herrmann, L. Santen and K. Jacobs, Soft Matter, 2015, 11, 8913–8919 RSC.
- L. Hall-Stoodley, J. W. Costerton and P. Stoodley, Nat. Rev. Microbiol., 2004, 2, 95 CrossRef CAS.
- H.-C. Flemming and J. Wingender, Nat. Rev. Microbiol., 2010, 8, 623 CrossRef CAS.
- F. Götz and G. Peters, Infections Associated with Indwelling Medical Devices, American Society of Microbiology, 3rd edn, 2000, pp. 55–88 Search PubMed.
- A. L. Chamis, G. E. Peterson, C. H. Cabell, G. R. Corey, R. A. Sorrentino, R. A. Greenfield, T. Ryan, L. B. Reller and V. G. Fowler Jr., Circulation, 2001, 104, 1029–1033 CrossRef CAS.
- E. Mylonakis and S. B. Calderwood, N. Engl. J. Med., 2001, 345, 1318–1330 CrossRef CAS.
- M. A. Olsen, J. Mayfield, C. Lauryssen, L. B. Polish, M. Jones, J. Vest and V. J. Fraser, J. Neurosurg. Spine, 2003, 98, 149–155 Search PubMed.
- R. O. Darouiche, N. Engl. J. Med., 2004, 350, 1422–1429 CrossRef CAS.
- S. Lax, N. Sangwan, D. Smith, P. Larsen, K. M. Handley, M. Richardson, K. Guyton, M. Krezalek, B. D. Shogan and J. Defazio, et al. , Sci. Transl. Med., 2017, 9, eaah6500 CrossRef.
- C. R. Arciola, D. Campoccia, P. Speziale, L. Montanaro and J. W. Costerton, Biomaterials, 2012, 33, 5967–5982 CrossRef CAS.
- M. Razavi, D. S. Shepard, J. A. Suaya and W. B. Stason, PLoS One, 2014, 9, e110133 CrossRef.
- S. Kang and M. Elimelech, Langmuir, 2009, 25, 9656–9659 CrossRef CAS.
- N. Thewes, P. Loskill, P. Jung, H. Peisker, M. Bischoff, M. Herrmann and K. Jacobs, Beilstein J. Nanotechnol., 2014, 5, 1501–1512 CrossRef.
- Y. F. Dufrêne, Trends Microbiol., 2015, 23, 376–382 CrossRef.
- S. Aguayo, N. Donos, D. Spratt and L. Bozec, Nanotechnology, 2015, 26, 062001 CrossRef CAS.
- G. Mitchell, C.-A. Lamontagne, E. Brouillette, G. Grondin, B. G. Talbot, M. Grandbois and F. Malouin, Mol. Microbiol., 2008, 70, 1540–1555 CrossRef CAS.
- E. S. Ovchinnikova, B. P. Krom, H. J. Busscher and H. C. van der Mei, BMC Microbiol., 2012, 12, 281 CrossRef CAS.
- P. Herman-Bausier, S. El-Kirat-Chatel, T. J. Foster, J. A. Geoghegan and Y. F. Dufrêne, mBio, 2015, 6, e00413–e00415 CrossRef CAS.
- T. Vanzieleghem, P. Herman-Bausier, Y. F. Dufrene and J. Mahillon, Langmuir, 2015, 31, 4713–4721 CrossRef CAS.
- C. Spengler, N. Thewes, F. Nolle, T. Faidt, N. Umanskaya, M. Hannig, M. Bischoff and K. Jacobs, J. Mol. Recognit., 2017, 30, e2615 CrossRef.
- C. Spengler, N. Thewes, P. Jung, M. Bischoff and K. Jacobs, Nanoscale, 2017, 9, 10084–10093 RSC.
- C. Berne, C. K. Ellison, A. Ducret and Y. V. Brun, Nat. Rev. Microbiol., 2018, 16, 616–627 CrossRef CAS.
- F. Rupp, L. Liang, J. Geis-Gerstorfer, L. Scheideler and F. Hüttig, Dent. Mater., 2018, 34, 40–57 CrossRef CAS.
- Z. Wang, M. Elimelech and S. Lin, Environ. Sci. Technol., 2016, 50, 2132–2150 CrossRef CAS.
- A. Beaussart, S. El-Kirat-Chatel, P. Herman, D. Alsteens, J. Mahillon, P. Hols and Y. F. Dufrêne, Biophys. J., 2013, 104, 1886–1892 CrossRef CAS.
- R. M. A. Sullan, J. K. Li, P. J. Crowley, L. J. Brady and Y. F. Dufrêne, ACS Nano, 2015, 9, 1448–1460 CrossRef CAS.
- B. Reiser, L. González-García, I. Kanelidis, J. Maurer and T. Kraus, Chem. Sci., 2016, 7, 4190–4196 RSC.
- K. J. Si, Y. Chen, Q. Shi and W. Cheng, Adv. Sci., 2018, 5, 1700179 CrossRef.
- M. Bellion, L. Santen, H. Mantz, H. Hähl, A. Quinn, A. Nagel, C. Gilow, C. Weitenberg, Y. Schmitt and K. Jacobs, J. Phys.: Condens. Matter, 2008, 20, 404226 CrossRef.
- M. Lessel, O. Bäumchen, M. Klos, H. Hähl, R. Fetzer, M. Paulus, R. Seemann and K. Jacobs, Surf. Interface Anal., 2015, 47, 557–564 CrossRef CAS.
- C. Weidenmaier, A. Peschel, Y.-Q. Xiong, S. A. Kristian, K. Dietz, M. R. Yeaman and A. S. Bayer, J. Infect. Dis., 2005, 191, 1771–1777 CrossRef CAS.
- I. Maxe, C. Rydén, T. Wadström and K. Rubin, Infect. Immun., 1986, 54, 695–704 CrossRef CAS.
- A. Peschel, M. Otto, R. W. Jack, H. Kalbacher, G. Jung and F. Götz, J. Biol. Chem., 1999, 274, 8405–8410 CrossRef CAS.
- S. Bur, K. T. Preissner, M. Herrmann and M. Bischoff, J. Invest. Dermatol., 2013, 133, 2004–2012 CrossRef CAS.
- N. Thewes, P. Loskill, C. Spengler, S. Hümbert, M. Bischoff and K. Jacobs, Eur. Phys. J. E: Soft Matter Biol. Phys., 2015, 38, 140 CrossRef.
- C. Spengler, F. Nolle, J. Mischo, T. Faidt, S. Grandthyll, N. Thewes, M. Koch, F. Müller, M. Bischoff and M. A. Klatt, et al. , Nanoscale, 2019, 11, 19713–19722 RSC.
- A. Beaussart, P. Herman, S. El-Kirat-Chatel, P. N. Lipke, S. Kucharíková, P. Van Dijck and Y. F. Dufrêne, Nanoscale, 2013, 5, 10894–10900 RSC.
- G. Zeng, T. Müller and R. L. Meyer, Langmuir, 2014, 30, 4019–4025 CrossRef CAS.
- P. Herman, S. El-Kirat-Chatel, A. Beaussart, J. A. Geoghegan, T. J. Foster and Y. F. Dufrêne, Mol. Microbiol., 2014, 93, 356–368 CrossRef CAS.
- P. Herman, S. El-Kirat-Chatel, A. Beaussart, J. A. Geoghegan, T. Vanzieleghem, T. J. Foster, P. Hols, J. Mahillon and Y. F. Dufrêne, Langmuir, 2013, 29, 13018–13022 CrossRef CAS.
- H. C. van der Mei, M. Rustema-Abbing, J. de Vries and H. J. Busscher, Appl. Environ. Microbiol., 2008, 74, 5511–5515 CrossRef CAS.
- C. Feuillie, C. Formosa-Dague, L. M. C. Hays, O. Vervaeck, S. Derclaye, M. P. Brennan, T. J. Foster, J. A. Geoghegan and Y. F. Dufrêne, Proc. Natl. Acad. Sci. U. S. A., 2017, 114, 3738–3743 CrossRef CAS.
- P. Herman-Bausier, C. Labate, A. M. Towell, S. Derclaye, J. A. Geoghegan and Y. F. Dufrêne, Proc. Natl. Acad. Sci. U. S. A., 2018, 115, 5564–5569 CrossRef CAS.
- R. M. Corrigan, D. Rigby, P. Handley and T. J. Foster, Microbiology, 2007, 153, 2435–2446 CrossRef CAS.
- M. Rief, M. Gautel, F. Oesterhelt, J. M. Fernandez and H. E. Gaub, Science, 1997, 276, 1109–1112 CrossRef CAS.
- F. Oesterhelt, D. Oesterhelt, M. Pfeiffer, A. Engel, H. E. Gaub and D. J. Müller, Science, 2000, 288, 143–146 CrossRef CAS.
- D. T. Gruszka, F. Whelan, O. E. Farrance, H. K. H. Fung, E. Paci, C. M. Jeffries, D. I. Svergun, C. Baldock, C. G. Baumann, D. J. Brockwell, J. R. Potts and J. Clarke, Nat. Commun., 2015, 6, 7271 CrossRef CAS.
- C. Formosa-Dague, P. Speziale, T. J. Foster, J. A. Geoghegan and Y. F. Dufrêne, PNAS, 2016, 113, 410–415 CrossRef CAS.
- P. Herman-Bausier, C. Valotteau, G. Pietrocola, S. Rindi, D. Alsteens, T. J. Foster, P. Speziale and Y. F. Dufrêne, mBio, 2016, 7, e01529–e01516 CrossRef CAS.
Footnotes |
| † Electronic supplementary information (ESI) available. See DOI: 10.1039/D0NR03134H |
| ‡ These authors contributed equally to this work. |
| § Note that most of the positive parts of the shaded area (representing the standard deviation) are a consequence of the symmetrical display of the standard deviation. The measured values are – except for the positive part of the baseline noise – never positive and, therefore, not symmetrical around the mean value. |
| ¶ Notably, depth and position of the minima of the mean curves do not match the corresponding mean values in the histograms because the force-separation curves are highly non-monotonic (see Fig. 5b). As a consequence, the minimum of the mean curve is in general not the same as the mean of the minima of each individual curve. In other words, the mean of the minima does not take into account the position of the minimum while the mean curve does. |
| || That the standard deviation on hydrophilic surfaces seems to extend to higher separations as on the hydrophobic surfaces is just an optic effect of the strongly different force scales. |
| ** Note that the fully unfolded length of the protein structure does not necessarily correspond to the rupture length; for details, see the ESI.† |
| This journal is © The Royal Society of Chemistry 2020 |