 Open Access Article
Structure–property relationships of cellulose nanofibril hydro- and aerogels and their building blocks†
Mario
Arcari
 a,
Robert
Axelrod
a,
Jozef
Adamcik
a,
Stephan
Handschin
a,
Antoni
Sánchez-Ferrer
a,
Robert
Axelrod
a,
Jozef
Adamcik
a,
Stephan
Handschin
a,
Antoni
Sánchez-Ferrer
 a,
Raffaele
Mezzenga
 *ab and
Gustav
Nyström
 *ac
*ac
aETH Zurich, Department of Health Sciences and Technology, Schmelzbergstrasse 9, 8092 Zurich, Switzerland. E-mail: raffaele.mezzenga@hest.ethz.ch
bETH Zurich, Department of Materials, Wolfgang-Pauli-Strasse 10, 8093 Zurich, Switzerland
cEMPA, Laboratory for Cellulose & Wood Materials, Überlandstrasse 129, 8600 Dübendorf, Switzerland. E-mail: gustav.nystroem@empa.ch
First published on 15th May 2020
Abstract
As abundant and renewable materials with excellent mechanical and functional properties, cellulose nanomaterials are utilized in advanced structural, optical and electronic applications. However, in order to further improve and develop new cellulose nanomaterials, a better understanding of the interplay between the self-assembled materials and their building blocks is crucial. This paper describes the structure–property relationships between cellulose nanofibrils (CNFs) and their resulting self-assembled structures in the form of hydrogels and aerogels. Rheological experiments revealed that the transition from viscous to elastic state with the corresponding evolution of the properties of the CNF dispersion depends on the aspect ratio and can be described in terms of the dynamic overlap concentration. The elastic shear modulus was dependent on the aspect ratio at very low CNF concentrations, reaching a plateau, where only the concentration of CNFs was relevant. This transition point in shear modulus was exploited to determine the mesh size of the fibril network, which was found to be in excellent agreement with predictions from scaling arguments. These findings highlight the possibility to tune the self-assembled materials response directly from the bottom-up by the CNF particle structure and thus, suggest new assembly routes starting directly from the CNF design.
Introduction
Super lightweight aerogels from renewable resources are of general scientific and industrial interest for a wide range of applications including thermal insulation, filtration, catalysis and gas sorption.1–3 Due to the abundance of cellulose originating from plant materials and the increasing availability as a result of the improvements and upscaling of the production of cellulose nanomaterials, this natural polymer has a large potential. This potential has already been recognized and led to a vast amount of research in the field of cellulose materials, providing numerous new applications and accessing more sustainable production methods.4–7 In order to further develop these materials and optimize functionality, it is however critical to better understand the mechanism of self-assembly of the anisotropic nanoparticles into materials with different hierarchical levels.8The formation of porous cellulose materials can be achieved in different ways, where the most studies use freeze drying and supercritical CO2 drying of aqueous cellulose nanoparticle dispersions to obtain cryo- and aerogels, respectively.6,9–13 Pores of cryogels are templated by the formation of ice crystals and can, depending on the control of the freezing process, show lamellar-like or cellular organization. Instead, for aerogels, the network structure is built by a physical or chemical crosslinking step to form hydrogels before solvent exchange and supercritical CO2 drying. In this case, concentration and particle properties, such as aspect ratio and surface charge density, are of significance for the network formation. Aqueous nanocellulose dispersions are typically stabilized by electrostatic repulsion coming from deprotonated acidic groups, such as carboxylates or sulfates, on the fibril surface at neutral pH. Protonation or screening of the surface charges due to addition of salt destabilizes the colloidal dispersions and a physical network can be formed.6,14–19 Rheology provides a facile option to compare the properties of dispersions as well as hydrogels, and, in combination with the knowledge of the nanoparticle characteristics, allows insight into structure–property relationships at the different length scales.19–22
The recent focus of nanocellulose aerogel research has been primarily on pioneering applications, whereas the fundamental understanding of the hydrogel- and aerogel-formation mechanisms was less emphasized. Recently gained knowledge indicates, however, that the source material out of which the nanoparticles are produced influences the properties of the resulting materials more than initially assumed.23 Taking this understanding into account, a systematic investigation of the correlation between the properties of single fibrils and the formation and properties of self-assembled higher order systems is highly relevant and still missing.
Saito and Isogai developed a protocol to produce aqueous CNF dispersions using TEMPO-mediated oxidation that, at optimal conditions, yields transparent dispersions with individualized CNFs.24 Though successful at the lab scale, upscaling this process to make it accessible for industry will likely require compromises in material properties in favour of economic feasibility.25
In this study, we investigated the formation of physical networks in nanocellulose hydrogels and the resulting aerogels after supercritical CO2 drying, while systematically altering CNF properties such as length and charge density. Additionally, we compared the influence of cellulose pulp concentration on the fibrillization and its impact on the CNF dispersion and the resulting hydrogel and aerogel structures. We studied the rheological behaviour of CNF dispersions as well as the physical network formation due to protonation and charge screening. Finally, the nanostructure of the aerogels was analysed by scanning electron microscopy (SEM) and atomic force microscopy (AFM).
We found that fibril properties are affected by the initial cellulose pulp concentration during sonication, which further impacts the optical properties of the resultant hydro- and aerogels. Furthermore, the dynamic overlap concentration not only described optimal fibrilization conditions, but also the transition from viscous to elastic behaviour of CNF dispersions. Investigating the gelation at different concentrations and analysing it using polymer physical considerations revealed a distinct dependency of the elastic shear modulus G′ on the aspect ratio of CNFs at low concentrations (0.06 wt%) and lower aspect ratios. At a fixed fibril concentration, the transition point of the aspect ratio, i.e., where the elastic shear modulus becomes independent of the aspect ratio, can further be used to approximate the mesh size of the CNF networks.
Results and discussion
Influence of initial pulp concentration on fibrillization
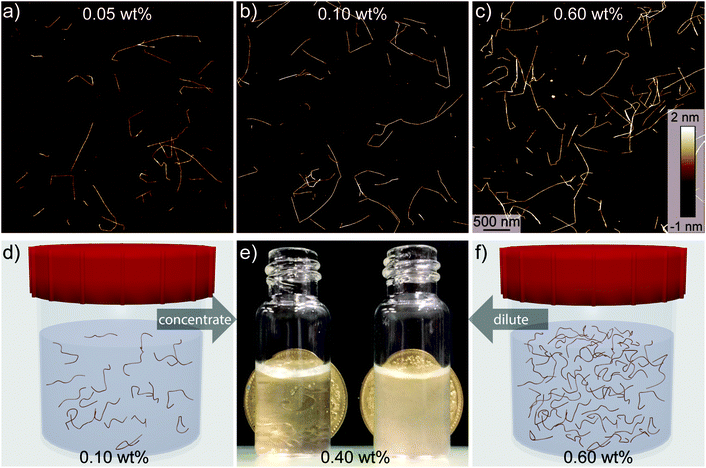
The major influences on mechanical disintegration of single CNFs are the energy input during the fibrillization and the repulsion between the individual CNFs due to their surface charge density.26–28 However, as can be observed in Fig. 1, the cellulose concentration during the mechanical disintegration also plays an important role. The fibrillization of the pulp into individualized objects worked well for cellulose concentrations below 0.1 wt% (Fig. 1a and b), whereas with increasing concentration the fibrillization seemed to be less efficient and bundles and aggregates remained in the dispersion (Fig. 1c). From these images, we can assume that the critical concentration for the fibrillization is somewhere between 0.1 and 0.6 wt%. On the macro scale, the boundary set by this critical concentration was observable too. Dispersions with a low cellulose concentration appeared transparent after sonication. But as soon as the concentration was higher than the critical concentration, the dispersions appeared turbid to the naked eye (Fig. 1e). Optical light microscopy observations revealed still intact cellulose fibers and large fragments, of which the majority could be removed by extensive centrifugation at 12![[thin space (1/6-em)]](https://www.rsc.org/images/entities/char_2009.gif) 000 rcf for 90 min (Fig. S1†). These findings go in line with turbidity measurements previously used for nanocellulose width estimations.29 Experimentally, the critical concentration can be determined through screening various CNF concentrations, which, however, is labour-intensive and a theoretical approach towards determining the critical concentration is desirable.
000 rcf for 90 min (Fig. S1†). These findings go in line with turbidity measurements previously used for nanocellulose width estimations.29 Experimentally, the critical concentration can be determined through screening various CNF concentrations, which, however, is labour-intensive and a theoretical approach towards determining the critical concentration is desirable.
At low concentrations, dispersed and distinct fibrils do not, or only weakly, interact. In polymer physics, this effect is described by the dilute and the semi-dilute regime, respectively. It is thought that the static properties of these two regimes are similar, whereas the dynamic properties of the semi-dilute regime is affected by interactions between particles.30 The transitions between the different regimes can be approximated by the excluded volume using the aspect ratio a. In the static state, the transition from the semi-dilute to the concentrated regime follows a−2.30 However, in the dynamic system, the transitions from dilute to semi-dilute ϕsd and further to concentrated regimes are shifted and the boundaries are described by the following equation:31
| a−2 ≪ ϕsd ≪ a−1 | (1) |
The onset of liquid crystalline interactions happens at the upper boundary, as predicted by Onsager based on excluded volume overlap. As the mechanical disintegration is a rather dynamic process, we consider overlap of excluded volume, and thus, we take the upper boundary as an approximate dynamic overlap concentration of the CNFs. Using eqn (1), one can calculate the dynamic overlap concentration C** in wt% as
 | (2) |
For the present study, six samples of CNFs with varying aspect ratio and surface charge density were investigated. Three samples originated from a bleached softwood paper pulp and three from an unbleached softwood paper pulp, respectively. Table 1 provides an overview of the fibril properties, where Lw is the average length-weighted length, L the average fibril length, a the aspect ratio, CD the charge density, deff the effective diameter and C** the dynamic overlap concentration.
| 3 bl | 5 bl | 10 bl | 3 ubl | 5 ubl | 10 ubl | |
|---|---|---|---|---|---|---|
| a Length weighted length. b The average height of all samples is taken (1.76 nm). c Conductometric titration of the TEMPO-pulp. d Described in ref. 32 Note: bl = bleached, ubl = unbleached, the number accounts the amount of NaClO per gram cellulose during the TEMPO-mediated oxidation. Data collected from ref. 27. | ||||||
| L w (nm) | 567 (15) | 486 (19) | 339 (10) | 819 (31) | 774 (31) | 520 (24) |
| L (nm) | 292 (11) | 272 (14) | 204 (8) | 454 (23) | 459 (24) | 268 (17) |
| a (Lw d−1)b | 323 (9) | 277 (11) | 193 (6) | 467 (18) | 441 (18) | 296 (14) |
CD![[thin space (1/6-em)]](https://www.rsc.org/images/entities/char_2009.gif) c (μmol g−1) c (μmol g−1) |
570 | 830 | 1120 | 300 | 650 | 940 |
| d eff (nm)d | 19.7 | 21.0 | 23.9 | 15.3 | 19.8 | 23.2 |
| Inverse kink densityd (nm) | 239 | 257 | 340 | 253 | 303 | 411 |
| C** (wt%) | 0.46 | 0.54 | 0.78 | 0.32 | 0.34 | 0.51 |
Effect of aspect ratio on CNF dispersion properties
Rheological experiments provide insights into the behaviour of the CNF dispersions under shear conditions. The aspect ratio and the surface charge density that define the effective diameter deff (Table 1) determine the excluded volume of the CNFs, a parameter which is important when the system becomes ordered due to shear alignment or increasing concentration.21,33Fig. 2 shows only weak effects of alignment due to increasing shear for 0.06 wt% CNFs, however, distinct shear thinning was found at 0.40 wt%, whereas increasing aspect ratio led to more viscous dispersions. The aspect ratio of CNFs was dependent on the charge density,27,28 meaning that the charge density determined how efficient the fibrils were mechanically individualized and then further broken into shorter fragments. Nevertheless, with the available data, it was difficult to distinguish the impact of these two properties (aspect ratio and charge density) separately. In Fig. 2, one observes a non-linear increase in viscosity with the aspect ratio, which could have been a result of the charge density. Furthermore, there were only small differences in viscosity between the transparent (individual CNF) and the turbid (branched CNF) dispersions (see Fig. S2†).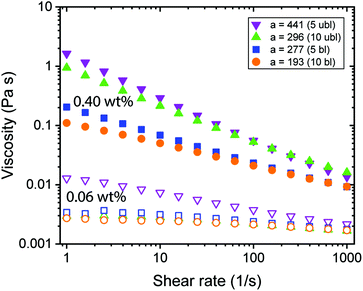 | ||
| Fig. 2 Rheological behaviour of CNF dispersions with different fibril aspect ratio a. Measurements were done using a double gap geometry with CNF dispersions of 0.40 wt% (full) and 0.06 wt% (empty). | ||
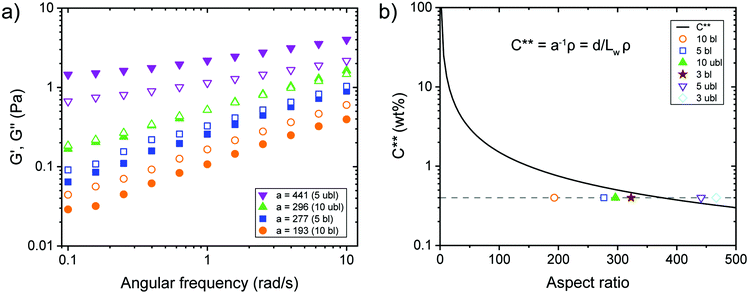
Dynamic frequency sweep experiments at 0.40 wt% without the addition of ions showed a transition from viscous behaviour for low aspect ratio fibrils to elastic properties while increasing the aspect ratio (Fig. 3a). For concentrated transparent dispersions with individualized CNF, this transition occurred at an aspect ratio a ≈ 300. Interestingly, the transition can be described using the dynamic overlap concentration C** determined by eqn (2) (Fig. 3b).
Rheological properties of hydrogels
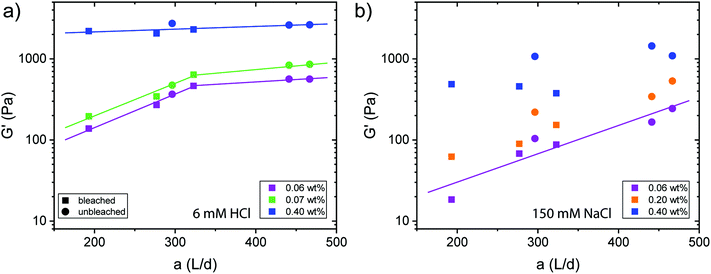
The destabilization of CNF dispersions and thereby formation of physical networks induced by protonation or charge screening using NaCl is extensively discussed in literature.18 CNFs with protonated surface charges can still form hydrogen bonds. These networks are therefore much stronger than those induced by charge screening, lacking a hydrogen bond forming capability (see Fig. 4 and S3† for plots of the G′ and G′′ values across the measured angular frequency ω range). The increase in elasticity with increasing concentration is also well described.20 Thereby, the elastic properties of the physical gels are generally dependent on the concentration and should be independent of the aspect ratio of its building blocks.34 However, approaching the minimal CNF concentration that still led to gel formation, the aspect ratio came into play. In Fig. 4a, we observe the evolution of a plateau for higher aspect ratio fibrils at low concentrations (0.06 and 0.07 wt%) as expected based on the fixed concentration. However, below the threshold of an aspect ratio of 320, the elasticity decreased. In this regime, the fibrils are too short to entangle and efficiently form a network. Thus, we suggest that the transition from the regime, where the elasticity is dependent on the aspect ratio towards the plateau (independent of aspect ratio) can be used to approximate the mesh size ξ of the network. For the fibrils to form an effective steric network, more than a single contact with one other fibril is needed. Thus, the entanglement length Lm of the fibrils at a certain concentration must be longer than the mesh size and can be assumed as the fibril contour length L at the transition point (kink in G′) in Fig. 4a. For stiff fibrils (Lp ≫ L), the mesh size ξ can be described by the following relation:35 | (3) |
Taking the contour length (L ≈ Lm) of the sample at the kink in G′ in Fig. 4a (L = 292 nm) and a persistence length of 2.5 μm (ref. 36) yields a mesh size of 81 nm. Comparing this result from experimentally determined values with scaling arguments for rod-like particles,  , where ϕ is the volume fraction of cellulose at 0.06 wt% (ϕ = 0.0004), a mesh size of 88 nm was in excellent agreement with the experimentally obtained value.
For physical networks induced by NaCl (Fig. 4b), the data becomes much more scattered than those obtained from the systems controlled by HCl (Fig. 4a). For 0.06 and 0.02 wt%, the data showed a dependency on the aspect ratio, indicating that the concentration was below the regime, where entangled networks are formed. However, from our data, it was difficult to distinguish whether 0.40 wt% dispersions already showed a plateau. Nevertheless, we can conclude that sodium ion induced gelation forms looser networks with mesh sizes probably larger than achieved by protonation. Significant differences in the rheological behaviour between transparent and turbid dispersions could however not be observed (Fig. S4†).
In the case of protonation, comparing the elastic shear modulus G′ with the aspect ratio and the charge density (Fig. S5†), we did not observe a difference in behaviour coming from the sample source.
In the following, the formation of the fibrillar networks and the impact of entanglement is discussed from a polymer physical perspective. As mentioned earlier, the contour length L needs to be longer than the mesh size ξ for a strong fibrillar network in order to provide enough crosslink points. Since ξ is mainly dependent on the concentration, low concentrations (L < ξ) and other factors, such as entanglement and the interparticle interactions, must impact the elastic properties of networks. As previously stated, we were not able to decouple the influence of contour length from charge density. Therefore, we focused on the entanglement. The ability of polymers to entangle is given by their flexibility as well as their chain length. Short fragments of semiflexible polymers behave like stiff anisotropic particles,37 whereas longer polymers are more flexible and able to entangle. In contrast to the ideal, semiflexible polymers assumed in theory, CNFs are known to have kinks that divide the fibrils into crystalline, mainly stiff segments. Kinks are defects in the crystalline morphology of the fibrils and there is still controversy whether kinks are fixed in position or spontaneously appearing.38–40 Nevertheless, kinks can be considered as sites of increasing entanglement and thus, lead to a decrease in excluded volume as well as to alignment of rod-like objects.
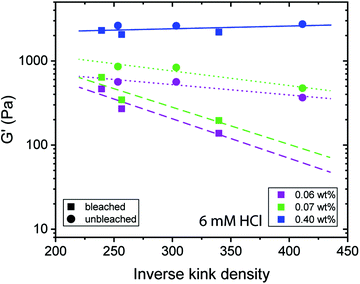
As previously reported, the inverse kink density is a measure that takes the fibril contour length and amount of kinks per fibril into account.32 An increasing inverse kink density results from fewer kinks within a given fibril contour and thus, a more rod-like CNF appearance. Fig. 5 shows that for low concentrations a lower inverse kink density (higher density of kinks) results in stronger gels, which is interpreted to result from the higher degree of entanglement in these networks. Moreover, Fig. 5 indicates a dependency of G′ on the CNF source, where the linear fits of the samples from the unbleached (dotted line) and bleached (dashed line) have a different slope. We can conclude that CNFs from the two sources have different capabilities for entanglement, where the CNFs produced from the unbleached pulp result in stronger gels at lower concentrations than the CNFs from the bleached source.
From hydrogel to aerogel
For macroscopic gelation, where gravity sets a threshold for self-supporting hydrogels, the inversion test allows investigating the ability of self-sustaining structures.18 In analogy to our rheological experiments, the inversion tests (Fig. S6†) suggested a dependency of the gelation on the aspect ratio, where the threshold for gelation was observed to be around a ≈ 280 for the addition of NaCl. In contrast to previous observations, the addition of either HCl or NaCl did not influence the translucency of the hydrogels.41Aerogels were produced by supercritical CO2 drying of hydrogels after solvent exchange to pure ethanol. A well-described problem in this process is shrinkage. Aerogels produced from low concentration CNF dispersions (0.05 wt%) shrunk around 50%, whereas we found only 30% shrinking for aerogels formed from higher concentrations (0.40 wt%). The shrinkage could be slightly reduced by increasing the time for solvent exchange and additional solvent exchange steps. Storage at room conditions led to further shrinkage of the aerogels within a few days, possibly due to capillary forces within the hygroscopic CNF network. Additionally, the aerogels showed poor resistance against skin contact, probably due to moisture uptake from the skin, which for the present formulations makes CNF aerogels unsuitable as a construction material. These unfavourable material properties made it impossible to conduct experiments to study the exact shrinkage and mechanical properties of the aerogels.
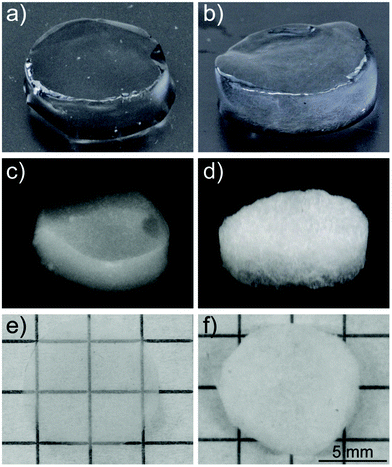
The optical properties of the aerogels obtained after supercritical CO2 drying were inherited from the precedent hydrogels (Fig. 6). Comparing the dimensions of the two aerogels (Fig. 6e and f), no difference in shrinkage was observed. Considering that the same initial concentration for the hydrogels was used, the two aerogels showed the same density (ρ ≈ 0.0057 g cm−3). Taking this into account, the difference in optical properties is quite remarkable. While the aerogels produced from the transparent CNF dispersions were highly transparent and homogeneous in their macroscopic appearance, the aerogels from turbid CNF dispersions strongly scattered light and showed a less homogeneous network structure.
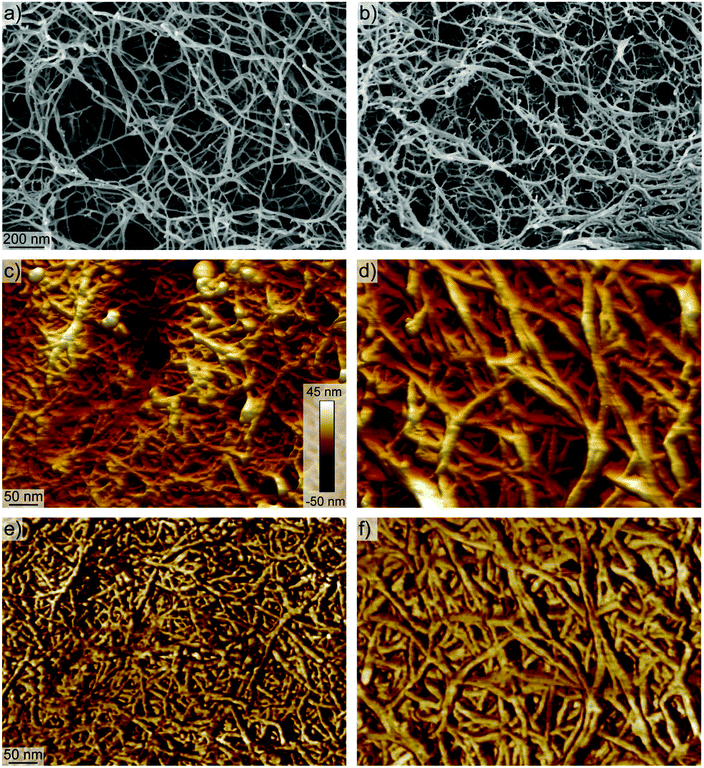
To better understand the network formation, we performed SEM and AFM on the different aerogels to study their respective morphology on the nanoscale. Both methods did not allow seeing significant variations between aerogels produced from different aspect ratio fibrils. However, there were differences between aerogels produced from transparent and turbid dispersions.
SEM revealed networks with mainly single fibrils that form the backbones of the network for the transparent aerogels (Fig. 7a). In contrast, the backbones of the network in turbid aerogels showed more aggregated fibrils with dangling ends that might originate from only partly individualized cellulose after the sonication of the pulp (Fig. 7b). Moreover, the AFM images in Fig. 7c–f reveal network backbones that are much broader than the network structure of the transparent aerogels. Additionally, the AFM images suggest a less dense network of the turbid aerogels compared to the transparent aerogels.
Conclusions
We have shown that the cellulose concentration has a major impact on the fibrillization of CNFs and that mechanical disintegration by sonication is limited by the dynamic overlap concentration C** of the CNF dispersion. The desired single CNF dispersions with a small amount of only partially fibrillated cellulose can be obtained in both the dilute, and the semi-dilute regime. In the perspective of an efficient upscaling of the highly individualized CNF production, our findings suggest possibilities for improvements of the current process, while maintaining transparency of the final gels and aerogels. Additionally, the dynamic overlap concentration describes well the transition from viscous to elastic rheological behaviour of the CNF dispersions depending on the aspect ratio.When it comes to the formation of gels, at very low concentrations, we observed deviations from general polymer physics, where G′ was dependent on the fibril length instead of the concentration. However, we were able to exploit this deviation to experimentally determine the mesh size to be 81 nm at a concentration of 0.06 wt%, which is in fine agreement with the 88 nm predicted from scaling arguments. Our results suggest a different ability of CNFs to form stable network depending on the cellulose source, where the fibrils from the unbleached source have a better capability to entangle and hence, build stronger networks.
Supercritical CO2 drying of the hydrogels was accompanied by significant shrinkage at room conditions due to the hygroscopic properties of CNFs, which indicates a need for further functionalization in order to stabilize the fibrillar networks to improve the applicability of the materials. The optical properties are mainly determined by the fibrillization process, where the properties are inherited by the preceding hydrogels. Differences between aerogels produced by CNF dispersions originating from bleached or unbleached source, as well as from variations in contour length, could not be observed by SEM and AFM.
The present study thus provides valuable insights towards tuning the properties of self-assembled CNF materials as a direct response to varying the production parameters of the CNF building-blocks. Combined with chemical or physical functionalization these results may lead to new bottom-up strategies to form highly functional pristine and hybrid CNF aerogel materials.
Experimental section
Synthesis of carboxylated cellulose nanofibrils
The exact protocol for the carboxylated CNF was published in an earlier work about the fibril characterization.27 In short, CNFs were prepared from bleached and unbleached never-dried sulfite softwood-dissolving pulp with a degree of polymerization of around 770 (Domsjö, Sweden) by TEMPO-mediated oxidation.24 For both sources, carboxylated pulp with three different charge densities were prepared using different amount of NaClO (1.5–10 mmol g−1 cellulose) as primary oxidant. The oxidized cellulose pulp was dispersed in 100 mL Milli-Q water (0.5 g L−1), ultra-sonicated (Hielscher UP200S, operated at 200 W, no interval, 20% amplitude, 7 mm probe, cooled with ice water) for 11 min, followed by centrifugation at 4000 rcf for 20 min to remove non-fibrillated cellulose aggregates. The charge density was determined by conductivity titration.Preparation of hydrogels and aerogels
Hydrogels were produced by directly mixing 150 μL of 1 M NaCl into 850 μL of the cellulose dispersion (0.072 wt%) in a mould (d = 1.6 cm). The mould was sealed with parafilm and left to gel overnight. Alternatively, 940 μL of the dispersion (0.065 wt%) was mixed with 60 μL 0.1 M HCl.An alternative way for hydrogel formation was by diffusion. A mould filled with 1 mL of the fibril dispersion (0.061 wt%) was dipped into a NaCl (150 mM) or an HCl (6 mM) solution. A dialysis membrane (Spectrum Laboratories Standard RC Tubing, 6–8 kDa cut off) and a Teflon membrane (Sigma-Aldrich, 1.0 μm × 47 mm), which prevented the gel from sticking to the cellulose-based dialysis membrane, were used to cover the mould to allow the diffusion of the salt and protons into the dispersion.
Hydrogels were carried over into a customized metal mesh cage and placed in 100 mL of 50% EtOH at 5 °C for 24 h for solvent exchange. The second and third exchanges took place in 97% EtOH (100 mL), and in 99% EtOH (50 mL), respectively, followed by supercritical CO2 drying (Tousimis, Autosamdri 931).
Rheological analysis of dispersions and gels
Fibril dispersions were analysed with a Physica MCR 5501 rheometer (Anton Paar) equipped with a double gap geometry (d = 2.67 cm). A solvent trap prevented evaporation. The temperature was held constant at 20 °C. The viscosity was measured with shear rates (![[small gamma, Greek, dot above]](https://www.rsc.org/images/entities/i_char_e0a2.gif) ) from 1000 to 1 s−1.
) from 1000 to 1 s−1.
The gelation was characterized after addition of NaCl (150 mM) or HCl (6 mM) using a cone-plate geometry (d = 2.5 cm, angle 2.006°) at 20 °C. Subsequently, the dispersion was oscillated in a time sweep experiment, keeping strain (γ) and angular frequency (ω) constant at 0.5% and 1 rad s−1, respectively, until the dynamic modulus reached a constant value. A frequency sweep from 100 to 0.1 rad s−1 at constant strain (γ = 0.5%), followed by a strain sweep from 0.1% to 100% at constant angular frequency (ω = 1 rad s−1) was performed.
Scanning electron microscopy
Small pieces of the aerogels were mounted on SEM aluminium stubs with conductive carbon paste. After drying, the samples were cut with a razor blade and sputter-coated with 4 nm of platinum/palladium (CCU-10, Safematic). SE-inlens images were recorded at a working distance of 4–5 mm with a scanning electron microscope (Merlin FE-SEM, Zeiss), operated at an accelerating voltage of 1.5 kV.Atomic force microscopy
To image the single CNFs, freshly cleaved mica was modified with 20 μL of 0.05% (3-aminopropyl)triethoxysilane (APTES) for 60 s to obtain a positively charged mica surface. A droplet of around 2 mg L−1 CNF dispersion was deposited on the mica and allowed adsorbing for 30 s before rinsing with Milli-Q water and drying with pressurized air. The AFM measurements (MultiMode VIII Scanning Probe Microscope, Bruker) were conducted in tapping mode under ambient conditions using commercial cantilevers (Bruker). The aerogels were deposited directly on the mica and scanned under ambient conditions.Conflicts of interest
There are no conflicts to declare.Acknowledgements
We thank Domsjö, Sweden for providing the paper pulp. M. A. and G. N. acknowledge funding from the Swiss National Science Foundation Ambizione Grant No. PZ00P2_168023/1. The authors acknowledge support of ScopeM/Swiss Federal Institute of Technology ETHZ.References
- S. Zhao, W. J. Malfait, N. Guerrero-Alburquerque, M. M. Koebel and G. Nyström, Angew. Chem., Int. Ed., 2018, 57, 7580 CrossRef CAS PubMed.
- A. Hajian, Z. Wang, L. A. Berglund and M. M. Hamedi, Adv. Electron. Mater., 2019, 5, 1800924 CrossRef.
- M. Miao, G. Wang, S. Cao, X. Feng, J. Fang and L. Shi, Phys. Chem. Chem. Phys., 2015, 17, 24901–24907 RSC.
- Y. Qing, R. Sabo, J. Y. Zhu, U. Agarwal, Z. Cai and Y. Wu, Carbohydr. Polym., 2013, 97, 226–234 CrossRef CAS PubMed.
- R. J. Moon, A. Martini, J. Nairn, J. Simonsen and J. Youngblood, Chem. Soc. Rev., 2011, 40, 3941–3994 RSC.
- K. J. De France, T. Hoare and E. D. Cranston, Chem. Mater., 2017, 29, 4609–4631 CrossRef CAS.
- H. Françon, Z. Wang, A. Marais, K. Mystek, A. Piper, H. Granberg, A. Malti, P. Gatenholm, P. A. Larsson and L. Wågberg, Adv. Funct. Mater., 2020, 1909383 CrossRef.
- E. Kontturi, P. Laaksonen, M. B. Linder, Nonappa, A. H. Gröschel, O. J. Rojas and O. Ikkala, Adv. Mater., 2018, 30, 1703779 CrossRef PubMed.
- H. Jin, Y. Nishiyama, M. Wada and S. Kuga, Colloids Surf., A, 2004, 240, 63–67 CrossRef CAS.
- N. Lavoine and L. Bergström, J. Mater. Chem. A, 2017, 5, 16105–16117 RSC.
- C. Aulin, J. Netrval, L. Wågberg and T. Lindström, Soft Matter, 2010, 6, 3298 RSC.
- M. Pääkkö, J. Vapaavuori, R. Silvennoinen, H. Kosonen, M. Ankerfors, T. Lindström, L. a. Berglund and O. Ikkala, Soft Matter, 2008, 4, 2492–2499 RSC.
- Y. Kobayashi, T. Saito and A. Isogai, Angew. Chem., Int. Ed., 2014, 53, 10394–10397 CrossRef CAS PubMed.
- A. B. Fall, S. B. Lindström, J. Sprakel and L. Wågberg, Soft Matter, 2013, 9, 1852 RSC.
- M. Chau, S. E. Sriskandha, D. Pichugin, H. Thérien-Aubin, D. Nykypanchuk, G. Chauve, M. Méthot, J. Bouchard, O. Gang and E. Kumacheva, Biomacromolecules, 2015, 16, 2455–2462 CrossRef CAS PubMed.
- M. Nordenström, A. Fall, G. Nyström and L. Wågberg, Langmuir, 2017, 33, 9772–9780 CrossRef PubMed.
- A. Gençer, J. Van Rie, S. Lombardo, K. Kang and W. Thielemans, Biomacromolecules, 2018, acs.biomac.8b00493 Search PubMed.
- A. B. Fall, S. B. Lindström, O. Sundman, L. ödberg and L. Wågberg, Langmuir, 2011, 27, 11332–11338 CrossRef CAS PubMed.
- P. Bertsch, A. Sanchez-Ferrer, M. Bagnani, S. Isabettini, J. Kohlbrecher, R. Mezzenga and P. Fischer, Langmuir, 2019, acs.langmuir.9b00281 Search PubMed.
- O. Nechyporchuk, M. N. Belgacem and F. Pignon, Biomacromolecules, 2016, 17, 2311–2320 CrossRef CAS PubMed.
- L. Geng, N. Mittal, C. Zhan, F. Ansari, P. R. Sharma, X. Peng, B. S. Hsiao and L. D. Söderberg, Macromolecules, 2018, 51, 1498–1506 CrossRef CAS.
- T. Saito, T. Uematsu, S. Kimura, T. Enomae and A. Isogai, Soft Matter, 2011, 7, 8804–8809 RSC.
- C. Schütz, J. Van Rie, S. Eyley, A. Gençer, H. van Gorp, S. Rosenfeldt, K. Kang and W. Thielemans, ACS Sustainable Chem. Eng., 2018, 6, 8317–8324 CrossRef.
- T. Saito, S. Kimura, Y. Nishiyama and A. Isogai, Biomacromolecules, 2007, 8, 2485–2491 CrossRef CAS PubMed.
- F. Rol, B. Karakashov, O. Nechyporchuk, M. Terrien, V. Meyer, A. Dufresne, M. N. Belgacem and J. Bras, ACS Sustainable Chem. Eng., 2017, 5, 6524–6531 CrossRef CAS.
- R. Hiraoki, Y. Ono, T. Saito and A. Isogai, Biomacromolecules, 2015, 16, 675–681 CrossRef CAS PubMed.
- M. Arcari, E. Zuccarella, R. Axelrod, J. Adamcik, A. Sánchez-Ferrer, R. Mezzenga and G. Nyström, Biomacromolecules, 2019, 20, 1288–1296 CrossRef CAS PubMed.
- R. Shinoda, T. Saito, Y. Okita and A. Isogai, Biomacromolecules, 2012, 13, 842–849 CrossRef CAS PubMed.
- M. Shimizu, T. Saito, Y. Nishiyama, S. Iwamoto, H. Yano, A. Isogai and T. Endo, Macromol. Rapid Commun., 2016, 37, 1581–1586 CrossRef CAS PubMed.
- M. Doi and S. F. Edwards, The theory of polymer dynamics, oxford university press, 1988, vol. 73 Search PubMed.
- C. J. S. Petrie, J. Nonnewton. Fluid Mech., 1999, 87, 369–402 CrossRef CAS.
- G. Nyström, M. Arcari, J. Adamcik, I. Usov and R. Mezzenga, ACS Nano, 2018, 12, 5141–5148 CrossRef PubMed.
- P. Bertsch, S. Isabettini and P. Fischer, Biomacromolecules, 2017, 18, 4060–4066 CrossRef CAS PubMed.
- P. G. de Gennes, Scaling Concepts in Polymer Physics, Cornell university press, 1979 Search PubMed.
- K. Kroy and E. Frey, Phys. Rev. E: Stat. Phys., Plasmas, Fluids, Relat. Interdiscip. Top., 1997, 55, 3092–3101 CrossRef.
- I. Usov, G. Nyström, J. Adamcik, S. Handschin, C. Schütz, A. Fall, L. Bergström and R. Mezzenga, Nat. Commun., 2015, 6, 7564 CrossRef CAS PubMed.
- Y. Cao, S. Bolisetty, J. Adamcik and R. Mezzenga, Phys. Rev. Lett., 2018, 120, 158103 CrossRef CAS.
- P. N. Ciesielski, R. Wagner, V. S. Bharadwaj, J. Killgore, A. Mittal, G. T. Beckham, S. R. Decker, M. E. Himmel and M. F. Crowley, Proc. Natl. Acad. Sci. U. S. A., 2019, 201900161 Search PubMed.
- G. Nyström, M. Arcari and R. Mezzenga, Nat. Nanotechnol., 2018, 13, 330–336 CrossRef PubMed.
- K. B. Smith, J.-N. Tisserant, S. Assenza, M. Arcari, G. Nyström and R. Mezzenga, Adv. Sci., 2019, 6, 1801540 CrossRef PubMed.
- R. Tanaka, T. Saito, T. Hänninen, Y. Ono, M. Hakalahti, T. Tammelin and A. Isogai, Biomacromolecules, 2016, 17, 2104–2111 CrossRef CAS PubMed.
Footnote |
| † Electronic supplementary information (ESI) available. See DOI: 10.1039/d0nr01362e |
| This journal is © The Royal Society of Chemistry 2020 |

