
 Open Access Article
 This Open Access Article is licensed under a
 Creative Commons Attribution 3.0 Unported Licence
Four-wave-mixing microscopy reveals non-colocalisation between gold nanoparticles and fluorophore conjugates inside cells†
Naya
Giannakopoulou
a,
Joseph B.
Williams
a,
Paul R.
Moody
b,
Edward J.
Sayers
 b,
Johannes P.
Magnusson
c,
Iestyn
Pope
a,
Lukas
Payne
a,
Cameron
Alexander
c,
Arwyn T.
Jones
b,
Wolfgang
Langbein
d,
Peter
Watson
a and
Paola
Borri
*a
b,
Johannes P.
Magnusson
c,
Iestyn
Pope
a,
Lukas
Payne
a,
Cameron
Alexander
c,
Arwyn T.
Jones
b,
Wolfgang
Langbein
d,
Peter
Watson
a and
Paola
Borri
*a
aSchool of Biosciences, Cardiff University, Museum Avenue, Cardiff CF10 3AX, UK. E-mail: borrip@cf.ac.uk
bSchool of Pharmacy and Pharmaceutical Sciences, Cardiff University, King Edward VII Ave, Cardiff CF10 3NB, UK
cSchool of Pharmacy, University of Nottingham, University Park, Nottingham NG72RD, UK
dSchool of Physics and Astronomy, Cardiff University, The Parade, Cardiff CF24 3AA, UK
First published on 11th February 2020
Abstract
Gold nanoparticles have been researched for many biomedical applications in diagnostics, theranostics, and as drug delivery systems. When conjugated to fluorophores, their interaction with biological cells can be studied in situ and real time using fluorescence microscopy. However, an important question that has remained elusive to answer is whether the fluorophore is a faithful reporter of the nanoparticle location. Here, our recently developed four-wave-mixing optical microscopy is applied to image individual gold nanoparticles and in turn investigate their co-localisation with fluorophores inside cells. Nanoparticles from 10 nm to 40 nm diameter were conjugated to fluorescently-labeled transferrin, for internalisation via clathrin-mediated endocytosis, or to non-targeting fluorescently-labelled antibodies. Human (HeLa) and murine (3T3-L1) cells were imaged at different time points after incubation with these conjugates. Our technique identified that, in most cases, fluorescence originated from unbound fluorophores rather than from fluorophores attached to nanoparticles. Fluorescence detection was also severely limited by photobleaching, quenching and autofluorescence background. Notably, correlative extinction/fluorescence microscopy of individual particles on a glass surface indicated that commercial constructs contain large amounts of unbound fluorophores. These findings highlight the potential problems of data interpretation when reliance is solely placed on the detection of fluorescence within the cell, and are of significant importance in the context of correlative light electron microscopy.
1. Introduction
Gold nanoparticles (AuNPs) are being widely investigated for applications in medical imaging,1,2 bio-sensing,3,4 drug delivery,5,6 photothermal and photodynamic therapy,7,8 owing to their small sizes, bio-compatibility, facile surface chemistry for bio-conjugation, and strong photothermal properties. Historically, AuNPs are well known to cell biologists for their widespread use as markers in electron microscopy (EM)9 due to their high electron density and thus large contrast. Notably, their strong and wavelength-selective optical absorption and scattering at the localised surface plasmon resonance (LSPR) provide a means to visualise them by optical microscopy techniques such as bright-field extinction10–12 (BFE), dark-field12,13 (DF), interferometric scattering14 (iSCAT), differential interference contrast15 (DIC), and phothothermal imaging16 (PI).A particularly interesting system is that of a AuNP–fluorophore conjugate, whereby a fluorescently labelled biomolecule of interest (e.g. a protein ligand, nucleotide, peptide, antibody) is attached onto the AuNP surface, and its uptake and intracellular fate is followed in situ in real time by fluorescence microscopy. These conjugates hold great potential in increasing our understanding of the cellular entry mechanisms of nanoparticles, how they are affected by the nanoparticle size,17 and what intracellular events occur subsequent to cell entry. These are key fundamental questions that need to be addressed if nanoparticles are to be developed as effective drug delivery systems. Using transmission electron microscopy, the same particle can be imaged correlatively, revealing the ultrastructure of the localization within the cell with nanometric resolution.
However, fluorescence microscopy suffers from limitations including fluorophore photobleaching, quenching in close proximity to a AuNP,18,19 cellular autofluorescence background, and in turn often cannot be quantitative. Moreover, an important question that has remained elusive to answer is whether the AuNP–fluorophore construct remains intact, as opposed to the fluorescently labelled molecule being unbound and trafficking independently from the AuNP. This is because optical means to visualize directly the AuNP via microscopy techniques such as BFE, DF, iSCAT, DIC and PI mentioned above are not background-free. Therefore, it is challenging with these methods to distinguish a single small AuNP against the endogenous scattering, absorption and phase contrast in a highly heterogeneous three-dimensional cellular environment. Notably, the question about the integrity of a AuNP–fluorophore construct is also difficult to answer via correlative light electron microscopy (CLEM), which requires sample processing that might degrade the fluorescence emission.9 CLEM analysis is further limited by the time lag between the observation of an intracellular event by live cell fluorescence microscopy and its correlation with EM acquisition post-fixation. A recent work specifically highlighted the lack of co-localisation between fluorescence emission and AuNPs on a commonly used CLEM probe, which was attributed to fluorescence quenching.20
Overall, direct investigations of the intracellular events that happen to AuNPs subsequent to their cellular entry are challenging, and even more so are studies able to independently track the intracellular fate of the nanoparticle core and that of its fluorescently labelled shell. Recently, Wu et al.21 synthesized a novel class of fluorescent quantum dot-nucleic acid conjugates and showed, owing to the fluorescence emission of the quantum dots, that these constructs are broken down over the 24 h time course of trafficking inside mouse endothelial cells, with the oligonucleotide fragments being recycled out of the cell while the nanoparticle core is not. Also recently, Liu et al.22 implemented a sequential dark-field wide-field fluorescence acquisition and investigated the intracellular trafficking of large (50 nm diameter) AuNPs conjugated to a fluorescently labelled DNA shell. They claimed no presence of fluorescence signal away from the AuNPs hence no apparent separation of the construct. However, the sequential acquisition, alongside the requirement for large particles to overcome the scattering background from the endogenous cell heterogeneity in dark field, make this technique not ideal.
In this work, we demonstrate the application of our recently developed four-wave-mixing (FWM) imaging modality23 to investigate a number of AuNP–fluorophore conjugate constructs and their integrity inside cells. The technique enables the detection of single bare AuNPs down to 10 nm diameter, background-free and with high 3D spatial resolution even in highly heterogeneous cellular environments, owing to the specific nature of the FWM process which is a non-linear light matter interaction with the free-electron gas in the gold metal. Four different constructs were investigated comprising a AuNP core (from 10 nm to 40 nm diameter) and a fluorescently labelled biomolecule attached onto the AuNP surface using four different strategies (see Table 1). Three were aimed at targeting clathrin-mediated endocytosis using the fluorescently-labelled ligand transferrin (Tf), while one construct contained a non-targeting fluorescently-labelled antibody resulting in non-specific uptake. To showcase the general applicability of the method, two different cell lines were used, namely human HeLa cells and murine 3T3-L1 cells. They were fixed at defined time points following nanoparticle cell entry, and imaged either using sequential fluorescence microscopy followed by FWM imaging, or by simultaneous correlative FWM/confocal fluorescence microscopy. In most cases, there was clear evidence of fluorescent molecules being detached from the AuNPs, and poor co-localisation of AuNPs with fluorophores. Fluorescence detection was also severely limited in some cases by photobleaching and autofluorescence background, rendering impossible to detect low amounts of fluorophores. In all cases, FWM unambiguously provided distinct images of AuNPs, both as individual particles and as clusters, with their precise 3D location inside cells.
| Name | AuNP core size | Shell | sequential labelling |
|---|---|---|---|
| 40 nm AuNP-SA-Bi-Tf(A647) | 40 nm | SA (cb) | Bi-Tf(A647) |
| 10 nm AuNP-SA(A488)-Bi-Tf(A647) | 10 nm | SA(A488) (ad) | Bi-Tf(A647) |
| 15 nm AuNP-PC-Tf(A488) | 15 nm | PC-Tf(A488) (cb) | No |
| 20 nm AuNP-PC-Ab(A647) | 20 nm | PC-Ab(A647) (cb) | No |
2. Experimental section
2.1 AuNP–fluorophore conjugates
The AuNP–fluorophore conjugate constructs utilised in this work are summarised in Table 1. The first construct, called 40 nm AuNP-SA-Bi-Tf(A647), consists of commercially available AuNPs of 40 nm diameter, covalently bound to streptavidin (40 nm AuNP-SA – InnovaCoat GOLD-Streptavidin 10OD, Innova Biosciences) which were subsequently bound to commercially-available biotinylated Tf (Bi-Tf, Sigma Aldrich) labelled in house with the fluorophore Alexa647 (Fisher Scientific). The generation of Bi-Tf(A647) was as per protocol described by Moody et al.24 Briefly, lyophilized biotinylated Tf (5 mg) suspended in 1 mL phosphate-buffered saline (PBS) pH 7.4, was added to 1 mg NHS-Alexa647 and reacted for 1 hour at room temperature to generate Bi-Tf(A647). The conjugate was purified from unreacted Alexa647 into PBS pH 7.4 using a G-50 sephadex gel filtration column (Life Technologies, Paisley, UK). To avoid aggregation and lack of functionality of the Tf, a sequential labelling method was utilised, where the 40 nm AuNP-SA were added onto HeLa cells pre-loaded with Bi-Tf(A647) and maintained at 4 °C, as described in the subsection 2.2The second construct, called 10 nm AuNP-SA(A488)-Bi-Tf(A647), consists of commercially available AuNPs of 10 nm diameter that have streptavidin, fluorescently labelled with Alexa488, adsorbed on their surface (Alexa Fluor 488 streptavidin, 10 nm colloidal gold conjugate “30 μg protein per mL”, Molecular Probes). These were subsequently bound to Bi-Tf(A647), using the sequential labelling method as described in the subsection 2.2
The third construct, called 15 nm AuNP-PC-Tf(A488), consists of AuNPs of 15 nm diameter covalently bound to a polymer shell onto which Tf fluorescently labelled with Alexa488 is covalently attached. This construct was developed in house as per methods described in details by Sayers et al.25 (where it is called Tf-AuNP-3). It has an average of 3 Tf molecules per AuNP. The polymer is nonthermoresponsive, with the Tf exposed for cellular uptake. The hydrodynamic diameter of this construct was measured to be 49 ± 1 nm. The stock solution contained 1.27 × 10¹⁴ AuNP per mL.
The fourth construct is made from a commercially available kit (InnovaCoat GOLD 20OD conjugation kit, Innova Biosciences). It consists of 20 nm diameter AuNPs with a proprietary protective surface coat onto which proteins or antibodies can be covalently bound. Goat-antirabbit antibodies fluorescently labelled with Alexa647 (Thermo Fisher Scientific) were bound to these AuNPs following the manufacturer's protocol. InnovaCoat GOLD nanoparticles in the kit are freeze dried. The conjugation reaction is initiated simply by reconstituting the dry mixture with a reaction buffer and a diluted antibody stock (at 0.25 mg mL−1), which becomes attached (via lysine residues) to the InnovaCoat surface. Note that we followed the manufacturer recommended wash protocol, in order to obtain a conjugate nominally 100% free from unbound antibody (see section “AuNP–fluorophore conjugates deposited on glass”). We called this construct 20 nm AuNP-PC-Ab(A647).
Table 1 summarises these samples, indicating the AuNP core diameter, the type of shell based on streptavidin (SA) or polymer coating (PC) attached via a covalent bond (cb) or adsorption (ad), and whether sequential labelling was used or not.
2.2 Cell culture
HeLa cells were obtained from the American Type Culture Collection (ATCC) and routinely tested for mycoplasma infection. Cell lines were maintained as a subconfluent monolayer in DMEM (Fisher Scientific, Loughborough, UK) supplemented with 10% (v/v) fetal bovine serum (FBS), under standard tissue culture conditions (at 37 °C, 5% CO2 in a humidified incubator).The murine 3T3-L1 fibroblast clone was a kind gift from the Tavare lab, University of Bristol, originally obtained from ATCC (CL-173; Manassas, USA).
2.3 AuNP–fluorophore conjugates deposited on glass
The commercially available 10 nm AuNP-SA(A488), namely AuNPs of 10 nm diameter that have streptavidin, fluorescently labelled with Alexa488, adsorbed on their surface were washed to reduce the presence of unbound streptavidin as follows. 20 μL of stock solution was added to 1 mL of deionised (DI) water (Sigma Aldrich). AuNPs were centrifuged at 20![[thin space (1/6-em)]](https://www.rsc.org/images/entities/char_2009.gif) 000g for 30 min. 1 mL of supernatant was removed. The protocol was performed once (1× wash sample), or repeated three times (3× wash sample). A similar protocol was followed for the commercially available 20 nm AuNP-PC-Ab(A647) which were centrifuged at 9000g for 20 min, as recommended by the manufacturer.
000g for 30 min. 1 mL of supernatant was removed. The protocol was performed once (1× wash sample), or repeated three times (3× wash sample). A similar protocol was followed for the commercially available 20 nm AuNP-PC-Ab(A647) which were centrifuged at 9000g for 20 min, as recommended by the manufacturer.
AuNPs were then deposited by spin coating (using 20 μL volume at an initial speed of 2000 rpm for 35 s followed by 4000 rpm for 30 s) onto a clean glass coverslip to achieve an even nanoparticle distribution, except for the 10 nm AuNPs washed 3×. Due to the reduced particle density, these NPs were deposited via sedimentation of a 200 μL volume from the solution for 10 min followed by washing with DI water. Cleaning of glass was performed first with acetone and high-quality cleanroom wipes, followed by a chemical etch called Caro's etch, or more commonly, Piranha etch. Fused silica coverslips were used for the 10 nm AuNPs, to reduce autofluorescence background.
2.4 Fluorescence microscopy
Epi-fluorescence microscopy was performed in the same microscope, using a metal–halide lamp (Lumen L200/D; Prior Scientific, Rockland, MA) and an exciter/emitter/dichroic filter cube suitable for the A488 (GFP-A-Basic-NTE; Semrock, Rochester, NY; 469/35, Di500, 525/39) or the A647 fluorophore (Cy5-A-Basic-NTE; Semrock, Rochester, NY; 630/38; Di655; 694/44). Images were acquired with an exposure time of 10 s. Illumination intensity at the sample using the 1.45 NA oil objective was 40 W cm−2 with the GFP-A-Basic-NTE filter cube and 18 W cm−2 with the Cy5-A-Basic-NTE cube. Using the 1.27 NA water objective, the intensity was 31 W cm−2 and 14 W cm−2 with the GFP-A-Basic-NTE and Cy5-A-Basic-NTE cube respectively.
An imaging chamber was formed using an adhesive gasket of 0.12 mm thickness (Grace Bio-lab SecureSeal) in between the coverslip carrying the AuNPs and a glass slide on the side of the oil condenser. 20 nm AuNP-PC-Ab(A647) were imaged in air for both fluorescence and extinction microscopy, using the 1.45 NA oil objective.
10 nm AuNP-SA(A488) were imaged first in air for fluorescence microscopy, and subsequently in oil which was matched to the refractive index of fused silica (n = 1.46) for extinction microscopy. For this sample, we used the 1.27 NA objective with correction collar to compensate for spherical aberrations. Notably, part of the excitation in fluorescence microscopy undergoes total internal reflection at the glass–air interface. This gave rise to a relevant background detected by the camera, of 200–300 counts over 10 s. To account for this background, we acquired a time course of 36 images (each with 10 s exposure) over which photo-bleaching of A488 occurs. We then subtracted the average of the last two frames from the average of the first two frames, to remove the background. The oil was inserted in situ during microscopy, using a partly cut gasket forming a channel, and a connecting tube which allowed injection of the oil into the imaging chamber without removing the sample, for correlative extinction and fluorescence microscopy. Addition of the index matching oil was required to reduce the background due to surface roughness in the extinction measurements.
2.5 FWM microscopy
FWM microscopy was performed using a home built set-up, as described in details in our recent work.23 Briefly, optical pulses of 150 fs duration centered at 550 nm wavelength with νL = 80 MHz repetition rate were provided by the signal output of an optical parametric oscillator (Spectra physics Inspire HF 100) pumped by a frequency-doubled femtosecond Ti:Sa laser (Spectra Physics Mai Tai HP). The output was split into three beams, all having the same center optical frequency, resulting in a triply degenerate FWM scheme. One beam acts as a pump and excites the AuNP at the LSPR, with an intensity that is amplitude modulated at νm = 0.4 MHz by an acousto-optic modulator (AOM). The change in the AuNP optical properties induced by this excitation is resonantly probed by a second pulse at an adjustable delay time τ after the pump pulse. Pump and probe pulses are recombined into the same spatial mode and focused onto the sample by a 100× oil-immersion objective of 1.45 NA (Nikon CFI Plan Apochromat lambda series). The sample is positioned and moved with respect to the focal volume of the objective by scanning an xyz sample stage with nanometric position precision (MadCityLabs NanoLP200). A FWM field (proportional to the pump induced change of the probe reflected field) is collected by the same objective (epi-detection), together with the probe reflected field, transmitted by an 80:20 beam splitter used to couple the incident beams into the microscope, and recombined in a 50:50 beam splitter with a reference pulse field of adjustable delay. The resulting interference is detected by two pairs of balanced Si photodiodes (Hamamatsu S5973-02). A heterodyne scheme discriminates the FWM field from pump and probe pulses and detects the amplitude and phase of the field. In this scheme, the probe optical frequency is slightly upshifted by a radio frequency amount (ν2 = 82 MHz), and the interference of the FWM with the unshifted reference field is detected. As a result of the amplitude modulation of the pump at νm and the frequency shift of the probe by ν2, this interference gives rise to a beat note at ν2, with two sidebands at ν2 ± νm, and replica separated by the repetition rate νL of the pulse train. A multi-channel lock-in amplifier (Zürich Instruments HF2LI) enables the simultaneous detection of the carrier at ν2 − νL = 2 MHz and the sidebands at ν2 ± νm − νL = 2 ± 0.4 MHz. As described in our previous work23 the set-up also features a dual polarization scheme. Data shown in this work refer to detecting the co-circularly polarised components of the reflected probe field and FWM field relative to the incident circularly polarized probe, having amplitudes indicated as A2r+ and AFWM+ respectively. The 3D spatial resolution of our FWM imaging was characterized previously.23,28 For the microscope objective used here, the spatial resolution is about 200 nm in the lateral direction and 600 nm in the axial direction as FWM field amplitude AFWM+ point-spread function full-width-half maximum. Differential interference contrast microscopy was also available in the same instrument, with wide-field illumination via an oil condenser of 1.34 NA and detection with a Canon EOS 40D camera attached to the left port of the microscope stand, using the Nikon N2 DIC prisms (∼240 nm shear).
3. Results and discussion
Inspired by previous work on the trafficking of Tf, which has been extensively characterized as a targeting ligand,29 we started by investigating AuNP-Tf conjugates in HeLa cells. Tf and its receptor (TfR) are highly relevant for the targeted delivery of small and macromolecular therapeutics into cancer cells.30 Interestingly, we have previously shown24 that by targeting the plasma membrane TfR with biotinylated Tf and subsequently adding streptavidin to cross-link receptor:ligand-biotin complexes, a selective lysosomal delivery of Tf was achieved over a 6 hours time-course. Targeted delivery of (bio)therapeutics to the lysosome, such as antibody–drug conjugates, is a major clinical need, hence the potential of this cross-linking strategy for navigating therapeutics through the endolysosomal pathway has attracted significant attention.
In order to examine the ability of our FWM technique to follow the fate of single AuNPs inside a cell and investigate the integrity of the AuNP-Tf conjugate, we therefore studied a very similar construct. HeLa cells were sequentially loaded with biotinylated Tf fluorescently labeled with Alexa647 (Tf-Bi(A647)), followed by adding 40 nm diameter AuNPs with streptavidin covalently bound on their surface (40 nm AuNP-SA-Bi-Tf(A647); see Table 1 and Experimental section). As described in our previous work,24 the sequential addition protocol was done on ice-cold medium to inhibit endocytosis, and was used to avoid the formation of aggregates in solution that might hinder Tf functionality. Subsequently, cells were incubated in pre-warmed imaging medium to allow endocytosis for 6 hours, then fixed and mounted onto a microscope slide, for correlative fluorescence and FWM imaging.
FWM microscopy was performed as detailed in our previous work23 (see also Experimental section). FWM excitation and detection in our set-up can be understood as a pump–probe scheme, with pump and probe fields called E1 and E2 respectively. The absorption of a 150 fs pump pulse of intensity E1E1* with center wavelength at the LSPR of the AuNP induces the formation of a hot electron gas in the metal which changes the AuNP dielectric constant. The corresponding change in the AuNP reflection is resonantly probed by the probe pulse of field E2 at an adjustable delay time τ after the pump-pulse, resulting in a FWM field proportional to E1E1*E2. Heterodyne interferometric detection of the FWM field (see Experimental section) is separated from E1 and E2 and thus free from scattering background. Notably, the interferometric detection is also insensitive to incoherent fluorescence backgrounds. By varying τ, the electron dynamics can be time-resolved, revealing the time scale of the thermalisation between electron and the lattice of the metal (∼1 ps) and the subsequent thermalisation of the NP with the surrounding medium31 (>100 ps). This dynamics enables us to distinguish the electronic AuNP response from instantaneous coherent backgrounds and/or long-lived photothermal effects. As a result, we can achieve completely background-free FWM imaging of single AuNPs even in scattering and fluorescing cellular environments.23
Our set-up enables simultaneous detection of the reflected probe and FWM fields, having amplitudes indicated as A2r+ and AFWM+ respectively. Fig. 1 shows examples of images for A2r+ and AFWM+ obtained on HeLa cells loaded with the 40 nm AuNP-SA-Bi-Tf(A647) construct. The reflection images A2r+ correlate with the cell contour seen on the corresponding regions (highlighted by white frames) with differential interference contrast (DIC) microscopy available in the same instrument, and show a spatially varying contrast due to thickness and refractive index inhomogeneities in the sample. Even with a particle diameter as large as 40 nm, AuNPs are not distinguished from the cellular structure in DIC or in the A2r+ reflection image. On the contrary, the FWM amplitude shown in Fig. 1 as a maximum amplitude projection over a 5 μm z-stack is background-free (throughout the z-stack) and clearly indicates the location of well-separated individual AuNPs in the cell. Note that the observed AuNP density in the ∼100 AuNPs per cell is consistent with the rate of uptake reported by Wong et al.17 taking into account the AuNP size, concentration (7 × 10¹⁰ AuNP per mL) and AuNP uptake time (10 min) used here.
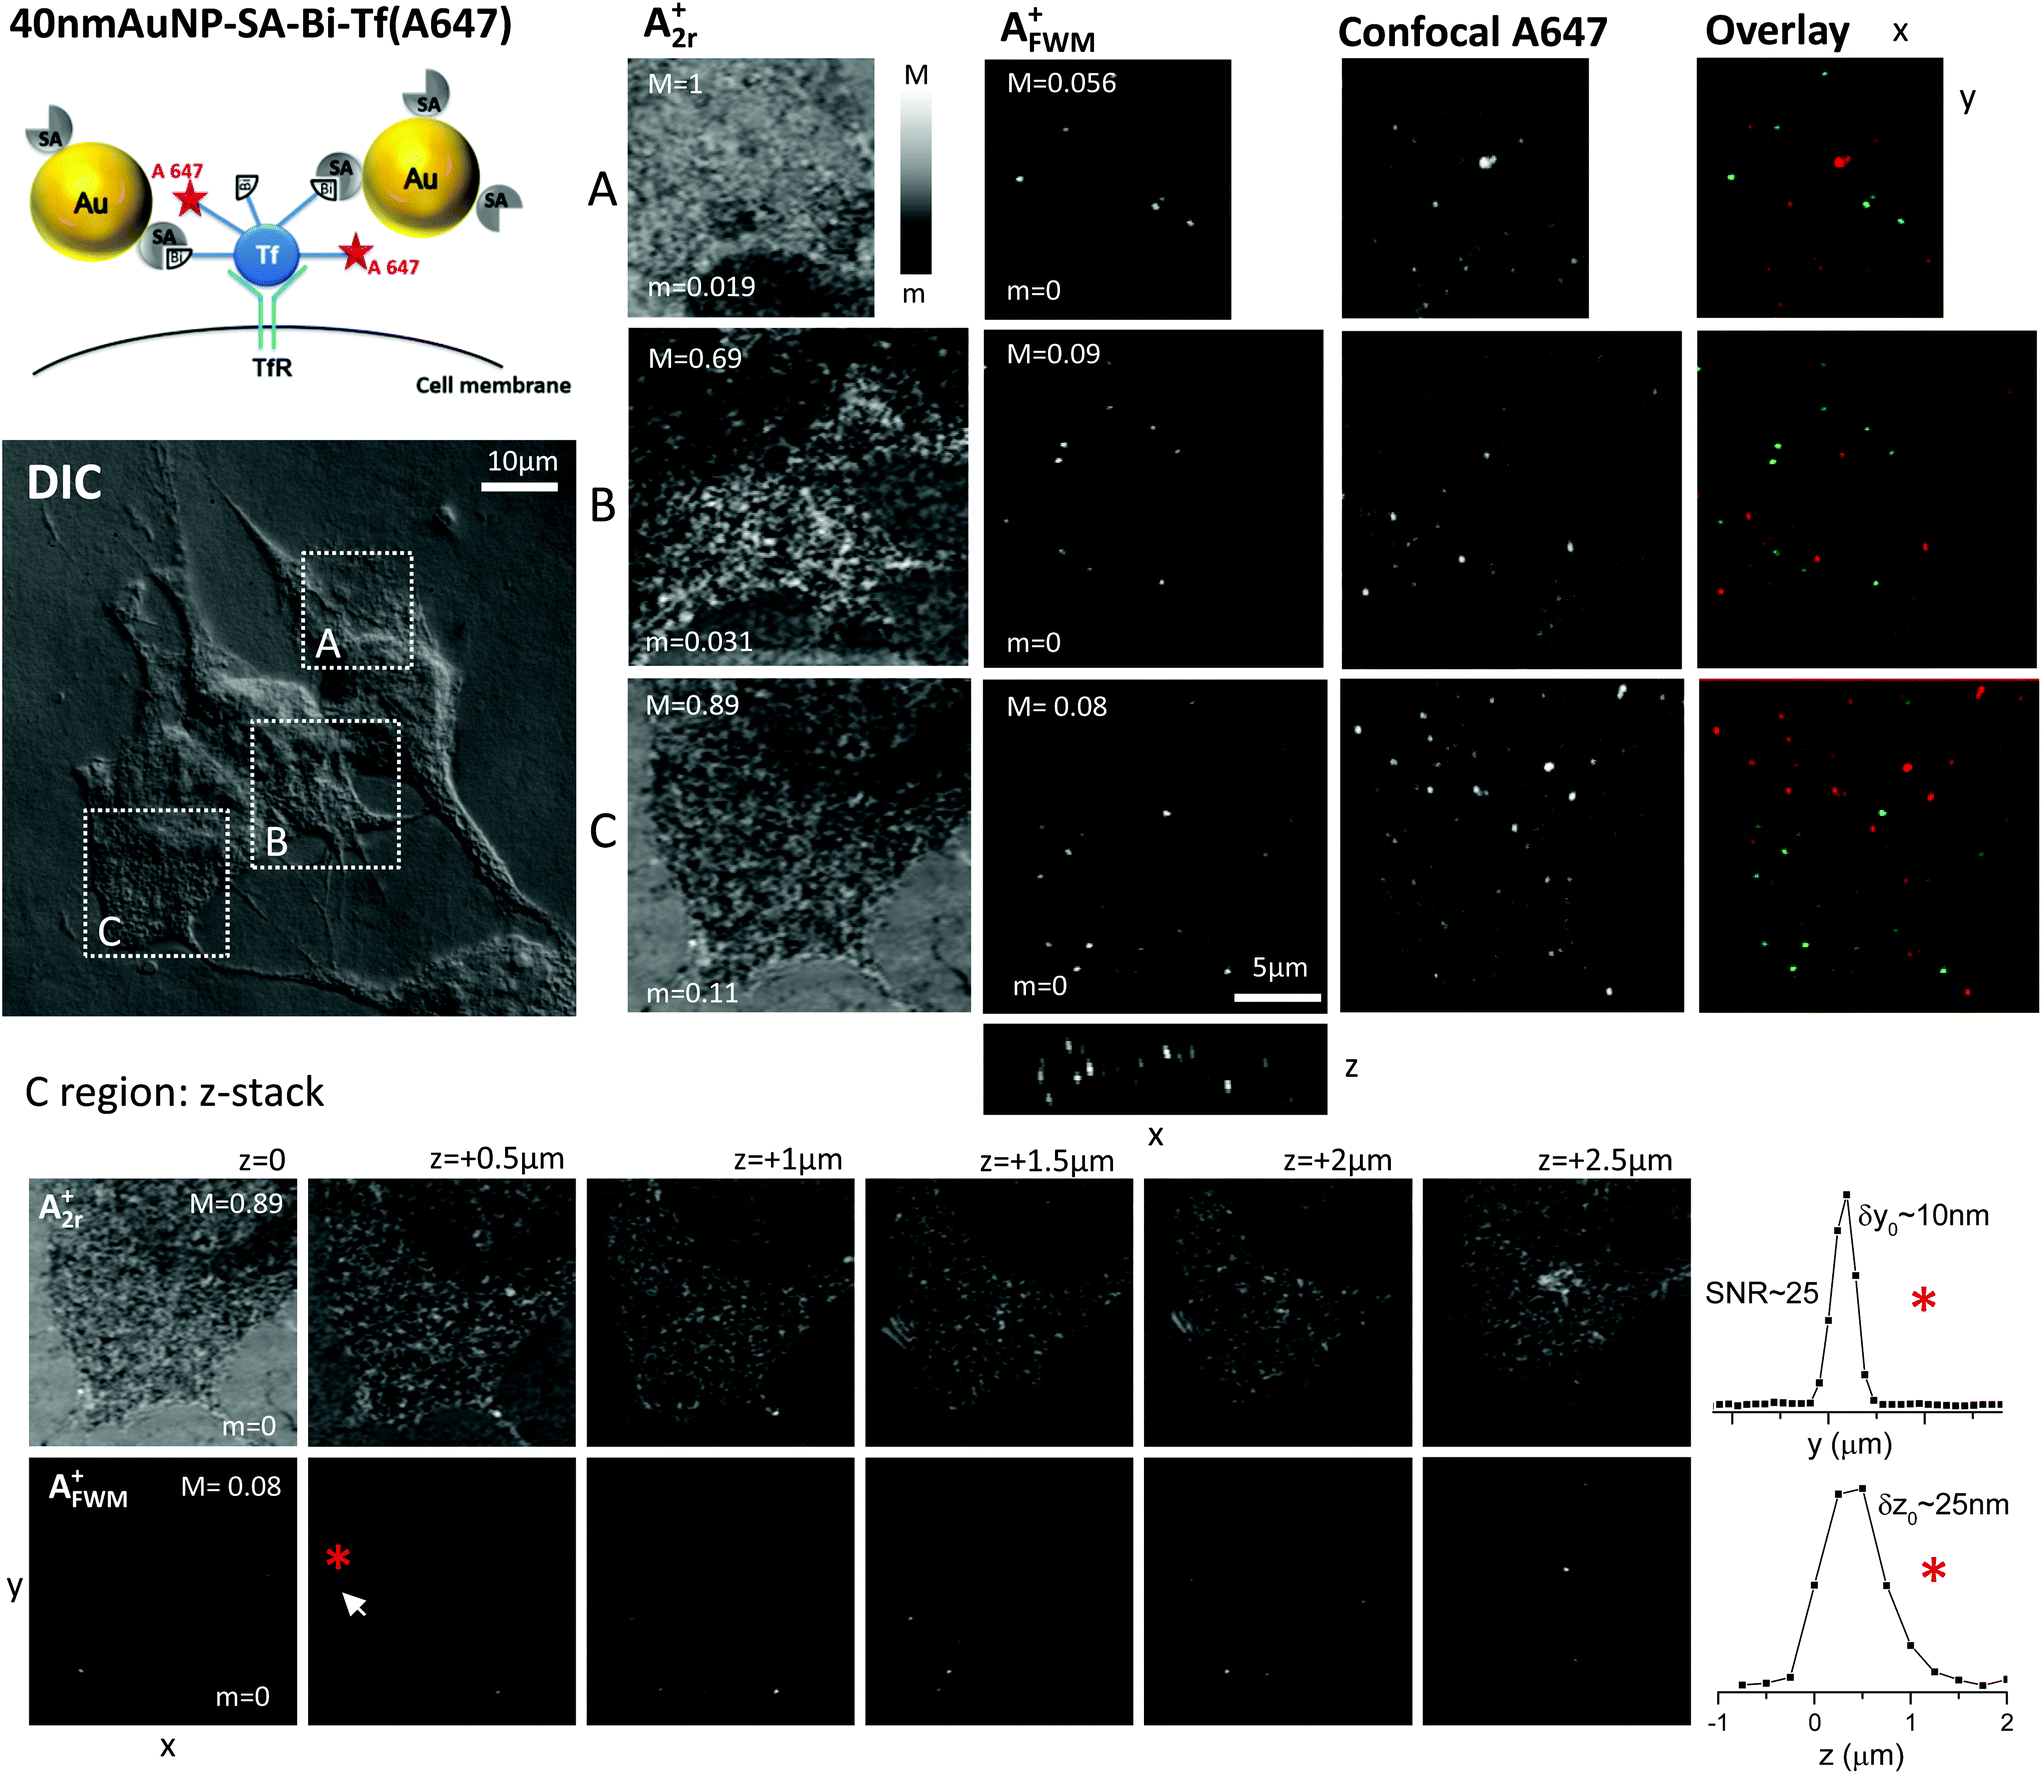 | ||
| Fig. 1 Top left: Sketch of the AuNP construct. Center left: Fixed HeLa cells that have internalized 40 nm AuNP-SA-Bi-Tf(A647) imaged by differential interference contrast microscopy. Top right: Reflection amplitude (A2r+), FWM amplitude (AFWM+) and confocal fluorescence microscopy of the regions highlighted in DIC. FWM was acquired with a pump–probe delay time of 0.5 ps, pump (probe) power at the sample of 30 μW (15 μW), 2 ms-pixel dwell time, pixel size in plane of 95 nm and z stacks over 5 μm in 250 nm z steps. FWM is shown as a maximum amplitude projection in the x,y plane over the z stack (and in the x,z plane for region C). The reflection is on a single x,y plane (scanning the sample position) axially located near to the glass substrate interface. Grey scales are linear from m to M for field amplitudes, as indicated (M = 1 corresponds to 8.9 mV rms detected by the lock-in). Confocal fluorescence of the Alexa647 label is a maximum intensity projection over a 6.9 μm z-stack in 250 nm z steps. Overlay: fluorescence (red), FWM amplitude (green). Bottom: series of reflection and FWM images for region C at different z planes, as indicated. For the AuNP indicated by the red asterisk and white arrow, 1D cuts along y and z are shown on the right. | ||
To highlight that we are able to detect AuNPs in 3D inside the cell, we show in Fig. 1 the FWM maximum amplitude projection also in the xz plane, and a series of in-plane images (reflection and FWM) for different z-planes, for one cell region. Well-separated individual AuNPs are observed at various planes within the cell. For the AuNP labeled by the red asterisk (see also white arrow), one-dimensional cuts of the FWM amplitude along the y and z direction are shown on the bottom-right side of Fig. 1. These spatial profiles exemplify the 3D sectioning capabilities of the technique and can be used to estimate the localization precision. Using the same concept of fluorescence localisation microscopy,32 the position of a single reporter in an image can be determined by fitting the amplitude profile and determining its center with a precision (δ) much better than the diffraction limited point-spread function width (σPSF), by a factor given by the signal to noise ratio (SNR): δ ≃ σPSF/SNR. From the cuts in Fig. 1, we estimate a SNR ≃ 25 and localisation precision of about 10 nm in-plane and 25 nm axially. We note that these are qualitative estimates, and that an accurate analysis of the localisation precision in 3D at the nanoscale is not the main focus of this work. Indeed, alternative to imaging, we have recently shown a promising method to localise single AuNPs with nanometric precision in 3D at high speed from single-point FWM acquisition using optical vortices.23
Confocal fluorescence of the Alexa647 fluorophore was performed using a separate instrument on the same regions of interest, accurately mapped by the aid of gridded coverslips and DIC also available in the confocal fluorescence microscope. To avoid photobleaching, confocal microscopy was performed prior to FWM acquisition. Images are shown in Fig. 1 as a maximum intensity projection over a 6.9 μm z-stack. The observed spatial pattern is consistent with the expectation that Bi-Tf(A647) has been internalized and is contained in intracellular vesicles, as discussed in our previous work.24 However, there is no correlation (co-localisation), between the spatial patterns observed in FWM and in confocal fluorescence, as qualitatively shown by the overlay images.
When mapping two images acquired from different instruments solely on the basis of the cell contour in DIC and reflection microscopy, without using fiducials, it is possible that a small rotation and translation adjustment is needed to correctly overlay the images. To account for that, we calculated, for the FWM and in confocal fluorescence images in Fig. 1, the image cross correlation coefficient rP (also known as Pearson's coefficient33) as a function of relative translation (Δx,Δy) and rotation (Δθ) coordinates. The corresponding cross-correlation images rP(Δx,Δy,Δθ) are shown in the ESI Fig. S1† and reveal no well defined maximum near the center, with values rP < 0.05 near the center, i.e. there is no significant correlation even when accounting for small translation and rotation adjustments. Similar results were obtained when examining other field of views on this sample.
The lack of correlation, and in turn co-localization, of Alexa647 and AuNPs could be due to a number of reasons. It is possible that unbound streptavidin is present in the commercially available stock solution of 40 nm AuNP-SA, which in turn binds Bi-Tf(A647). This could explain the observation of fluorescence from Alexa647 as expected from internalized Tf, but not co-localised with AuNPs. It is also possible that after 6 hours trafficking, the 40 nm AuNP-SA-Bi-Tf(A647) construct is broken down, similar to that suggested by Wu et al.21 for quantum-dot nucleic acid conjugates. Internalized Tf might also be sent for degradation into the lysosomes.24 Finally, the fluorophore might be quenched near the surface of AuNPs, similar to that reported by Miles et al.20 on commercial 10 nm AuNPs-Alexa633 fluorophore conjugates. In any case, it is clear that solely relying on the detection of fluorescence with this system would lead to misleading conclusions on the intracellular fate of the AuNPs.
For comparison, and to explore the issue of degradation following intracellular trafficking, we then studied the construct 10 nm AuNP-SA(A488)-Bi-Tf(A647) (see also Experimental section). In this case, HeLa cells were sequentially incubated on ice with Bi-Tf(A647), followed by adding 10 nm diameter AuNPs with Alexa488 labeled streptavidin (SA(A488)) adsorbed on their surface. Following this incubation and subsequent washes, cells were immediately fixed. Here, no endocytosis had occurred prior to fixation, and we would expect to see the 10 nm AuNP-SA(A488)-Bi-Tf(A647) construct on the plasma membrane. Notably, since streptavidin is also labeled, we could additionally study its co-localisation with Bi-Tf(A647) and AuNPs by FWM. We also chose to examine this system under low irradiance wide-field fluorescence microscopy (∼W cm−2), prior to FWM imaging, to reduce photobleaching that might be caused by confocal microscopy, in which higher excitation intensities (∼kW cm−2) are used.34
Fig. 2 shows examples of images for A2r+ and AFWM+ obtained on HeLa cells loaded with this construct. The reflection images A2r+ correlate with the cell contour seen on the corresponding regions (highlighted by white frames) in DIC available in the same instrument, while the FWM amplitude AFWM+ is background-free and clearly indicates the location of well-separated individual AuNPs. The FWM signal strength is much smaller than that observed for the 40 nm diameter AuNPs in Fig. 1, as expected since the FWM field amplitude scales approximately with the NP volume.23 A few individual nanoparticles are clearly resolved at a density of ∼0.1 NP per μm3.
 | ||
| Fig. 2 Top left: Sketch of the AuNP construct. Bottom left: Fixed HeLa cells that have internalized 10 nm AuNP-SA(A488)-Bi-Tf(A647) imaged by differential interference contrast microscopy. Top right: Reflection amplitude (A2r+), FWM amplitude (AFWM+) and wide-field fluorescence microscopy of the regions highlighted in DIC. FWM was acquired with a pump–probe delay time of 0.5 ps, pump (probe) power at the sample of 94 μW (47 μW), 5 ms-pixel dwell time in A and 3 ms in B, pixel size in plane of 38 nm and z stacks over 1 μm in 100 nm z steps. FWM is shown as a maximum amplitude projection over the z stack, while the reflection is on a single x,y plane (scanning the sample position) axially located near to the glass substrate interface. Grey scales are linear from m to M for field amplitudes, as indicated (M = 1 corresponds to 7.8 mV rms detected by the lock-in). Wide-field fluorescence of the Alexa488 and Alexa647 labels are shown, scaled to their maximum intensity, and indicated as WF A488 and WF A647 respectively. Overlays of FWM amplitude and wide-field fluorescence are shown color coded, as indicated. In the overlay of WF A488 (green) and WF A647 (red) images are re-scaled to highlight low intensity co-localisation (green intensity from 0.035 to 0.23 of its maximum, red intensity from 0.019 to 0.32). | ||
Strikingly, wide-field fluorescence images of the Alexa488 and Alexa647 fluorophores performed on the same regions of interest, prior to FWM acquisition, show a much higher density of these labels. The observed spatial pattern is consistent with the expectation that both SA(A488) and Bi-Tf(A647) have been recruited at the cell surface, indicative that the two components are linked. Notably, the spatial distribution of the Alexa488 correlates well with that of Alexa647 fluorophore, with a Pearson's coefficient of 0.91 (see large overview and rP analysis in ESI Fig. S6†). However, also in this case, there is no correlation between the spatial patterns observed in FWM and in fluorescence, as qualitatively shown by the overlay images. To account for small rotation and translation adjustments, since FWM and wide-field fluorescence were acquired on separate instruments, we again calculated the image cross correlation coefficient as a function of relative translation and rotation coordinates. We found no well defined maximum near the center, with values rP < 0.05 near the center (see ESI Fig. S2†). These results thus indicate that the Bi-Tf(A647) is bound to labeled streptavidin SA(A488) at the cell surface, however most of the labeled streptavidin is actually not bound to a AuNP. It should be stressed that solely based on the wide-field fluorescence images in Fig. 2 one would have assumed a successful formation of the construct 10 nm AuNP-SA(A488)-Bi-Tf(A647) and expected a large number of 10 nm AuNPs to be present at the cell surface. We clearly show with our FWM imaging that this is not the case.
This observation is corroborated by a direct analysis of the commercial stock solution 10 nm AuNP-SA(A488) deposited onto a fused silica coverslip surface, correlatively imaged using extinction11 and wide-field fluorescence microscopy (see Fig. 3). Extinction microscopy is a simple technique to detect strongly absorbing particles such as AuNPs, as long as they are in an optically clear environment. We have shown in our previous works that the method can be quantitative and sensitive to single 5 nm diameter AuNPs.11,27,35 The 10 nm AuNP-SA(A488) solution was washed to reduce the presence of unbound streptavidin (see Experimental section). Even so, we observe virtually no co-localisation between single AuNPs visualised by extinction microscopy, and the A488 fluorophore. This is exemplified in Fig. 3 that shows extinction contrast images (as zooms over sub-regions in the field of view (FOV)) from which we have quantified the extinction cross-section of a set of representative AuNPs (the entire FOV with all representative AuNPs is given in the ESI Fig. S13 and S14†), and in turn their diameter D using Mie theory in the dipole limit.11,27 The measured cross-sections are above the detection limit, shown by the distribution of cross-section values in regions without AuNPs (indicated as “background” in Fig. 3 left). This was possible by immersing the AuNPs in an index matched oil, to optically clear the fused silica coverslip surface. Prior to this, the surface with deposited 10 nm AuNP-SA(A488) was imaged in air by wide-field fluorescence microscopy (see Experimental section). The results in the same regions are shown in Fig. 3 and reveal many unbound A488 fluorophores for the 1× washed sample. The number of fluorophores is reduced for the 3× washed sample (which also exhibits AuNP aggregation). Fused silica coverslips were used to minimize autofluorescence background especially from point-like defects (see also ESI S11†), which can be significant for standard glass under the excitation detection conditions needed for Alexa488. Fluorescence measurements were performed in air to keep fluorophores attached onto the surface, i.e. prevent them from detaching into a solvent, and to avoid fluorescence of the index matching medium. The lack of co-localisation between AuNPs and fluorophores in these experiments is exemplified in Fig. 3 right showing a colored overlay of extinction and fluorescence microscopy, and the calculated cross-correlation coefficient rP. A map of rPversus relative translation of the images is shown in the ESI Fig. S4.† It should be noted that washing these 10 nm AuNP-SA(A488) to reduce the presence of unbound streptavidin is mentioned as an ‘optional’ good practice from the manufacturer. Our results show that even after one wash there is a significant amount of unbound SA(A488). Notably, albeit the number of unbound SA(A488) can be reduced by repeating the washing protocol, the observed AuNPs are not fluorescent. In essence, our results clearly show that, in this commercial product, the fluorophore label does not provide any reliable information about the AuNP location.
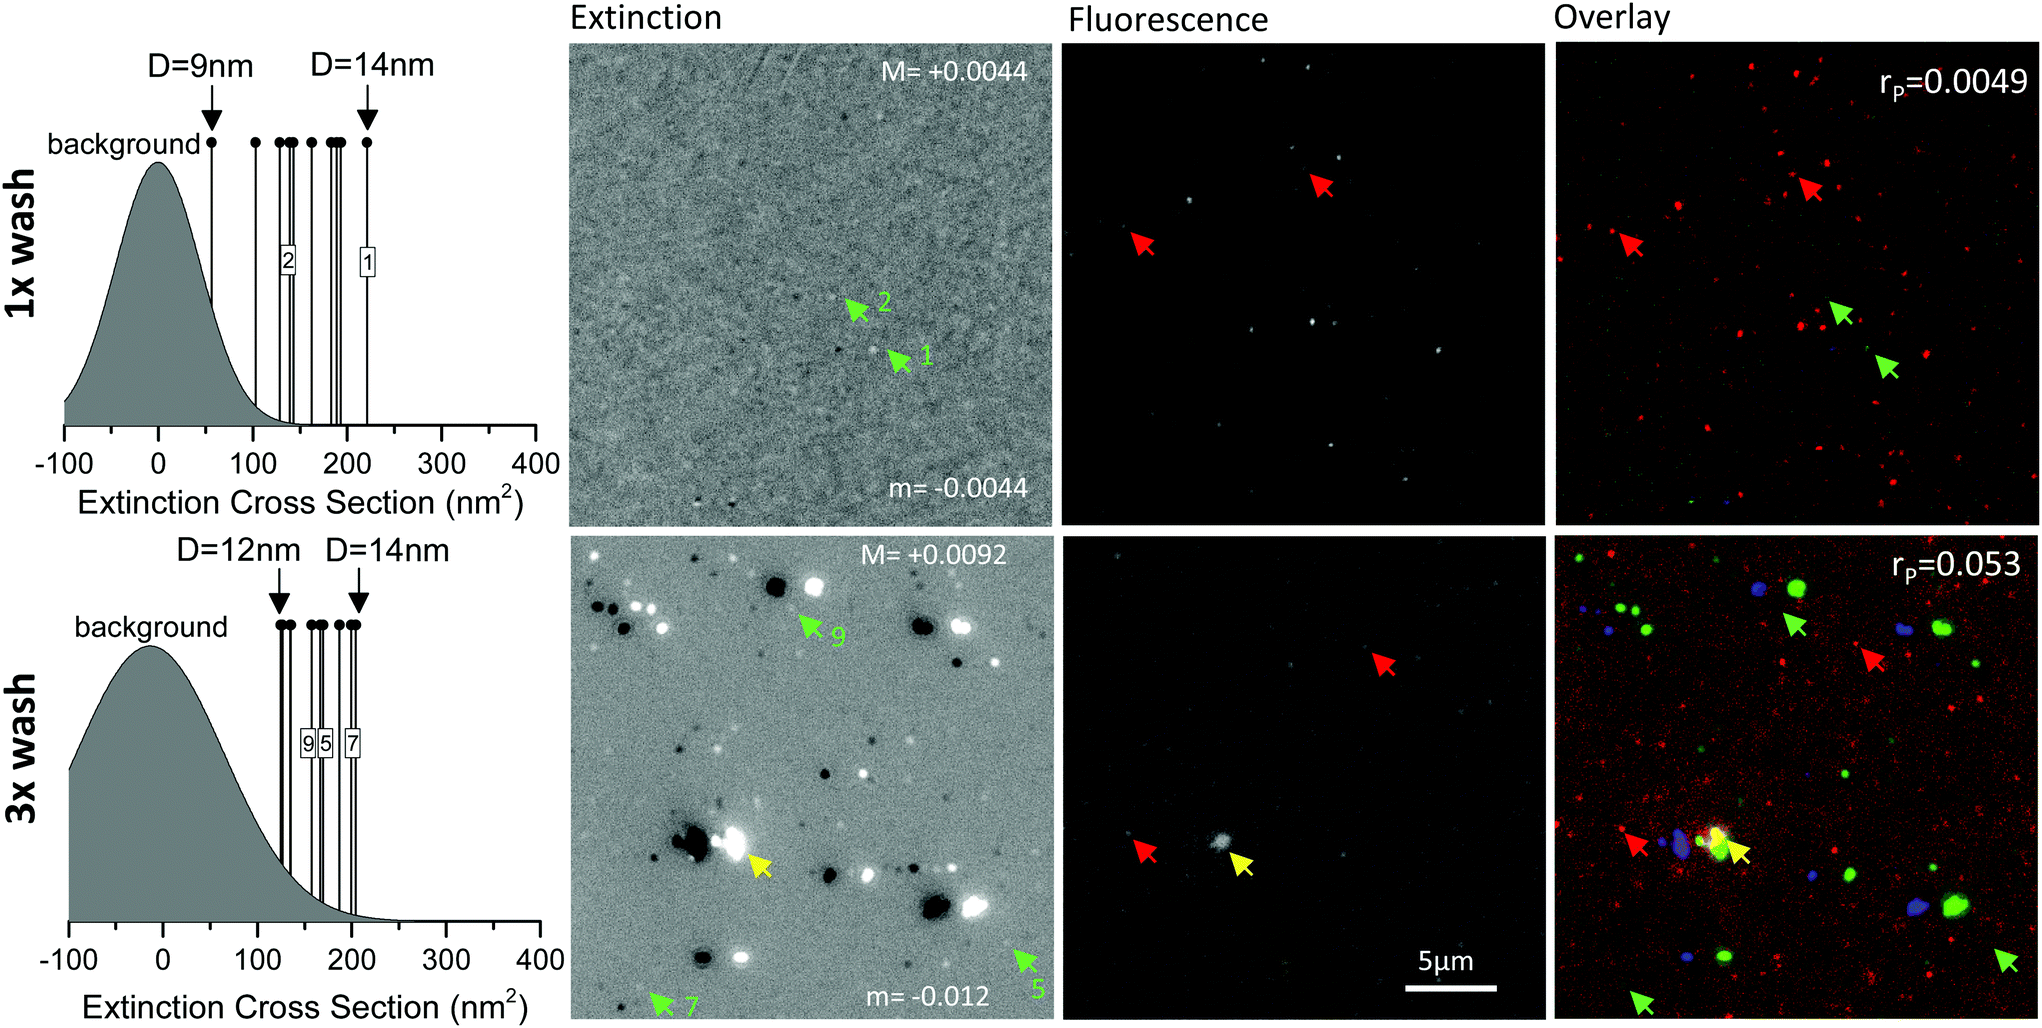 | ||
| Fig. 3 10 nm AuNP-SA(A488) imaged by correlative wide-field fluorescence and extinction microscopy. The AuNP solution was washed once (top) or 3 times (bottom) to reduce the presence of unbound streptavidin. AuNPs were deposited onto fused silica coverslips and imaged by wide-field fluorescence microscopy in air, followed by extinction microscopy in index matched oil. Extinction cross-sections of ten representative single particles in the FOV are indicated on the left panels, with corresponding particle diameter ranges, above the detection limit (background histogram, see text). Extinction contrast images are shown on grey scale from m (black) to M (white), as indicated, with green arrows pointing to selected single AuNPs for which the cross-section was quantified, as labelled (images shown are 30% of the FOV). Fluorescence images of the same area (after background subtraction, see text) are shown on a common grey scale from −0.1Fm to Fm, with Fm being the maximum amplitude in the FOV for the 1× washed sample. Overlay: fluorescence (red), extinction maxima (green) extinction minima (blue). In the overlay, amplitudes are re-scaled to maximize colour overlap. Red arrows indicate unbound fluorophores. The yellow arrow indicates red-green co-localization. The cross-correlation (Pearson's) coefficient rP is given. | ||
We then moved to the third construct, namely 15 nm AuNP-PC-Tf(A488) (see Table 1). As discussed by Sayers et al.,25 polymer–metal hybrid nanoparticles offer many advantages for diagnosis and therapy, owing to the control of the polymer chain folding, e.g. via temperature or pH, which can in turn be used to ‘hide’ or ‘reveal’ ligands at the nanoparticle surface. The 15 nm AuNP-PC-Tf(A488) is one of the polymer-coated gold NPs fabricated and studied by Sayers et al.25 (there called Tf-AuNP-3), shown to exhibit Tf-specific uptake, and was investigated here with correlative FWM/fluorescence microscopy. In this construct, Tf is fluorescently labelled with Alexa488 and covalently bound to a polymer shell, attached also via covalent bond onto the surface of a 15 nm diameter AuNP. For this system, sequential labelling at 4 °C is not needed. HeLa cells were incubated with AuNPs for 2 hours at 37 °C, similar to the protocol by Sayers et al.,25 followed by washing and fixation (see Experimental section).
Fig. 4 shows examples of images for A2r+ and AFWM+ obtained on these cells incubated with the 15 nm AuNP-PC-Tf(A488) construct. As for the previous cases, the reflection images A2r+ correlate with the cell contour seen on the corresponding regions (highlighted by white frames) in DIC available in the same instrument. Here, a high density of AuNPs is observed in FWM (>1 AuNP per μm3), consistent with the high concentration of nanoparticles in the solution used for these samples and the long incubation time (see Experimental section). For clarity, considering such a high NP density, we show in Fig. 4 FWM images at a single x,y plane at the glass substrate interface, identified using the reflected field amplitude outside the cell regions which is highest at this interface as a function of z. Maximum intensity projections over a 5 μm thickness are shown in the ESI Fig. S7.† We note that the FWM field amplitude is smaller than that observed for the 40 nm diameter AuNPs in Fig. 1, but not as much as we would expect from the FWM field amplitude scaling with the NP volume.23 Hence, it is likely that we have sub-diffraction AuNPs aggregates in this sample, as also suggested in the study by Sayers et al.25
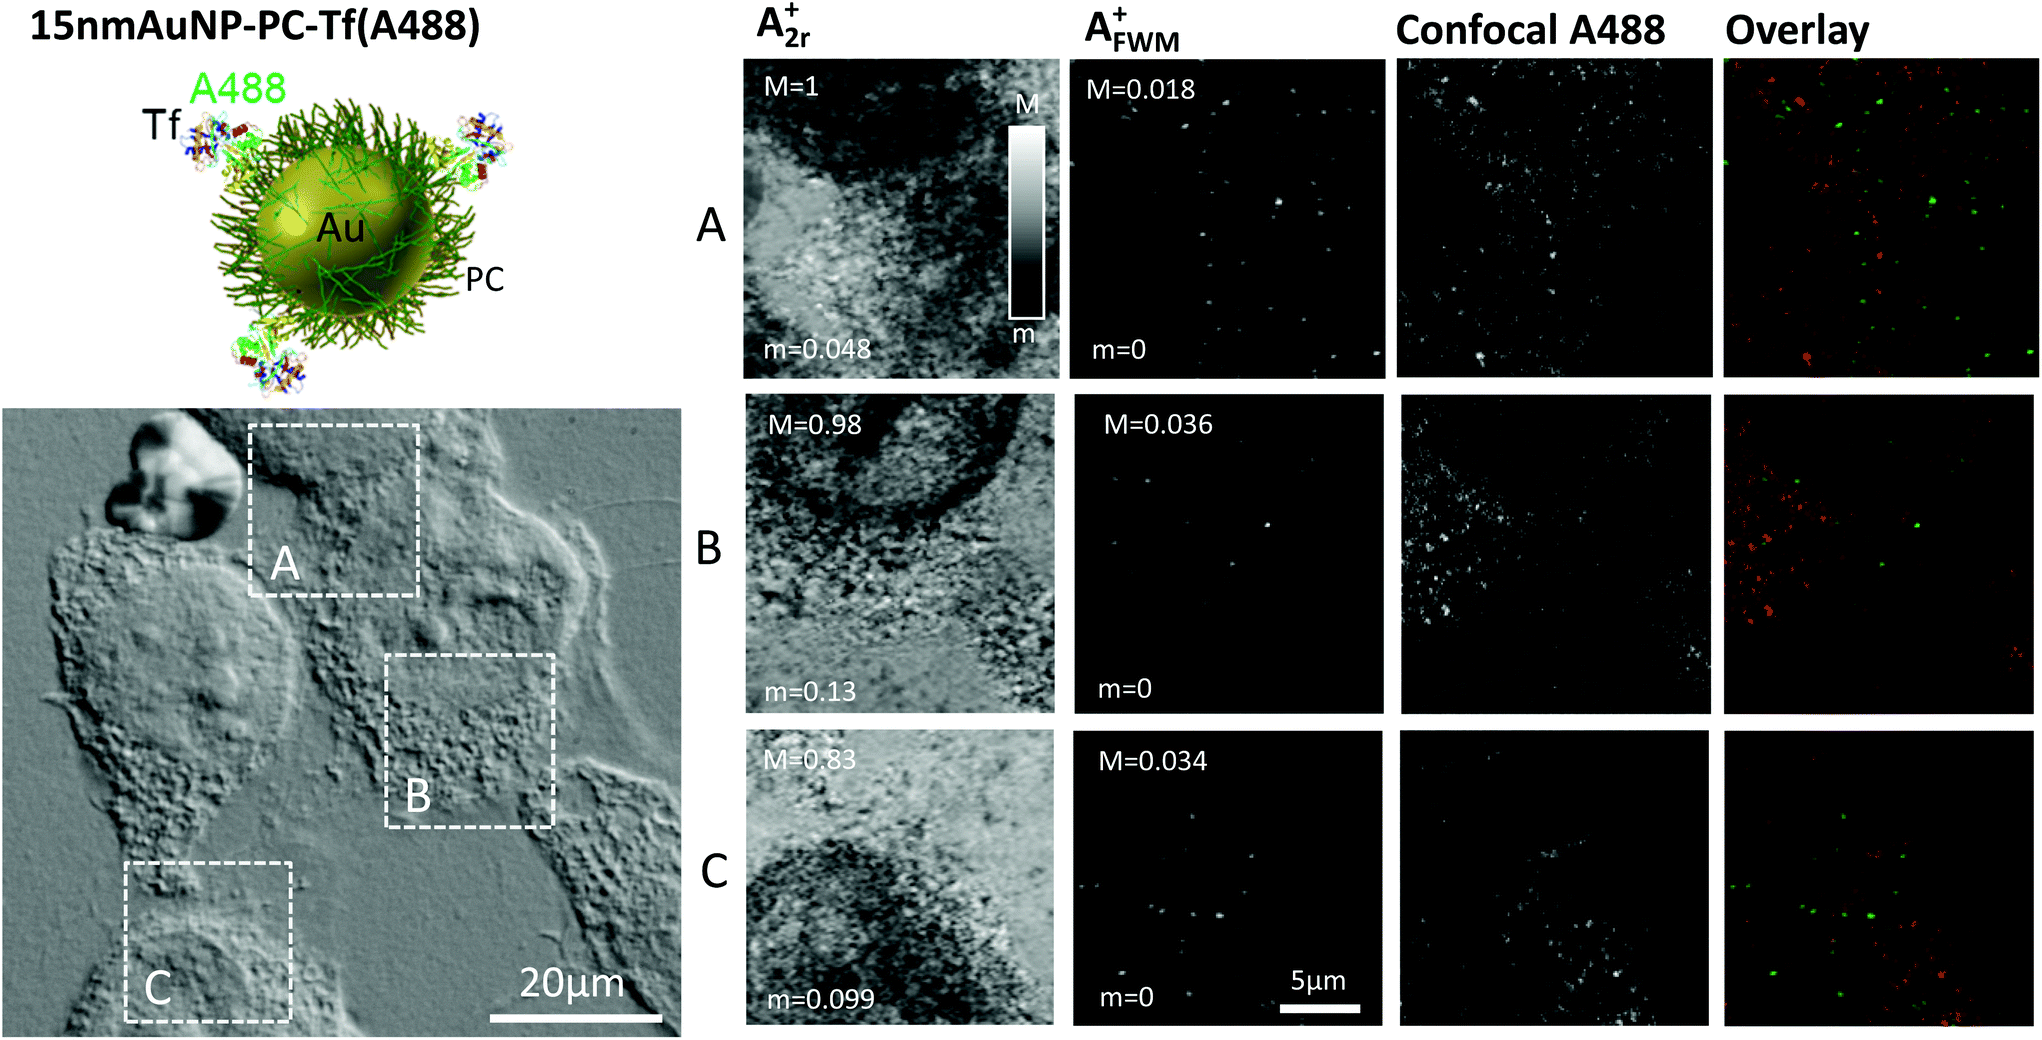 | ||
| Fig. 4 Top left: Sketch of the AuNP construct. Bottom left: Fixed HeLa cells that have internalized 15 nm AuNP-PC-Tf(A488) imaged by differential interference contrast microscopy. Right: Reflection amplitude (A2r+), FWM amplitude (AFWM+) and confocal fluorescence microscopy of the regions highlighted in DIC. FWM was acquired with a pump–probe delay time of 0.5 ps, pump (probe) power at the sample of 31 μW (16 μW), 2 ms-pixel dwell time, pixel size in plane of 94 nm and z stacks over 5 μm in 250 nm z steps. FWM, reflection, and fluorescence are shown on a single x,y plane at the glass substrate interface. Grey scales are linear from m to M for field amplitudes, as indicated (M = 1 corresponds to 10 mV rms detected by the lock-in). Confocal fluorescence of the Alexa488 is shown, scaled from 0 to its maximum intensity, without applying any background subtraction. Overlay: fluorescence (red), FWM amplitude (green). | ||
Confocal fluorescence of the Alexa488 fluorophore was performed on the same regions of interest, using a separate instrument. Regions were accurately mapped by the aid of gridded coverslips and DIC. To avoid photobleaching, confocal microscopy was performed prior to FWM acquisition. For direct comparison, images are shown in Fig. 4 also as single xy planes at the glass substrate interface, identified with the aid of DIC. The observed spatial pattern of the fluorescence intensity is less clear compared to Fig. 1 in terms of representing Tf(A488) which has been internalised and is contained in intracellular vesicles.24 Note that these fluorescence images are shown as measured, without background subtraction. A large area overview is shown in the ESI Fig. 8† as maximum intensity projection over the cell height, and with background subtraction (see Experimental section). It should be mentioned that the excitation/detection conditions needed for the Alexa488 are known to result in larger cellular autofluorescence backgrounds compared to Alexa647, which might partly explain the reduced clarity in the observed spatial pattern (see ESI Fig. S6†).
When comparing the spatial patterns observed in FWM and in confocal fluorescence, there is generally poor correlation, which is qualitatively shown by the overlay images in Fig. 4. As discussed previously, to account for small rotation and translation adjustments, we calculated the image cross correlation coefficient as a function of relative translation and rotation coordinates. In this case, for panel B we found a maximum value rP = 0.15 near the center for a rotation angle of −4 degrees (see ESI Fig. 3†), indicating spatial correlation, as opposed to the two cases discussed previously with the 40 nm AuNP-SA-Bi-Tf(A647) and 10 nm AuNP-SA(A488)-Bi-Tf(A647) constructs. However, the value of the correlation coefficient is still fairly low. For the images in panel A and C, no significant spatial correlation was found. The reasons for this poor correlation again could be several. Even though the 15 nm AuNP-PC-Tf(A488) construct was prepared following centrifugation and purification steps, it is possible that some unbound Tf(A488) was present in the stock solution. This could explain the observation of fluorescence from Alexa488, as expected from internalized Tf, but not co-localised with AuNPs. It is also possible that after 2 hours trafficking, the construct is partly broken down. Moreover, the fluorophore might be quenched near the surface of AuNPs. In addition, especially in this case, it is possible that some of the observed fluorescence is actually cellular autofluorescence, thus unrelated to the location of the AuNPs. Indeed, it is also for this reason that we show the plane at the glass substrate interface in Fig. 4, since at that position we could observe and investigate AuNPs lying onto the glass surface, outside the cell. Yet, there is no correlation between fluorescence and FWM even for AuNPs outside the cell (see also additional data in the ESI Fig. S9†), suggesting that fluorophore quenching or bleaching near the surface of AuNPs might be the major limiting factor. These results further exemplify the various problems of fluorescence microscopy compared to our FWM technique, in providing a reliable readout for the AuNP location.
Since all the AuNP–fluorophore conjugates studied so far had been developed in house, as a comparison we investigated a commercially available system. Innovacoat gold nanoparticles consist of a proprietary protective surface to which molecules can be covalently bound. We conjugated the commercially available Alexa647 labelled goat anti-rabbit antibody onto the 20 nm diameter AuNP Innovacoat system to form 20 nm AuNP-PC-Ab(A647) (see Table 1 and Experimental section). This is a non-targeting fluorescently-labelled antibody resulting in non-specific uptake. Note that we followed the manufacturer recommended wash protocol, in order to obtain a conjugate nominally 100% free from unbound antibody. To showcase the general applicability of the method, we used this construct on a different cell line, namely 3T3-L1 cells (see Experimental section). These are murine fibroblast cells, typically much bigger than human HeLa cells.
Fig. 5 shows examples of images for A2r+ and AFWM+ obtained on 3T3-L1 cells loaded with the 20 nm AuNP-PC-Ab(A647) construct. Notably, for these experiments, the FWM instrument had been upgraded to enable simultaneous FWM and confocal fluorescence microscopy (see Experimental section). The reflection images A2r+ correlate with the cell contour seen on the corresponding regions (highlighted by white frames) in DIC. Once again, FWM microscopy revealed the location of individual AuNPs background free, and we observed a density of ∼0.1 AuNP per μm3 similar to Fig. 1, consistent with having used a comparable NP concentration (2.6 × 10¹⁰ AuNP per mL) and uptake time (15 min). Since fluorescence is acquired simultaneously, we can examine the spatial pattern at any selected region, in-plane and axially, without the need for post-acquisition re-registration adjustments. Fig. 5 shows selected planes (from acquired z-stacks) at the glass surface interface (regions A, C), and inside the cell (region B). The fluorescence pattern is again not correlating with the AuNP distribution as observed in FWM (rP < 0.02). From this pattern and the measured intensity, it appears that the signal is dominated by cellular autofluorescence, as seen by comparison with unlabeled cells (see ESI Fig. S10†). Yet, even in regions outside the cell, hence not affected by cellular autofluorescence, and where a few AuNPs are observed (region A right, region C top left), the fluorescence intensity is indistinguishable from the background. These results thus suggest that either the Alexa647 is bleached, to the extent of making it undetectable against the background even outside the cell, or is actually not attached to the AuNP.
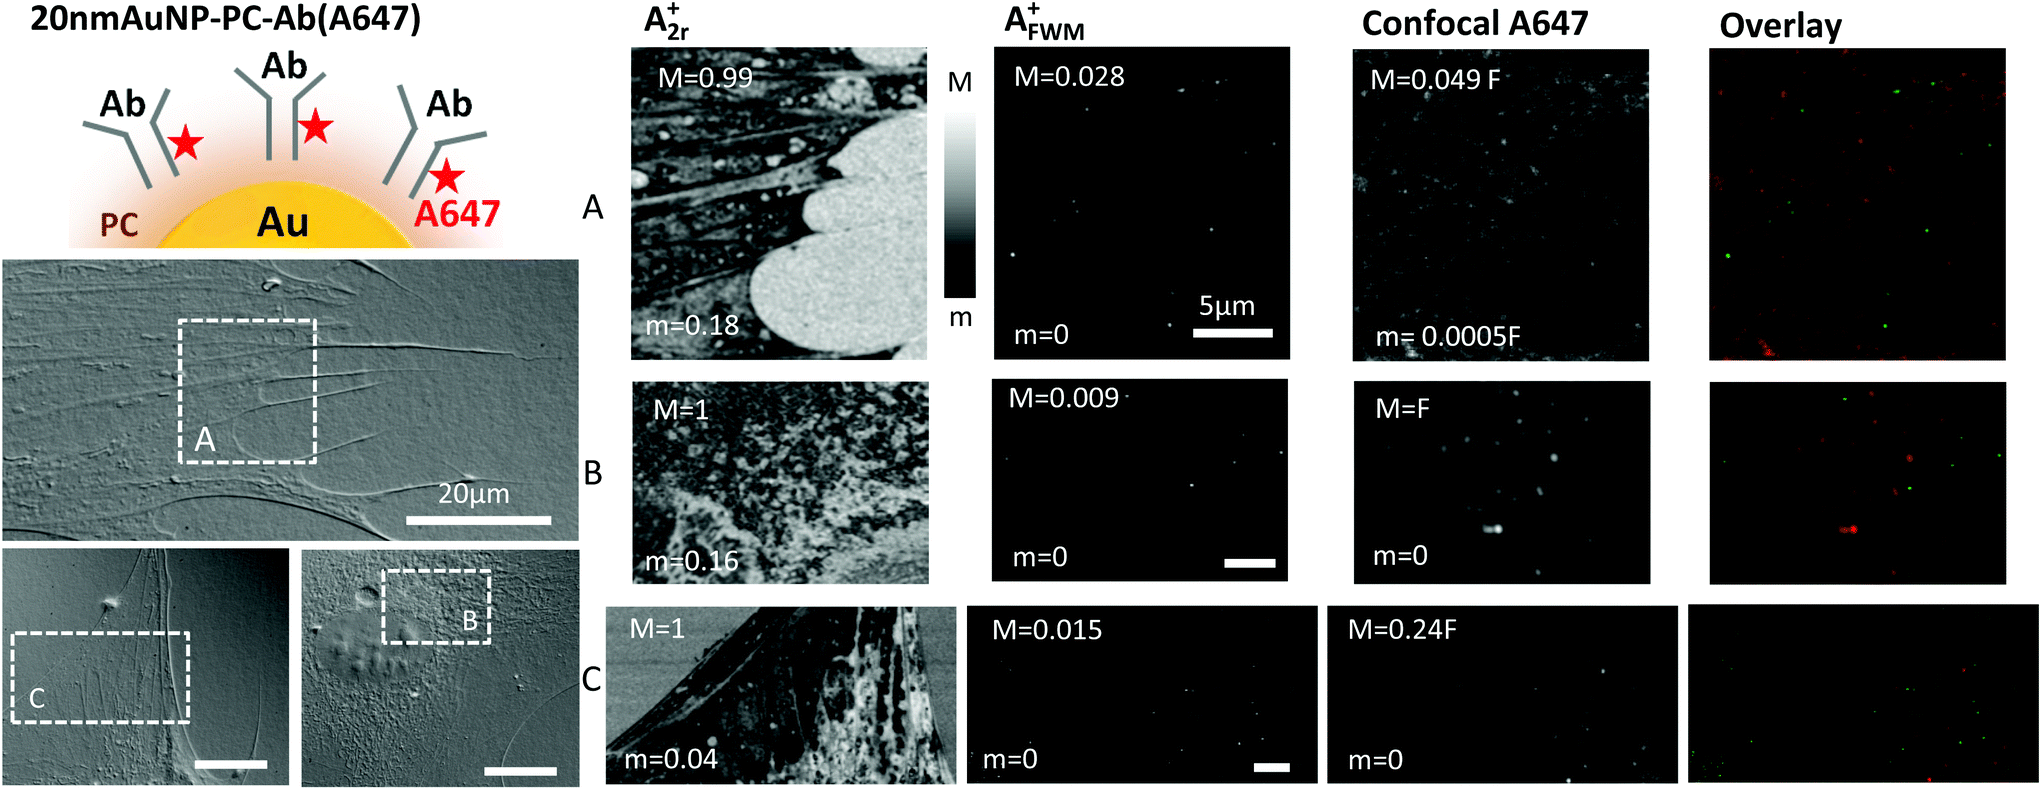 | ||
| Fig. 5 Top left: Sketch of the AuNP construct. Bottom left: Fixed 3T3L1 cells that have internalized 20 nm AuNP-PC-Ab(A647) imaged by differential interference contrast microscopy. Right: Reflection amplitude (A2r+), FWM amplitude (AFWM+) and confocal fluorescence microscopy of the regions highlighted in DIC. FWM was acquired with a pump–probe delay time of 0.5 ps, and pump (probe) power at the sample of 62 μW (31 μW). The pixel dwell time was 0.3 ms for region A, 0.5 ms for B, and 0.4 ms for C. Pixel size in plane was 45 nm for A, 62 nm for B and C. FWM, reflection, and fluorescence are acquired simultaneously and shown on a single x,y plane, at the glass substrate interface for A and C, and on a selected plane inside the cell for B. Grey scales are linear from m to M, as indicated (M = 1 corresponds to 9.2 mV rms detected by the lock-in). Overlay: fluorescence (red), FWM amplitude (green). | ||
To answer this final question, we then studied the commercial construct itself, spin coated onto a glass surface, correlatively imaged using extinction and wide-field fluorescence microscopy, similar to what we have shown for the 10 nm AuNP-SA(A488) in Fig. 3. These results are shown in Fig. 6. Also in this case, the 20 nm AuNP-PC-Ab(A647) solution was washed to reduce the presence of unbound antibodies (see Experimental section). From the extinction contrast images we have again quantified the extinction cross-section of a set of representative AuNPs, and in turn their diameter D, using the cross-section values from theory in a homogeneous medium index matched to glass27 (the entire FOV with all representative AuNPs is given in the ESI Fig. S15 and S16†). The measured cross-sections are well above the detection limit, shown by the distribution of cross-section values in regions without AuNPs (indicated as “background” in Fig. 6 left). For these high cross-sections, it was not necessary to optically clear the glass surface by immersing the sample in indexed match oil, hence all measurements were performed in air. Prior to extinction microscopy, the sample was imaged in air by wide-field fluorescence microscopy (see Experimental section). The results in the same regions are shown in Fig. 6 and reveal many unbound Alexa647 fluorophores for the 1× washed sample. Note that under the excitation and detection conditions needed for this experiment, glass coverslips showed a negligible autofluorescence background (see ESI Fig. S12†). When repeating the wash protocol three times, the number of unbound Alexa647 was significantly reduced and a good co-localisation was measured between AuNPs and fluorophores (rP = 0.476). Fig. 6 right shows a colored overlay of extinction and fluorescence microscopy, and the calculated cross-correlation coefficient rP. A map of rPversus relative translation of the images is shown in the ESI Fig. S5.† It should be noted that a single wash is the manufacturer recommended protocol, in order to obtain a conjugate nominally 100% free from unbound antibody. Our results clearly show that this is not the case.
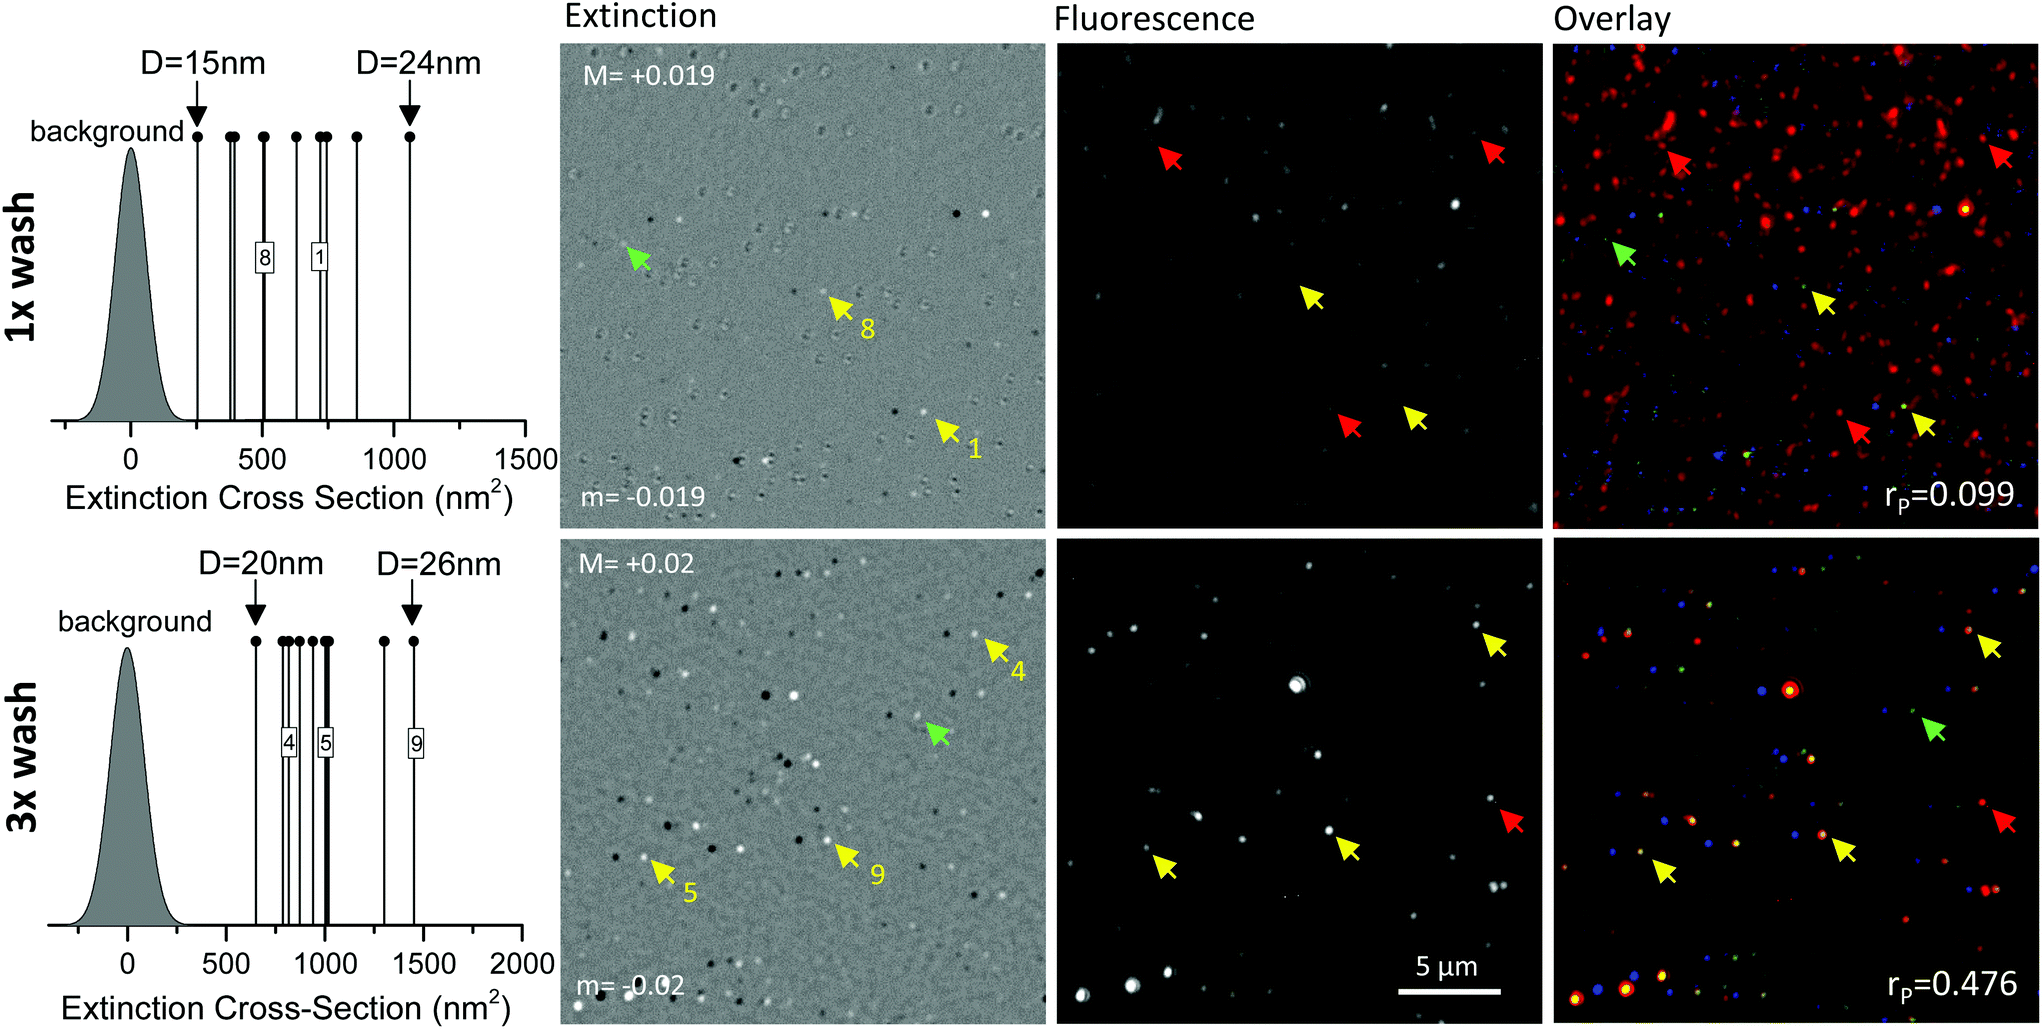 | ||
| Fig. 6 20 nm AuNP-PC-Ab(A647) imaged by correlative wide-field fluorescence and extinction microscopy. The AuNP solution was washed once (top) or 3 times (bottom) to reduce the presence of unbound antibodies. AuNPs were deposited on glass and imaged in air. Extinction cross-sections of ten representative single particles in the FOV are indicated on the left panels, with corresponding particle diameter ranges, above the detection limit (background histogram, see text). Extinction contrast images are shown on grey scale from m (black) to M (white), as indicated, with yellow arrows pointing to selected single AuNPs for which the cross-section was quantified, as labelled (images shown are 30% of the FOV). Fluorescence images of the same area are shown on a grey scale from 0.03Fm to 0.39Fm (top) and from 0.03Fm to 0.22Fm (bottom), with Fm being the maximum amplitude in the FOV. Overlay: fluorescence (red), extinction maxima (green) extinction minima (blue). In the overlay, amplitudes are re-scaled to maximize colour overlap. Green arrows indicate AuNPs visible only in extinction. Red arrows indicate unbound fluorophores. The cross-correlation (Pearson's) coefficient rP is given. | ||
Even though there are unbound Ab(A647), it appears that when AuNPs are detected, they have the Ab(A647) attached and still fluorescing to a good degree in this construct. The full FOV for the images in Fig. 6 is available in the ESI Fig. S16† from which we deduced that about 70% of AuNPs are co-localised with fluorescence from Ab(A647). In addition, we have compared the average fluorescence emission from single unbound fluorophores with the typical fluorescence emission observed for single AuNPs in these data, see Fig. S17 in the ESI.† A consistent picture is found, whereby single AuNPs exhibiting fluorescence have about 135 fluorophores attached, each quenched down to 10% emission relative to free space due to Förster-transfer at an average 5 nm distance between the dye and the AuNP surface.36
It is thus possible that the results in Fig. 5 are due to photobleaching of the Alexa647. Notably for this experiment, fluorescence excitation was provided by the ultrafast laser source of the FWM experiment, which in turn results in a very high peak power (∼105 kW cm−2), even when the average power is kept comparable to or lower than conventional one-photon confocal fluorescence. Moreover, the local field enhancement effect can cause additional fluorophore bleaching, specifically at the AuNP location. All these points further exemplify the various limitations of fluorescence microscopy when applied to AuNP–fluorophore conjugates.
4. Conclusions
In summary, we have investigated in detail four types of AuNP–fluorophore conjugates inside cells, whereby AuNPs are imaged by four-wave mixing owing to their intrinsic optical nonlinearity from the hot electron gas in the metal, and fluorophores are detected by confocal or wide-field fluorescence microscopy in the same spatial regions. Our results query the reliability of fluorescence based techniques in providing a readout for the AuNP location inside cells. In all cases, AuNPs imaged by FWM and labeled proteins imaged by fluorescence poorly co-localise. There is evidence that commercially available constructs contain a large amount of fluorescent labels not bound to the AuNPs, even after following manufacturer specified washing protocols. In addition, fluorescence techniques may fail due to fluorophore photobleaching, non-radiative quenching at the AuNP, as well as autofluorescence background severely limiting detection sensitivity. Overall, it is clear that solely relying on the detection of fluorescence with these systems would lead to misleading conclusions on the intracellular fate of AuNPs, and their potential for therapeutic delivery.Conversely, we show that our FWM detection is sensitive to single small AuNPs with diameters down to 10 nm, is background free even inside scattering and auto-fluorescing environments, and accurately provides the 3D location of these AuNPs. Notably, there is the potential to achieve nanometer localisation precision with this imaging technique, by applying similar methodologies as those used in localization microscopy, i.e. determining the centroid position of a single emitter with a precision better than the point spread function width. Overall, this technique opens the prospect to an unprecedented level of understanding of the intracellular fate of small AuNPs, and is potentially applicable to living cells.
Author contribution
PB and WL conceived the FWM technique. NG, PB, PW, AJ, CA designed the experiments. NG, JW, PM, ES, performed the experiments. NG, PM, ES, JM, PW, JW prepared the samples. NG, JW and PB analyzed the data. IP and LP supported the data acquisition and analysis. PB wrote the manuscript. All authors discussed and interpreted the results and commented on the manuscript.Data availability
Information about the data created during this research, including how to access it, is available from Cardiff University data archive at http://doi.org/10.17035/d.2019.0081702601.Conflicts of interest
There are no conflicts to declare.Acknowledgements
This work was funded by the EPSRC [grants no. EP/I005072/1, EP/I016260/1, EP/L001470/1, EP/J021334/1, and EP/M028313/1] and the EU [FP7 grant no. ITN FINON 607842]. JW acknowledges funding by an EPSRC DTA studentship [EP/M507842/1]. PB acknowledges the Royal Society for her Wolfson Research Merit Award [grant no. WM140077]. CA acknowledges funding from EPSRC [grants EP/J021180/1, EP/H005625/1, and EP/J021334/1] and the Royal Society [Wolfson Research Merit Award WM150086].References
- X. Han, K. Xu, O. Taratulab and K. Farsadc, Nanoscale, 2019, 11, 799–819 RSC.
- E. B. Ehlerding, P. Grodzinski, W. Cai and C. H. Liu, ACS Nano, 2018, 12, 2106–2121 CrossRef CAS PubMed.
- R. M. Pallares, N. T. K. Thanh and X. Su, Nanoscale, 2019, 11, 22152–22171 RSC.
- J. Kneipp, ACS Nano, 2017, 11, 1136–1141 CrossRef CAS PubMed.
- J. Liu, R. Zhang and Z. P. Xu, Small, 2019, 15, 1900262 CrossRef PubMed.
- Z. Li, E. Ye, David, R. Lakshminarayanan and X. J. Loh, Small, 2016, 12, 4782–4806 CrossRef CAS PubMed.
- X. Zhen, P. Cheng and K. Pu, Small, 2019, 15, 1804105 CrossRef PubMed.
- J.-J. Hu, Y.-J. Cheng and X.-Z. Zhang, Nanoscale, 2018, 10, 22657–22672 RSC.
- P. de Boer, J. P. Hoogenboom and B. N. G. Giepmans, Nat. Methods, 2015, 12, 503–513 CrossRef CAS PubMed.
- T. Fujiwara, K. Ritchie, H. Murakoshi, K. Jacobson and A. Kusumi, J. Cell Biol., 2002, 157, 1071–1081 CrossRef CAS PubMed.
- L. M. Payne, W. Langbein and P. Borri, Phys. Rev. Appl., 2018, 9, 034006 CrossRef CAS.
- A. Zilli, W. Langbein and P. Borri, ACS Photonics, 2019, 6, 2149–2160 CrossRef CAS.
- H. Ueno, S. Nishikawa, R. Iino, K. V. Tabata, S. Sakakihara, T. Yanagida and H. Noji, Biophys. J., 2010, 98, 2014–2023 CrossRef CAS PubMed.
- J. Ortega-Arroyo and P. Kukura, Phys. Chem. Chem. Phys., 2012, 14, 15625–15636 RSC.
- Y. Gu, X. Di, W. Sun, G. Wang and N. Fang, Anal. Chem., 2012, 84, 4111–4117 CrossRef CAS PubMed.
- D. Lasne, G. A. Blab, S. Berciaud, M. Heine, L. Groc, D. Choquet, L. Cognet and B. Lounis, Biophys. J., 2006, 91, 4598–4604 CrossRef CAS PubMed.
- A. C. Wong and D. W. Wright, Small, 2016, 12, 5592–5600 CrossRef CAS PubMed.
- I. Kandela and R. Albrecht, Scanning, 2007, 29, 152–161 CrossRef CAS PubMed.
- P. Anger, P. Bharadwaj and L. Novotny, Phys. Rev. Lett., 2006, 96, 113002 CrossRef PubMed.
- B. T. Miles, A. B. Greenwood, D. Benito-Alifonso, H. Tanner, M. C. Galan, P. Verkade and H. Gersen, Sci. Rep., 2017, 7, 44666 CrossRef CAS PubMed.
- X. A. Wu, C. H. J. Choi, C. Zhang, L. Hao and C. A. Mirkin, J. Am. Chem. Soc., 2014, 136, 7726–7733 CrossRef CAS PubMed.
- M. Liu, Q. Li, L. Liang, J. Li, K. Wang, J. Li, M. Lv, N. Chen, H. Song, J. Lee, J. Shi, L. Wang, R. Lal and C. Fan, Nat. Commun., 2017, 8, 15646 CrossRef CAS PubMed.
- G. Zoriniants, F. Masia, N. Giannakopoulou, W. Langbein and P. Borri, Phys. Rev. X, 2017, 7, 041022 Search PubMed.
- P. R. Moody, E. J. Sayers, J. P. Magnusson, C. Alexander, P. Borri, P. Watson and A. T. Jones, Mol. Ther., 2015, 23, 1888–1898 CrossRef CAS PubMed.
- E. J. Sayers, J. P. Magnusson, P. R. Moody, F. Mastrotto, C. Conte, C. Brazzale, P. Borri, P. Caliceti, P. Watson, G. Mantovani, J. Aylott, S. Salmaso, A. T. Jones and C. Alexander, Bioconjugate Chem., 2018, 29, 1030–1046 CrossRef CAS PubMed.
- L. M. Payne, W. Langbein and P. Borri, Appl. Phys. Lett., 2013, 102, 131107 CrossRef.
- L. Payne, G. Zoriniants, F. Masia, K. P. Arkill, P. Verkade, D. Rowles, W. Langbein and P. Borri, Faraday Discuss., 2015, 184, 305–320 RSC.
- F. Masia, W. Langbein, P. Watson and P. Borri, Opt. Lett., 2009, 34, 1816–1818 CrossRef PubMed.
- F. R. Maxfield and T. E. McGraw, Nat. Rev. Mol. Cell Biol., 2004, 5, 121–132 CrossRef CAS PubMed.
- S. Tortorella and T. C. Karagiannis, J. Membr. Biol., 2014, 247, 291–307 CrossRef CAS PubMed.
- F. Masia, W. Langbein and P. Borri, Phys. Rev. B: Condens. Matter Mater. Phys., 2012, 85, 235403 CrossRef.
- E. Betzig, G. H. Patterson, R. Sougrat, O. W. Lindwasser, S. Olenych, J. S. Bonifacino, M. W. Davidson, J. Lippincott-Schwartz and H. F. Hess, Science, 2006, 313, 1642–1645 CrossRef CAS PubMed.
- S. Bolte and F. P. Cordèlieres, J. Microsc., 2006, 224, 213–232 CrossRef CAS PubMed.
- C. Eggeling, J. Widengren, R. Rigler and C. A. M. Seidel, Anal. Chem., 1998, 70, 2651–2659 CrossRef CAS PubMed.
- L. M. Payne, A. Zilli, Y. Wang, W. Langbein and P. Borri, Proc. SPIE 10892, Colloidal Nanoparticles for Biomedical Applications XIV, 2019, 108920J.
- P. Holzmeister, E. Pibiri, J. J. Schmied, T. Sen, G. P. Acuna and P. Tinnefeld, Nat. Commun., 2014, 5, 5356 CrossRef CAS PubMed.
Footnote |
| † Electronic supplementary information (ESI) available: Fig. S1–S17. See DOI: 10.1039/C9NR08512B |
| This journal is © The Royal Society of Chemistry 2020 |