
 Open Access Article
 This Open Access Article is licensed under a
 Creative Commons Attribution 3.0 Unported Licence
Molecular-scale thermoelectricity: a worst-case scenario†
Ali K.
Ismael
ab and
Colin J.
Lambert
 *a
*a
aDepartment of Physics, Lancaster University, Lancaster LA1 4YB, UK. E-mail: c.lambert@lancaster.ac.uk
bDepartment of Physics, College of Education for Pure Science, Tikrit University, Tikrit, Iraq
First published on 13th May 2020
Abstract
This article highlights a novel strategy for designing molecules with high thermoelectric performance, which are resilient to fluctuations. In laboratory measurements of thermoelectric properties of single-molecule junctions and self-assembled monolayers, fluctuations in frontier orbital energies relative to the Fermi energy EF of electrodes are an important factor, which determine average values of transport coefficients, such as the average Seebeck coefficient 〈S〉. In a worst-case scenario, where the relative value of EF fluctuates uniformly over the HOMO–LUMO gap, a “worst-case scenario theorem” tells us that the average Seebeck coefficient will vanish unless the transmission coefficient at the LUMO and HOMO resonances take different values. This implies that junction asymmetry is a necessary condition for obtaining non-zero values of 〈S〉 in the presence of large fluctuations. This conclusion that asymmetry can drive high thermoelectric performance is supported by detailed simulations on 17 molecules using density functional theory. Importantly, junction asymmetry does not imply that the molecules themselves should be asymmetric. We demonstrate that symmetric molecules possessing a localised frontier orbital can achieve even higher thermoelectric performance than asymmetric molecules, because under laboratory conditions of slight symmetry breaking, such orbitals are ‘silent’ and do not contribute to transport. Consequently, transport is biased towards the nearest “non-silent” frontier orbital and leads to a high ensemble averaged Seebeck coefficient. This effect is demonstrated for a spatially-symmetric 1,2,3-triazole-based molecule, a rotaxane-hexayne macrocycle and a phthalocyanine.
New conceptsThe design of new thermoelectric materials for converting waste heat directly into electricity is a global challenge. To avoid the cost and toxicity of available inorganic materials, there is a need to identify organic materials, whose thermoelectric performance can be optimised through chemical synthesis, guided by principles of molecular-scale quantum transport. However single-molecule junctions and self-assembled monolayers suffer for atomic-scale variability at the molecule–electrode interfaces and in the surroundings, which lead to a decrease in their thermoelectric performance. To overcome this problem, we introduce a new concept of utilising organic molecules with ‘silent orbitals’. Silent orbitals are frontier orbitals, which are localised within the core of a molecule and reduce the effect of fluctuations, leading to an increase in thermoelectric performance. This general principle is illustrated by examining the properties of 17 different molecules, including a 1,2,3-triazole-based molecule, a rotaxane-hexayne macrocycle and a phthalocyanine, all of which possess silent orbitals. |
Introduction
During the past few years, driven by the desire to design high-performance thermoelectric materials, the search for high-Seebeck-coefficient organic materials1–12 has stimulated many investigations of the Seebeck coefficients of single molecules trapped between metallic electrodes.13–32 When a single molecule is placed between a source and drain electrode, quantum interference (QI) of electrons passing through the resulting single-molecule junction is determined by a combination of the chemistry of the molecule and the physics of the electrodes and can only be described quantitatively by treating both ingredients to the same level of accuracy. Ab initio descriptions such a density functional theory combined with quantum transport theory33,34 have proved to be successful in this respect and are able to describe trends in experimental measurements of single-molecule electrical and thermoelectrical properties.35–38 These theories compute the transmission coefficient T(E) of electrons of energy E passing from one electrode to the other via the molecule and note that the Seebeck coefficient S is proportional to the negative slope of ln![[thin space (1/6-em)]](https://www.rsc.org/images/entities/char_2009.gif) T(E), evaluated at the Fermi energy EF of the electrodes. More precisely, if the slope of T(E) does not change significantly on the scale of kBT, where kB is Boltzmann's constant and T is the temperature, then
T(E), evaluated at the Fermi energy EF of the electrodes. More precisely, if the slope of T(E) does not change significantly on the scale of kBT, where kB is Boltzmann's constant and T is the temperature, then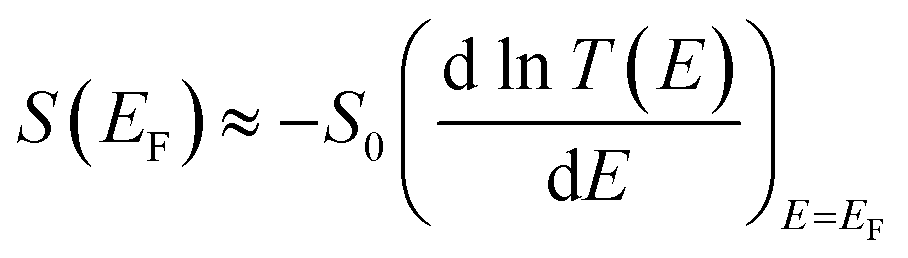 | (1) |
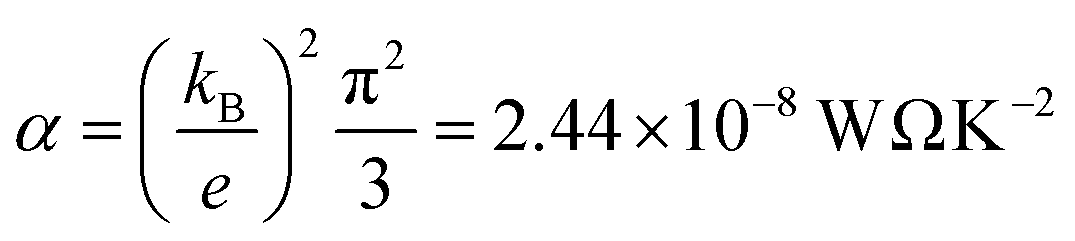 is the Lorenz number. On the other hand, if E is measured in units of electron volts, S0 = αT, which at T = 300 K, takes the value S0 = 7.3 μV K−1. This value sets the scale for single-molecule thermoelectricity. From eqn (1), if EF is known, then from the slope of lnT(E) at EF, one can determine the Seebeck coefficient.
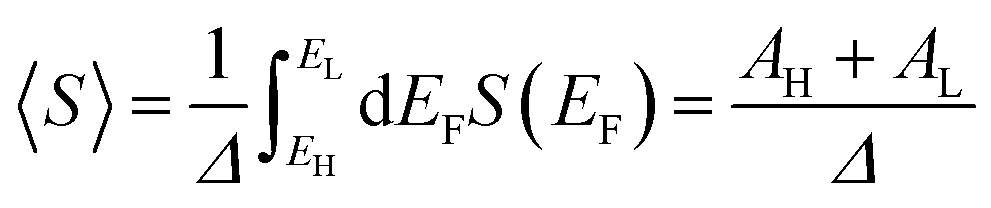
Despite intense efforts to improve the thermoelectric performance of single molecules, reported values of their Seebeck coefficients remain disappointingly low, because in experimental measurements of single-molecule thermoelectric properties, the location of the Fermi energy EF relative to the energies of frontier orbitals is sensitive to environmental effects, the shape and spacing of electrodes and the manner in which a molecule binds to the electrodes. Consequently measured single-molecule transport properties such as the Seebeck coefficient S exhibit large measurement-to-measurement fluctuations. To accommodate these fluctuations, it is standard practice to make many thousands of measurements of S, and then to quote their average value 〈S〉. In many cases, individual measurements of S could be large and positive or large and negative, but 〈S〉 is small due a cancellation of opposite signs in the average. Therefore, it is of interest to develop strategies for avoiding this sign cancellation and improving the ensemble-averaged thermoelectric performance, even in the presence of large fluctuations.
The aim of this paper is to confront this issue by considering a worst-case scenario, in which the relative value of EF varies randomly between the energy EH of the transmission resonance associated with highest occupied molecular orbital (HOMO) and the energy EL of the resonance associated with the lowest unoccupied molecular orbital (LUMO). We choose this range of EF, because most molecules measured to date are not redox active. For non-redox active molecules, EF is constrained to lie between the HOMO and LUMO, because if EF lies above EL or below EH, the molecule would gain or lose an electron respectively. Our aim is to identify molecular design strategies, which would lead to a large value of 〈S〉, even in a worst-case scenario, where EF is a random number, uniformly distributed between EH and EL.
Results and discussion
The analysis below leads us to conclude that in this worst-case scenario, to maximise the average single-molecule Seebeck coefficient, an ideal molecule should be non-redox-active, possess a spatially-extended frontier orbital along an axis connecting the terminal groups and possess a ‘silent’ frontier orbital. The latter is defined to be a HOMO or LUMO, which is weakly coupled to the electrodes, such that it barely contributes to the transmission coefficient of the molecule. To clarify this central result, consider three examples of such molecules, shown in Fig. 1a. The frontier orbitals of 1 and 2 are shown in Fig. S26–S28 of the ESI† whereas those of 3 are shown in Fig. 1b and c. Clearly the HOMO of this spatially-symmetric 1,2,3-triazole-based molecule is localised within the core of the molecule, whereas the LUMO is extended across the whole molecular backbone. A crucial consequence of the localised nature of the HOMO is that the associated transmission resonance is destroyed by tiny fluctuations in the coupling between the terminal thio-acetate groups of the molecule and the electrodes, and therefore in a real experiment, where such fluctuations are inevitable, the HOMO is ‘silent’ and does not contribute to the transmission function T(E). This is demonstrated by Fig. 2, which shows three plots of T(E) corresponding to three slightly different binding configurations to the electrodes. These transmission plots are obtained using density functional theory (DFT), combined with the Gollum quantum transport code.31 (see Methods for more details.)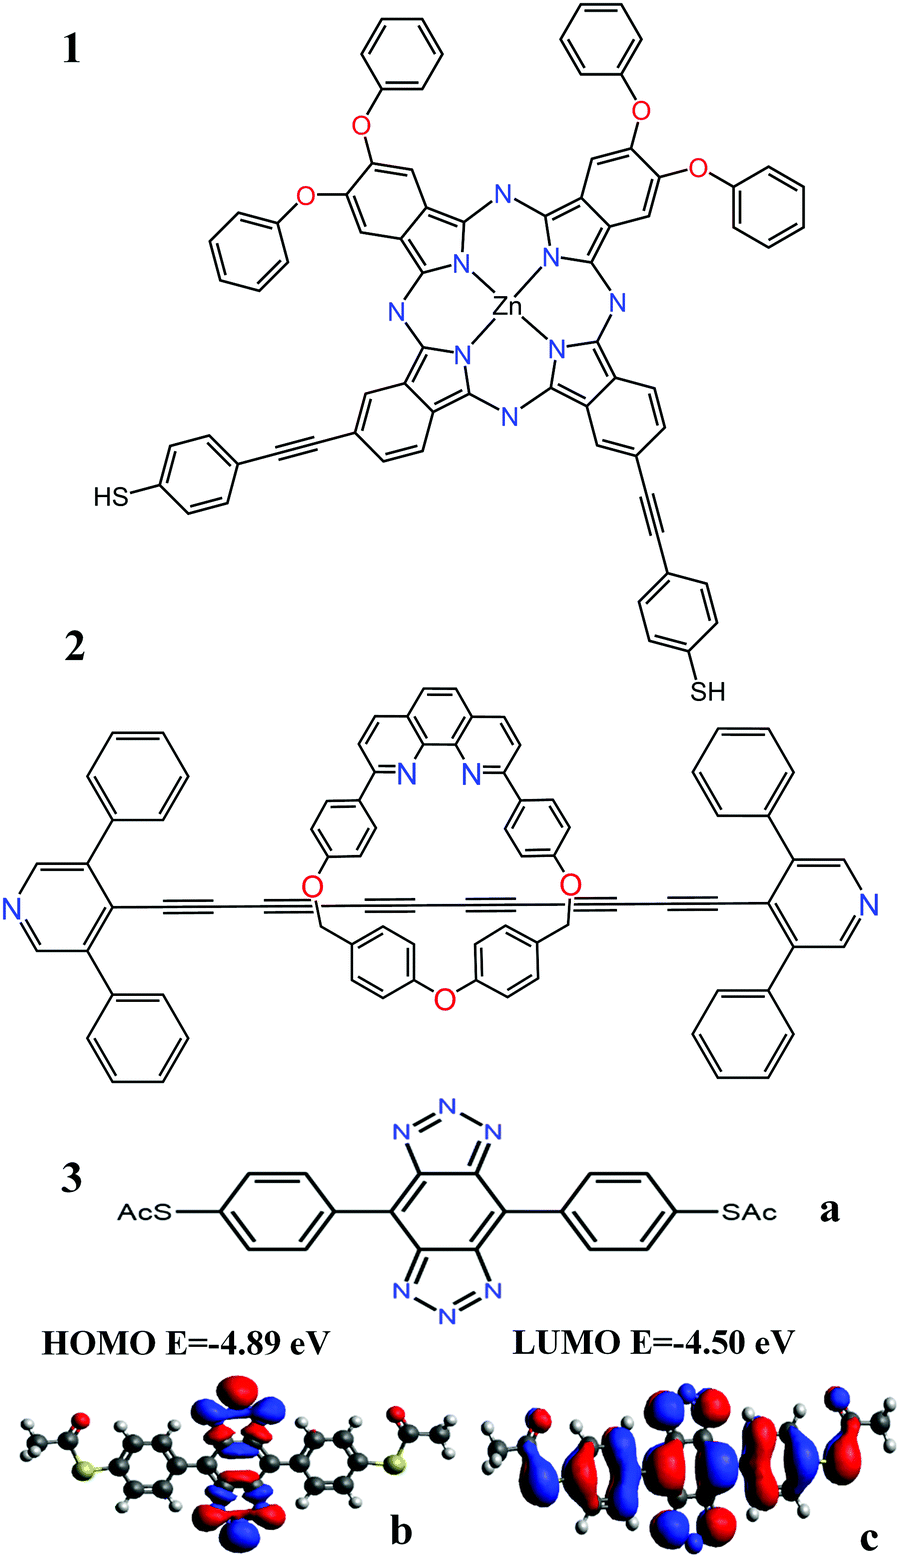 | ||
| Fig. 1 (a) Three molecules containing ‘silent’ orbitals, based on: 1 phthalocyanine, 2a rotaxane-hexayne macrocycle and 3 a spatially-symmetric 1,2,3-triazole-based molecule (b) a localised HOMO and (c) a delocalised LUMO (for frontier orbitals of 1 and 2 see Fig. S26–S28 of the ESI†). | ||
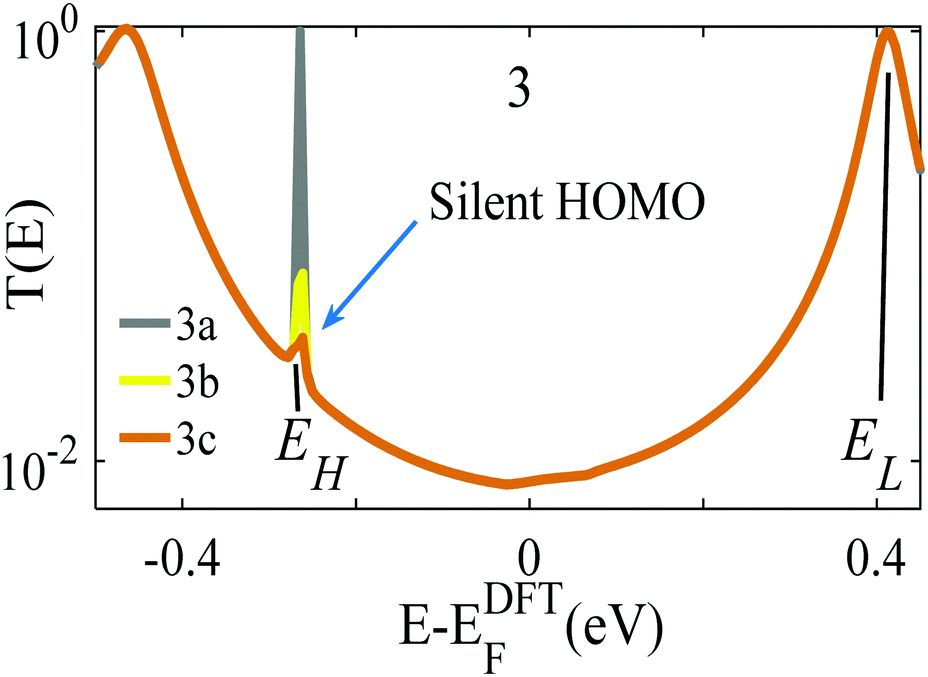 | ||
| Fig. 2 Three examples of transmission functions of the 1,2,3-triazole based molecule 3 of Fig. 1. The grey curve (labelled 3a) corresponds to an improbable symmetric situation, in which each terminal group binds with precisely the same geometry to atomically identical electrodes. The yellow and brown curves (labelled 3b, 3c) show the transmission functions of slightly asymmetric junctions, for which the transmission resonance at energy EH falls silent. | ||
The grey transmission curve in Fig. 2 corresponds to an improbable symmetric junction, in which each terminal group binds with precisely the same geometry to atomically identical electrodes. In this case, there is a narrow transmission resonance associated with the HOMO, at energy EH, with a maximum value of T(EH) = 1 and a much broader resonance associated with the LUMO, at energy EL, which also has a maximum value of T(EL) = 1. As discussed below, these high values of T(EH) and T(EL) are a consequence of spatial symmetry. However, experimentally, in a real junction, where molecules bind randomly to electrodes, such a precise symmetry is highly improbable. In contrast, the yellow and brown curves in Fig. 2 show the transmission functions of slightly asymmetric junctions, which arise when the distances between the terminal groups and the nearest gold electrode atoms at opposite ends of the molecule differ by a mere 0.1 Å, or their angles differ by <5°. This tiny symmetry breaking causes the HOMO to fall ‘silent’ and the HOMO resonance to disappear, whereas the LUMO resonance is unaffected and maintains a high value of T(EL) = 1.
This destruction of narrow resonances due to symmetry breaking is advantageous, because as demonstrated below, in a worst-case scenario, where the Fermi energy fluctuates between the HOMO and LUMO, the average room-temperature Seebeck coefficient of the improbable symmetric junction 3a (grey curve of Fig. 2) is almost zero. In contrast, for the slightly asymmetric junctions 3b and 3c (yellow/brown curves of Fig. 2) the average room-temperature Seebeck coefficients are large and can exceed 140 μV K−1. Fig. S6 and S7 (ESI†) show that this is a generic feature of such molecules, because as shown in Fig. S26 and S27 (ESI†), 1 possesses a localised LUMO, whereas 2 possess a localised HOMO. Consequently, as demonstrated by Fig. S6 and S7 (ESI†), in the presence of small symmetry-breaking fluctuations in their junction geometries, their LUMO and HOMO resonances respectively fall silent and their average Seebeck coefficients are enhanced.
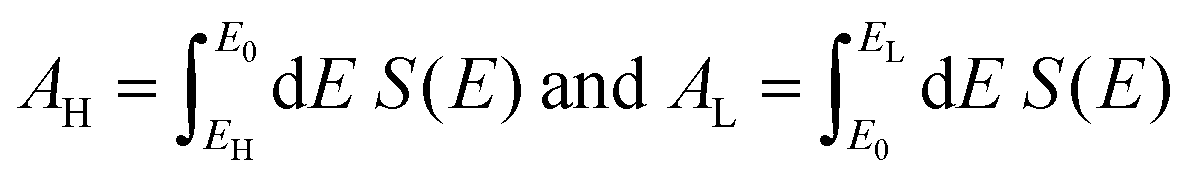
To demonstrate why non-redox-active, symmetric molecules possessing a silent frontier orbital are the molecules of choice in a worst-case-scenario, we now present a detailed analysis of four typical examples of transmission coefficients, which could be encountered in a spatially-symmetric single-molecule junction. Each transmission coefficient in Fig. 3 possesses HOMO and LUMO resonances and passes through a minimum at some energy E0 within the HOMO–LUMO gap. Fig. 3 demonstrates that even if a molecular junction is spatially symmetric, plots of the associated transmission function versus energy are not necessarily symmetric about the middle of the HOMO–LUMO gap. Fig. 3a and b show transmission coefficients, which are symmetric about the gap centre EHL = (EH + EL)/2, whereas Fig. 3c (Fig. 3d) shows a transmission coefficient, which is asymmetric, with a predominantly positive (negative) slope over a large energy range E0 < E < EL (EH < E < E0).
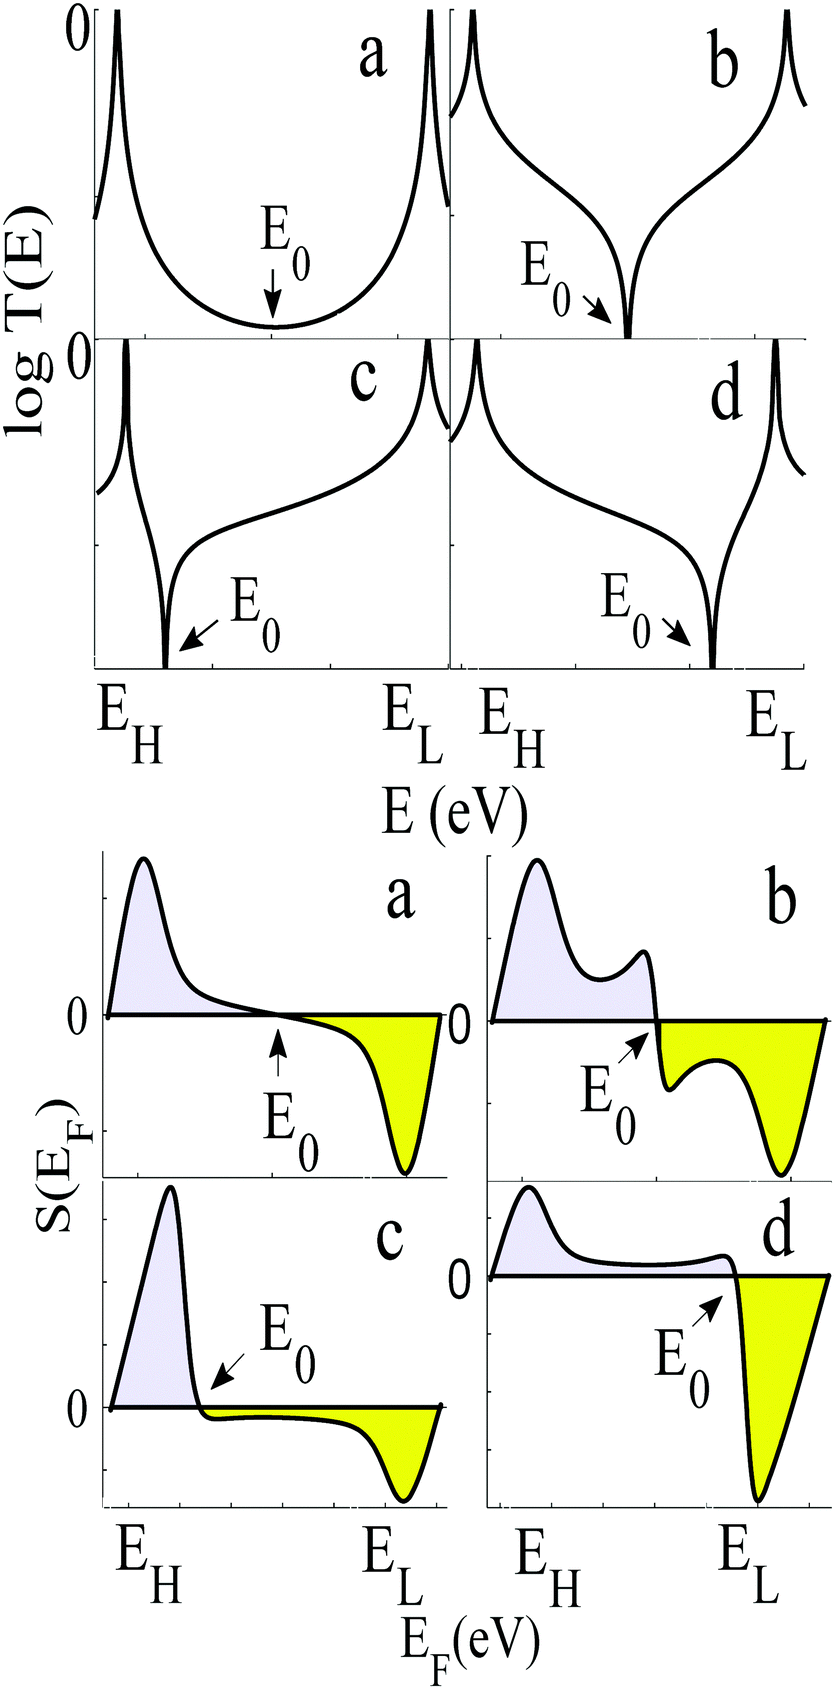 | ||
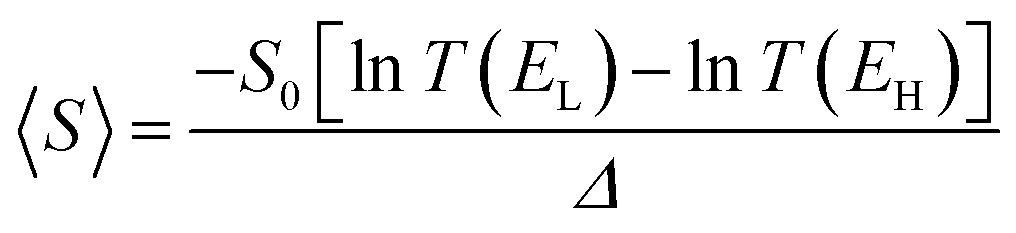
| Fig. 3 Upper panel: Four examples of transmission curves of spatially-symmetric junctions. (a) exhibits CQI, (b) exhibits DQI and both symmetric about the gap centre, (c) and (d) are asymmetric transmission curves. Lower panel: Four the corresponding Seebeck coefficients S obtained from the transmission coefficients in the top panel. Note that the area under each curve of S(EF) between EH and E0 (coloured grey) is equal and of opposite sign to the area under the curve between E0 and EL, (coloured yellow) as predicted by the WCS theorem, because for each of the four transmission coefficients in the upper panel, T(EH) = T(EL) | ||
Fig. 3a shows a transmission curve, which exhibits constructive quantum interference (CQI) within the HOMO–LUMO gap, signalled by a rather smooth parabolic minimum at an energy E0 between the HOMO and LUMO. Fig. 3b is a transmission function, which exhibits destructive quantum interference (DQI), signalled by a sharp dip in T(E) at an energy E0. For these transmission coefficients, E0 is located in the middle of the HOMO–LUMO gap, whereas for those Fig. 3c and d, the DQI dip is either below or above the gap centre. (For more details of the model leading to these transmission coefficients, see Section 1 of the ESI.†)
If EF is uniformly distributed between EH and EL, then molecules exhibiting symmetric transmission curves such as Fig. 3a and b are undesirable for thermoelectric applications, because the slope of T(E) and therefore the sign of S (from eqn (1)) is equally likely to be positive or negative and the average Seebeck coefficient 〈S〉 would be zero. On the other hand, for the transmission coefficient shown in Fig. 3c, the slope is positive and S is negative over a wide range of energy and therefore at first sight, such asymmetric transmission coefficients would appear to be more desirable. However, care must be taken, because in a worst-case scenario, when EF is uniformly distributed between the HOMO and LUMO energies, EH and EL, we now show that for the transmission coefficients of Fig. 3c and d, 〈S〉 = 0. Indeed when eqn (1) is valid, the average Seebeck coefficient is
 | (2) |
This theorem is easily proved, because if EF is a random variable with a probability distribution P(EF), then by definition
 | (3) |
Since integration is the reverse of differentiation, the WCS theorem (2) is obtained.
The WCS theorem tells us that if the HOMO and LUMO transmission resonances are equal (i.e. if T(EL) = T(EH)), then 〈S〉 = 0, even if the transmission function is asymmetric. Consequently in a worst-case scenario, the average Seebeck coefficients of the junctions of Fig. 3 vanish, because for these junctions T(EL) = T(EH).
An alternative way of viewing this vanishing of 〈S〉 is to note that the slopes of the plots of T(E) versus E in the upper panels of Fig. 3 change sign at some energy E = E0 and consequently, the corresponding plots of S(EF) versus EF in the lower panel change sign at EF = E0. In the worst-case scenario, where P(EF) = 1/Δ, for EL > EF > EH and zero outside this range, eqn (3) becomes
 | (4) |
 | (5) |
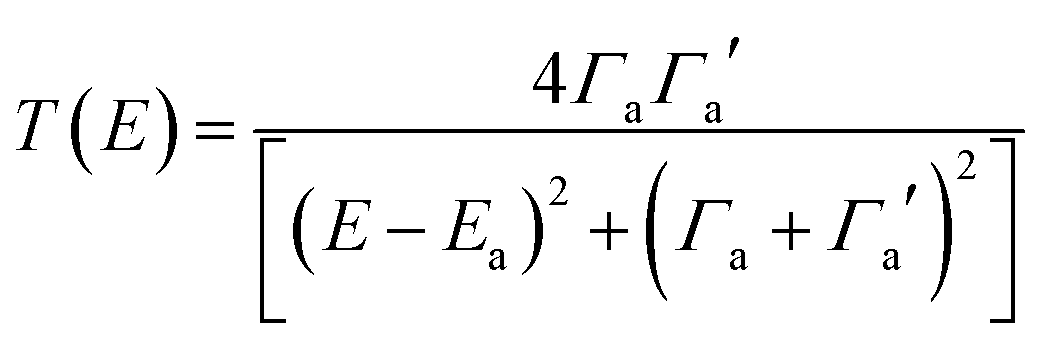
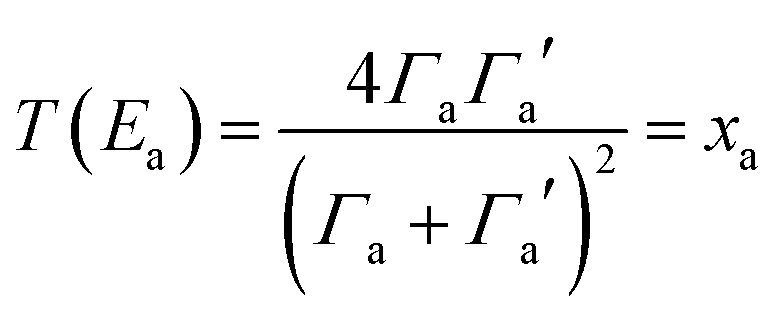
To avoid the equality T(EL) = T(EH), we note that the Breit Wigner formula39 tells us that for weakly coupled molecules with non-degenerate orbitals, a molecular junction (but not necessarily the molecule) must be spatially asymmetric. To illustrate this point, we note that when the transmission function T(E) possesses a resonance at an energy Ea (where in our case Ea is either EH or EL), the Breit–Wigner formula takes the form
 | (6) |
 | (7) |
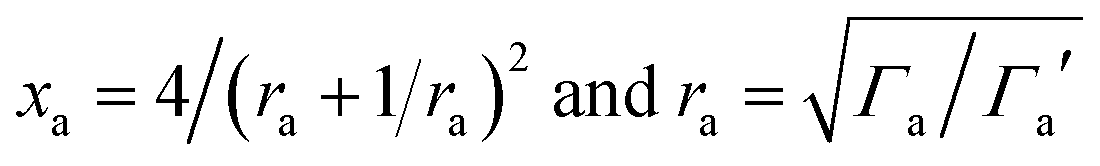 | (8) |
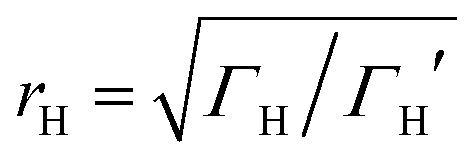 differs from the ratio
 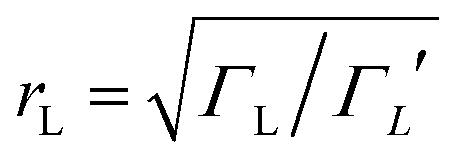 of the LUMO broadenings. Examples of such transmission functions are shown in Fig. 4.
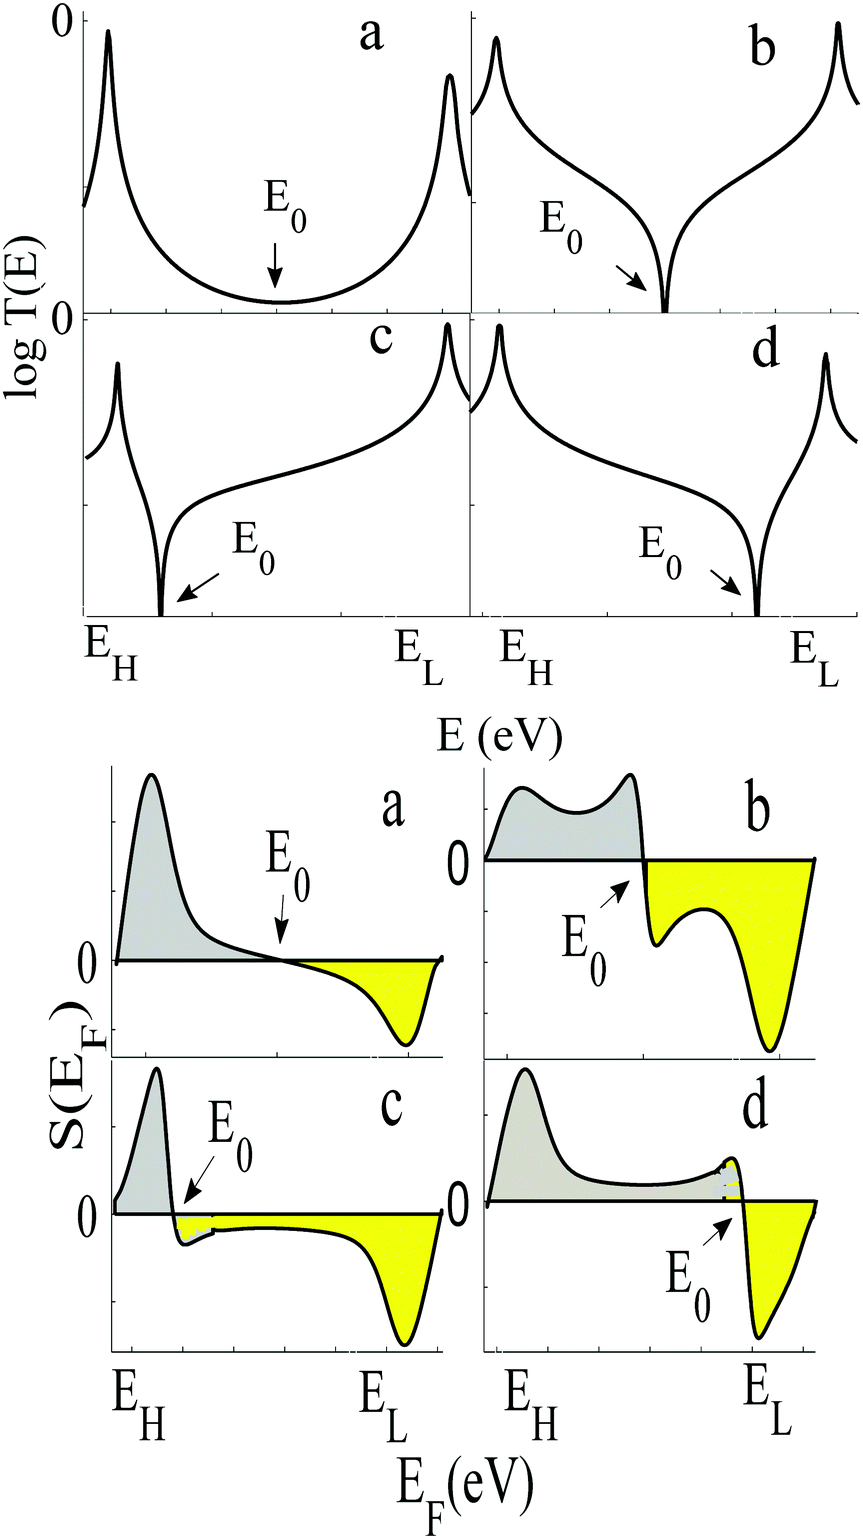 | ||
| Fig. 4 Upper panel: Examples of transmission functions associated with spatially asymmetric junctions, obtained from the tight-bonding model of Fig. S1 (ESI†). Lower panel: Four the corresponding Seebeck coefficient S obtained using eqn (1). Note that the area under each curve of S(EF) between EH and E0 (shaded grey) is not equal to the area under the curve between E0 and EL (shaded yellow), because for each of the four transmission coefficients in the upper panel, T(EH) ≠ T(EL). | ||
In contrast with the Seebeck plots of Fig. 3, which correspond to spatially-symmetric junctions, for the spatially-asymmetric junctions of Fig. 4 the (positive) area AH of the grey shaded region is not equal and opposite to the (negative) area AL of the yellow shaded region, and therefore from eqn (4) 〈S〉 ≠ 0.
We now argue that best way to achieve such asymmetric junctions is to utilise molecules with silent frontier orbitals, such as 1, 2 and 3. To demonstrate this result, we first consider a more obvious strategy of using spatially asymmetric molecules, such as 8, 9, 10, 11, 13, 14, 15, 16, 17 in Fig. 5. These contrast with the symmetric molecules 2, 3, 4, 6, 12, which possess a σv mirror plane and 5, 7, which possess a C2 axis. As expected, Fig. 6 shows that in a worst-case scenario, the room-temperature values of 〈S〉 of these asymmetric molecules (obtained by evaluating the finite temperature version of eqn (1), shown in eqn (S1) of Section 1 of the ESI†) are non-zero, whereas symmetric junctions formed from the more symmetric molecules (1–7 and 12) possess negligibly small values of 〈S〉. The transmission curves of each of these molecules are shown in the ESI,† along with their values of EH, E0 and EL. In Fig. 6, results for their room-temperature 〈S〉 are plotted against the transmission asymmetry parameter 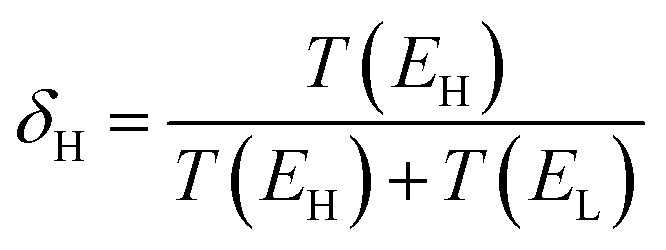 . The latter is close to 0 or 1 when T(EH) ≪ T(EL) or T(EH) ≫ T(EL) respectively and equals 0.5 when the HOMO and LUMO transmission resonances have equal values. Fig. 6 shows that negative values of 〈S〉 tend to arise when δH is small, whereas positive values of 〈S〉 tend to arise when δH is close to unity. In other words, the value of room-temperature 〈S〉 is closely correlated with δH, in agreement with the WCS theorem and eqn (2).
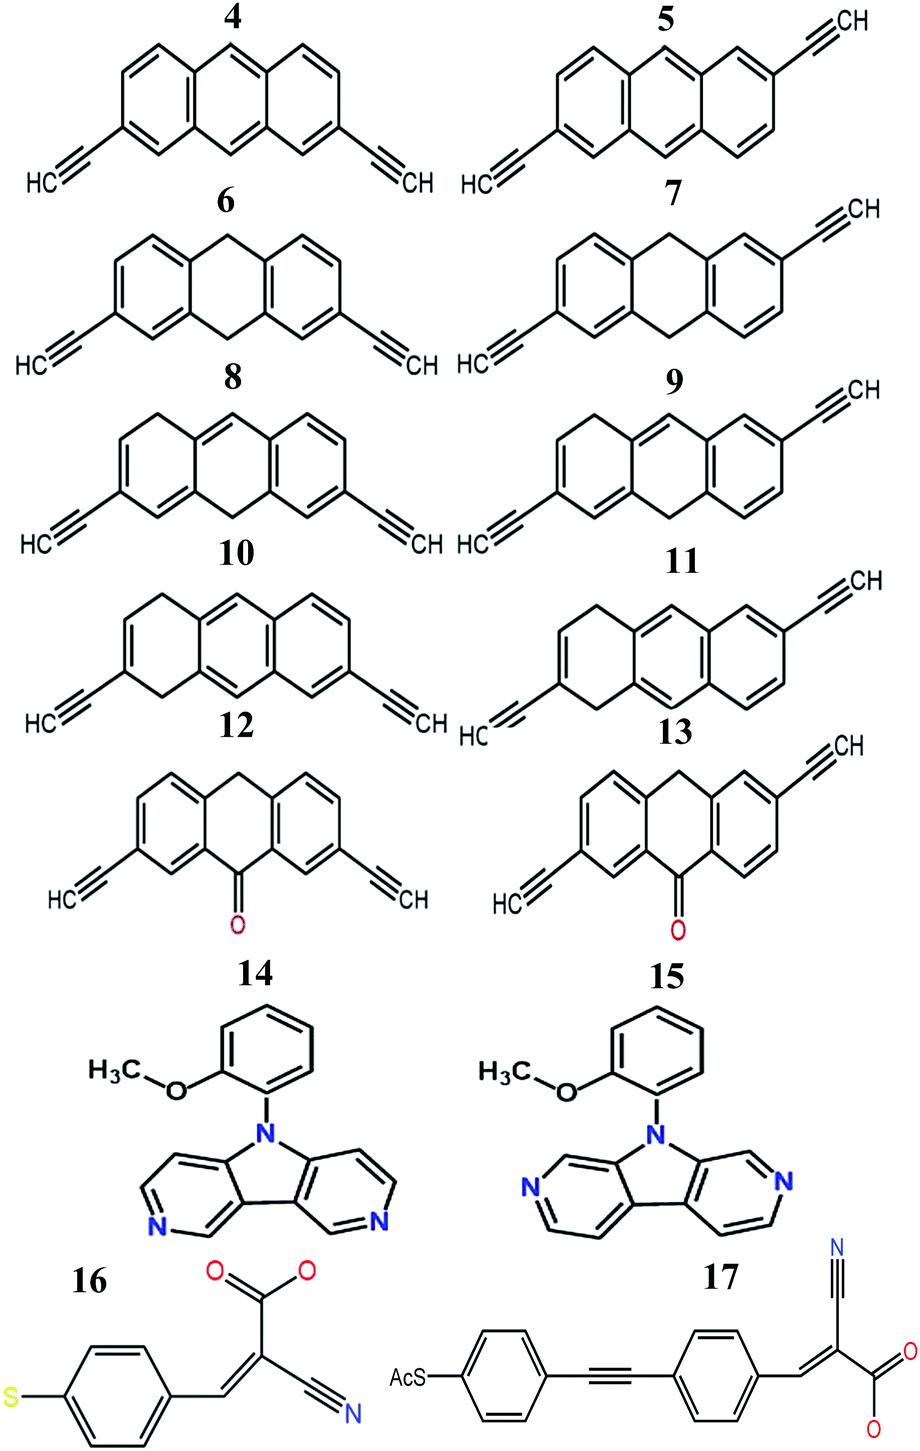 | ||
| Fig. 5 Structures of the molecules 4–17 (see Fig. S4 and S5 for more details and Fig. S26–S43 for their frontier orbitals, ESI†). | ||
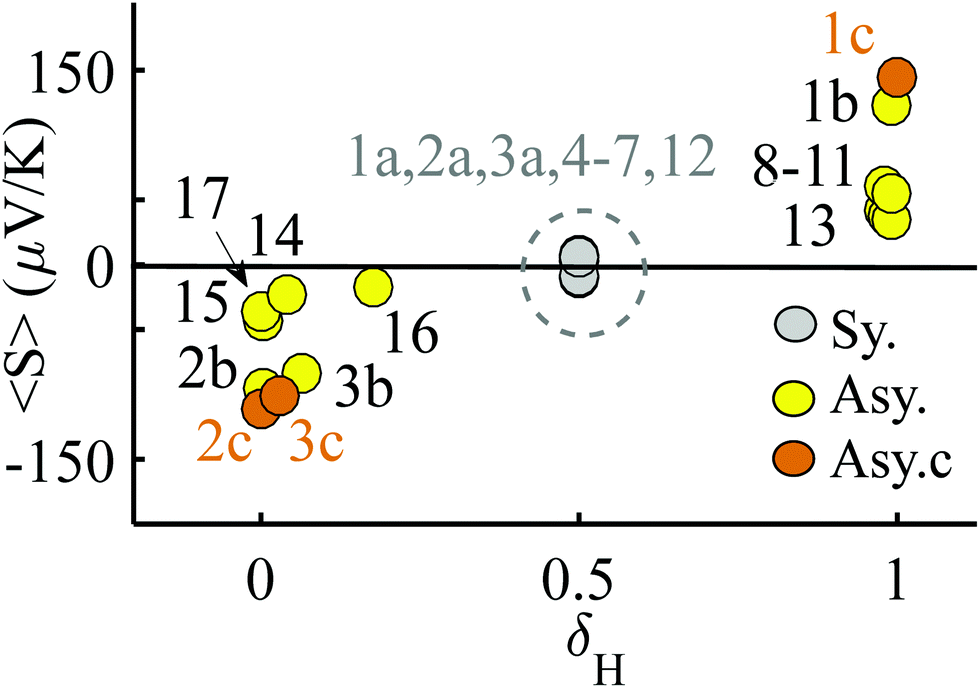 | ||
| Fig. 6 Results for the room temperature values of 〈S〉 versus the parameter δH, which characterises the relative values of the HOMO and LUMO transmission resonances. The points labelled 1a, 2a, 3a indicate the value of 〈S〉 obtained when 1, 2, 3 are placed symmetrically in a junction. The points 1b, 2b, 3b and 1c, 2c, 3c the values of 〈S〉 obtained when 1, 2, 3 are placed asymmetrically in a junction in two slightly different geometries. Table S1 (ESI†) shows the actual values of these average Seebeck coefficients. | ||
Although the asymmetric molecules possess non-zero values of 〈S〉, Fig. 6 reveals that a more advantageous strategy is to use molecules, such as the phthalocyanine 1, the rotaxane 2,40 or the 1,2,3-triazole based molecule 3 (see Fig. 1), which possesses a ‘silent’ frontier orbital. To illustrate this feature, Fig. 6 shows the values of 〈S〉 associated with 1, 2 and 3, in three junction geometries, denoted 1a, 1b and 1c (similarly 2a, 3a, 2b, 3b and 2c, 3c). The points labelled 1a, 2a, 3a show the values of 〈S〉 for the highly improbable symmetric junction corresponding to the grey curves of Fig. 2 and Fig. S6 and S7 (ESI†), whereas the points 1b, 2b, 3b and 1c, 2c, 3c show the values of 〈S〉 obtained in the more-probable slightly asymmetric junctions, with silent orbitals, corresponding to yellow and brown curves of Fig. 2 and Fig. S6 and S7 (ESI†). Clearly, the values of 〈S〉 for the junctions 1c, 2c, 3c, with silent orbitals, are higher in magnitude than those of any of the other molecules.
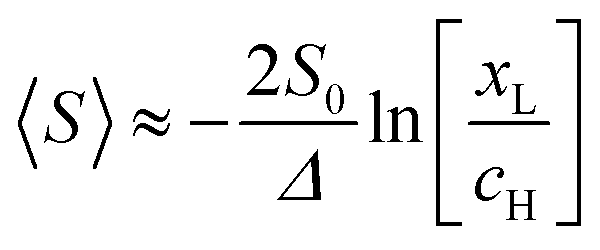
From the WCS theorem and the Breit–Wigner formula, it is clear that the above behaviour is generic. For asymmetric junctions, T(EL) ≠ T(EH) and from eqn (2) 〈S〉 is non-zero. To understand why molecules with a silent frontier orbital, such as 3 are advantageous over spatially-asymmetric molecules, it is interesting to examine the consequences of the WCS theorem (2) and a modified version of (7). At energy Ea, the latter should be modified when xa is small, because then the contribution to T(Ea) from all other orbitals cannot be ignored. (This is clear in the brown curve of Fig. 2, because the feature associated with the silent HOMO sits on a smooth background curve due to contribution from all other orbitals.) Therefore we replace eqn (7) by
| T(Ea) = xa + ca | (9) |
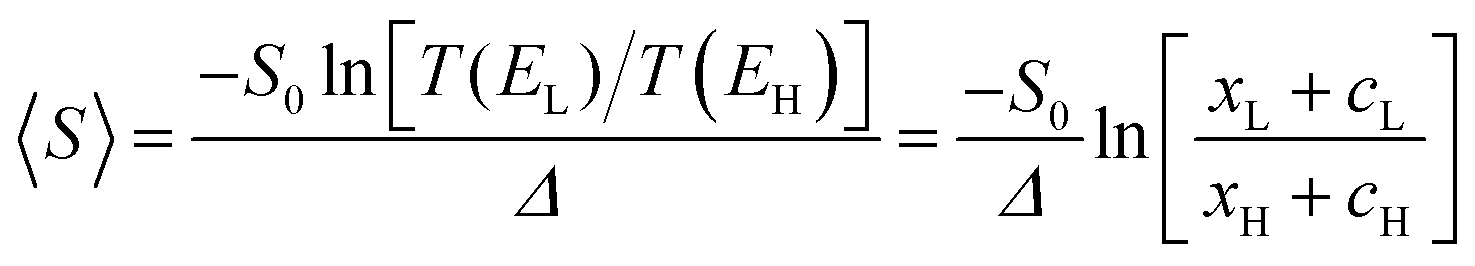 | (10) |
 , where
 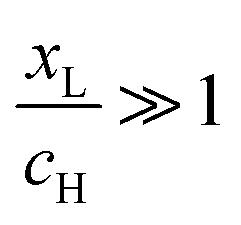 . On the other hand, for asymmetric molecules, both xH and xL are typically much less than unity and therefore
 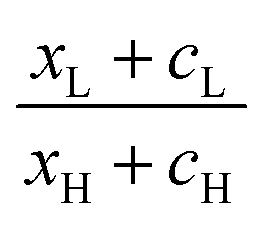 will be closer to unity. This is the reason why the average Seebeck coefficients labelled 1c, 2c and 3c in Fig. 6 are higher than those of all asymmetric molecules considered here.
Of course in a real experiment, a worst-case scenario may not be encountered and EF may have a non-uniform probability distribution peaked at a particular value of EF. However we are not aware of any experimental measurement, which can determine the distribution of EF relative to frontier orbitals. The extreme opposite of a worst-case scenario is to assume a ‘best-case scenario’ in which EF does not fluctuate and has a fixed value. However in practice this is completely unrealistic and does not occur in a real experiment. In the ESI,† (Fig. S44), we explore some examples of distributions, which lie between these extremes. Interestingly, the molecules 1b, 2b, 3b, 1c, 2c, 3c with silent orbitals deliver large Seebeck coefficients, which are relatively insensitive to the changes in the distribution of EF, which again shows that these molecules are advantageous for thermoelectricity under realistic laboratory conditions. In this study, we deliberately chose unbiased distributions, in which the fluctuations of EF are distributed symmetrically about the gap centre. Clearly the thermoelectric performance of these molecules could be improved by biasing the distributions of EF using a judicious choice of anchor group. If the worst-case-scenario value of 〈S〉 is negative, then this could be improved by utilising pyridyl anchors, which bias EF towards the LUMO, whereas if the worst-case-scenario value of 〈S〉 is positive, then this could be improved by utilising thiol anchors, which bias EF towards the HOMO.
So far, we have discussed the average Seebeck coefficients of single-molecule junctions. In Fig. S44 (ESI†), we also show results for the conductance-weighted average 〈SSAM〉 (defined in eqn (S9), ESI†), which as discussed in ref. 34, is the average Seebeck coefficient of a self-assembled monolayer (SAM) of a parallel array of non-interacting molecules. This reveals that molecules with silent frontier orbitals also lead to high values of 〈SSAM〉 and to high values of the power factor 〈SSAM〉2〈G〉.
Conclusion
In this paper, we have discussed how fluctuations in the Fermi energy (relative to frontier orbital energies) can determine the average value of the Seebeck coefficient. In a worst-case scenario, where EF fluctuates uniformly between the HOMO and LUMO energies, a “worst-case scenario theorem” tells us that the average Seebeck coefficient will vanish unless the transmission coefficients T(EL) and T(EH) at LUMO and HOMO resonances in the transmission function take different values. This implies that junction asymmetry can lead to large, non-zero values of 〈S〉 even in the presence of large fluctuations. Remarkably, this does not imply that the molecule itself should be asymmetric. Indeed, we predict that symmetric molecules with a ‘silent’ frontier orbital are advantageous for thermoelectricity and can outperform asymmetric molecules. This conclusion is supported by DFT simulations41 of 17 organic molecules and highlights the presence of silent orbitals and asymmetry as important ingredients in the design of molecules with high thermoelectric performance. It should be noted that asymmetric molecules can lead to current rectification42,43 and to asymmetric thermal and thermoelectric effects.44,45 However as demonstrated by the discussion of molecule 3, molecules with silent orbitals do not need to be asymmetric and therefore need not necessarily lead to rectification. Similarly asymmetries in the phonon contribution to thermal conductivity46,47 can be avoided and therefore the inclusion of silent orbitals in thermoelectric molecular junctions is a separate design principle from those needed for rectification. Finally, although we have confined the discussion to non-redox active molecules, it is of interest to note that silent orbitals are likely to have a stabilising effect on the sign of the Seebeck coefficient, even if they become oxidised or reduced. For example, if a fluctuation causes the silent orbital energy in Fig. 2 to rise above EF, then the molecule would become positively charged and the silent orbital would act like a positive electrostatic gate. This would move the energy levels of all other orbitals to the left (i.e., to lower energies) thereby preserving the bias towards a negative slope of T(EF).Author contributions
C. J. L. conceived the concept of ‘silent orbitals’. A. K. I. selected the molecules and carried out the calculations. Both authors provided essential contributions to interpreting the results and drafting the manuscript.Conflicts of interest
There are no conflicts to declare.Acknowledgements
A. K. I. and C. J. L. acknowledge financial support from the UK EPSRC, through grant no. EP/M014452/1, EP/P027156/1 and EP/N03337X/1. This work was additionally supported by the European Commission is provided by the FET Open project 767187 – QuIET and the EU project Bac-to-Fuel. A. K. I. is grateful for financial assistance from Tikrit University (Iraq), and the Iraqi Ministry of Higher Education (SL-20).References
- M. Schubert, E. Preis, J. C. Blakesley, P. Pingel, U. Scherf and D. Neher, Phys. Rev. B: Condens. Matter Mater. Phys., 2013, 87(2), 024203 CrossRef.
- S. K. Yee, J. A. Malen, A. Majumdar and R. A. Segalman, Nano Lett., 2011, 11(10), 4089–4094 CrossRef CAS PubMed.
- G.-H. Kim, L. Shao, K. Zhang and K. P. Pipe, Nat. Mater., 2013, 12(8), 719–723 CrossRef CAS PubMed.
- O. Bubnova, Z. U. Khan, A. Malti, S. Braun, M. Fahlman, M. Berggren and X. Crispin, Nat. Mater., 2011, 10(6), 429–433 CrossRef CAS PubMed.
- B. Capozzi, E. J. Dell, T. C. Berkelbach, D. R. Reichman, L. Venkataraman and L. M. Campos, J. Am. Chem. Soc., 2014, 136(29), 10486–10492 CrossRef CAS PubMed.
- R. Yamada, H. Kumazawa, T. Noutoshi, S. Tanaka and H. Tada, Nano Lett., 2008, 8(4), 1237–1240 CrossRef CAS PubMed.
- E.-G. Kim and J.-L. Brédas, J. Am. Chem. Soc., 2008, 130(50), 16880–16889 CrossRef CAS PubMed.
- P. Pingel, R. Schwarzl and D. Neher, Appl. Phys. Lett., 2012, 100(14), 87 CrossRef.
- G. Lu, J. Blakesley, S. Himmelberger, P. Pingel, J. Frisch, I. Lieberwirth, I. Salzmann, M. Oehzelt, R. Di Pietro and A. Salleo, Nat. Commun., 2013, 4, 1588 CrossRef PubMed.
- J. Roncali, P. Blanchard and P. Frère, J. Mater. Chem., 2005, 15(16), 1589–1610 RSC.
- R. Gangopadhyay, B. Das and M. R. Molla, RSC Adv., 2014, 4(83), 43912–43920 RSC.
- O. Bubnova, Z. U. Khan, H. Wang, S. Braun, D. R. Evans, M. Fabretto, P. Hojati-Talemi, D. Dagnelund, J.-B. Arlin and Y. H. Geerts, Nat. Mater., 2014, 13(2), 190–194 CrossRef CAS PubMed.
- K. Baheti, J. A. Malen, P. Doak, P. Reddy, S.-Y. Jang, T. D. Tilley, A. Majumdar and R. A. Segalman, Nano Lett., 2008, 8(2), 715–719 CrossRef CAS PubMed.
- J. A. Malen, P. Doak, K. Baheti, T. D. Tilley, R. A. Segalman and A. Majumdar, Nano Lett., 2009, 9(3), 1164–1169 CrossRef CAS PubMed.
- A. Tan, J. Balachandran, S. Sadat, V. Gavini, B. D. Dunietz, S.-Y. Jang and P. Reddy, J. Am. Chem. Soc., 2011, 133(23), 8838–8841 CrossRef CAS PubMed.
- J. Balachandran, P. Reddy, B. D. Dunietz and V. Gavini, J. Phys. Chem. Lett., 2012, 3(15), 1962–1967 CrossRef CAS.
- L. Rincón-García, A. K. Ismael, C. Evangeli, I. Grace, G. Rubio-Bollinger, K. Porfyrakis, N. Agraït and C. J. Lambert, Nat. Mater., 2016, 15(3), 289–293 CrossRef PubMed.
- J. R. Widawsky, W. Chen, H. Vazquez, T. Kim, R. Breslow, M. S. Hybertsen and L. Venkataraman, Nano Lett., 2013, 13(6), 2889–2894 CrossRef CAS PubMed.
- W. B. Chang, C.-K. Mai, M. Kotiuga, J. B. Neaton, G. C. Bazan and R. A. Segalman, Chem. Mater., 2014, 26(24), 7229–7235 CrossRef CAS.
- C. Evangeli, K. Gillemot, E. Leary, M. T. Gonzalez, G. Rubio-Bollinger, C. J. Lambert and N. s. Agraït, Nano Lett., 2013, 13(5), 2141–2145 CrossRef CAS PubMed.
- K. Kim, W. Jeong, W. Lee and P. Reddy, ACS Nano, 2012, 6(5), 4248–4257 CrossRef CAS PubMed.
- A. K. Ismael, I. Grace and C. J. Lambert, Nanoscale, 2015, 7(41), 17338–17342 RSC.
- V. M. García-Suárez, C. J. Lambert, D. Z. Manrique and T. Wandlowski, Nanotechnology, 2014, 25(20), 205402 CrossRef PubMed.
- Q. H. Al-Galiby, H. Sadeghi, L. A. Algharagholy, I. Grace and C. Lambert, Nanoscale, 2016, 8(4), 2428–2433 RSC.
- P. Reddy, S.-Y. Jang, R. A. Segalman and A. Majumdar, Science, 2007, 315(5818), 1568–1571 CrossRef CAS PubMed.
- M. K. Al-Khaykanee, A. K. Ismael, I. Grace and C. J. Lambert, RSC Adv., 2018, 8(44), 24711–24715 RSC.
- J. A. Malen, S. K. Yee, A. Majumdar and R. A. Segalman, Chem. Phys. Lett., 2010, 491(4-6), 109–122 CrossRef CAS.
- J. R. Widawsky, P. Darancet, J. B. Neaton and L. Venkataraman, Nano Lett., 2012, 12(1), 354–358 CrossRef CAS PubMed.
- X. Wang, T. L. Bennett, A. Ismael, L. A. Wilkinson, J. Hamill, A. J. White, I. M. Grace, T. Albrecht, B. J. Robinson and N. J. Long, 2019, arXiv preprint, arXiv:1911.04324.
- M. Famili, I. M. Grace, Q. Al-Galiby, H. Sadeghi and C. J. Lambert, Adv. Funct. Mater., 2018, 28(15), 1703135 CrossRef.
- J. Ferrer, C. J. Lambert, V. M. García-Suárez, D. Z. Manrique, D. Visontai, L. Oroszlany, R. Rodríguez-Ferradás, I. Grace, S. Bailey and K. Gillemot, New J. Phys., 2014, 16(9), 093029 CrossRef.
- C. J. Lambert, H. Sadeghi and Q. H. Al-Galiby, C. R. Phys., 2016, 17(10), 1084–1095 CrossRef CAS.
- A. K. Ismael, K. Wang, A. Vezzoli, M. K. Al-Khaykanee, H. E. Gallagher, I. M. Grace, C. J. Lambert, B. Xu, R. J. Nichols and S. J. Higgins, Angew. Chem., Int. Ed., 2017, 56(48), 15378–15382 CrossRef CAS PubMed.
- I. L. Herrer, A. K. Ismael, D. C. Milán, A. Vezzoli, S. Martín, A. González-Orive, I. Grace, C. Lambert, J. L. Serrano and R. J. Nichols, J. Phys. Chem. Lett., 2018, 9(18), 5364–5372 CrossRef CAS PubMed.
- S. Hou, Q. Wu, H. Sadeghi and C. J. Lambert, Nanoscale, 2019, 11(8), 3567–3573 RSC.
- G. Yzambart, L. Rincón-García, A. A. Al-Jobory, A. K. Ismael, G. Rubio-Bollinger, C. J. Lambert, N. Agraït and M. R. Bryce, J. Phys. Chem. C, 2018, 122(48), 27198–27204 CrossRef CAS PubMed.
- X. Liu, S. Sangtarash, D. Reber, D. Zhang, H. Sadeghi, J. Shi, Z. Y. Xiao, W. Hong, C. J. Lambert and S. X. Liu, Angew. Chem., Int. Ed., 2017, 56(1), 173–176 CrossRef CAS PubMed.
- S. Sangtarash, H. Sadeghi and C. J. Lambert, Phys. Chem. Chem. Phys., 2018, 20(14), 9630–9637 RSC.
- N. Claughton, M. Leadbeater and C. Lambert, J. Phys.: Condens. Matter, 1995, 7(46), 8757 CrossRef CAS.
- D. C. Milan, M. Krempe, A. K. Ismael, L. D. Movsisyan, M. Franz, I. Grace, R. J. Brooke, W. Schwarzacher, S. J. Higgins and H. L. Anderson, Nanoscale, 2017, 9(1), 355–361 RSC.
- J. M. Soler, E. Artacho, J. D. Gale, A. García, J. Junquera, P. Ordejón and D. Sánchez-Portal, J. Phys.: Condens. Matter, 2002, 14(11), 2745 CrossRef CAS.
- A. Nitzan, Annu. Rev. Phys. Chem., 2001, 52(1), 681–750 CrossRef CAS PubMed.
- A. Aviram and M. A. Ratner, Chem. Phys. Lett., 1974, 29(2), 277–283 CrossRef CAS.
- J. Ren, P. Hänggi and B. Li, Phys. Rev. Lett., 2010, 104(17), 170601 CrossRef PubMed.
- G. T. Craven, D. He and A. Nitzan, Phys. Rev. Lett., 2018, 121(24), 247704 CrossRef CAS PubMed.
- B. Li, L. Wang and G. Casati, Phys. Rev. Lett., 2004, 93, 184301 CrossRef PubMed , (cond-mat/0407093).
- N. Li, J. Ren, L. Wang, G. Zhang, P. Hänggi and B. Li, Rev. Mod. Phys., 2012, 84(3), 1045 CrossRef.
Footnote |
| † Electronic supplementary information (ESI) available. See DOI: 10.1039/d0nh00164c |
| This journal is © The Royal Society of Chemistry 2020 |