
Carbon dot-assisted luminescence of singlet oxygen: the generation dynamics but not the cumulative amount of singlet oxygen is responsible for the photodynamic therapy efficacy†
Xu
Teng
a,
Feng
Li
 a,
Chao
Lu
*a and
Buhong
Li
b
a,
Chao
Lu
*a and
Buhong
Li
b
aState Key Laboratory of Chemical Resource Engineering, Beijing Advanced Innovation Center for Soft Matter Science and Engineering, Beijing University of Chemical Technology, Beijing 100029, China. E-mail: luchao@mail.buct.edu.cn
bMOE Key Laboratory of OptoElectronic Science and Technology for Medicine, Fujian Provincial Key Laboratory for Photonics Technology, Fujian Normal University, Fuzhou, Fujian 350007, China
First published on 3rd April 2020
Abstract
A novel carbon dot-based luminescence probe for singlet oxygen (1O2) with a conventional optical detector has been implemented through the specific formation of electronically excited carbonyls from the breakdown of unstable endoperoxide intermediates, and its application in the real-time in vivo monitoring of 1O2 in photodynamic therapy (PDT) is achieved. More attractively, the relationship between the dynamics details of photosensitizer-generated 1O2 and the PDT efficacy has been established through a modified multiple-target survival model, enabling a direct and easy estimate of the surviving fraction of tumor cells from the generation dynamics of 1O2. Both in vitro and in vivo therapy results revealed that the rapid generation dynamics of 1O2 rather than its cumulative amount is responsible for better treatment efficacy in PDT. Overall, the deeper insight into the important roles of the generation dynamics of 1O2 in the PDT efficacy is irreplaceably advantageous in substantially reduced risks from deleterious treatment-related side effects by screening advanced photosensitizers and determining the light exposure end point.
New conceptsThe real-time monitoring of singlet oxygen (1O2) generation in photodynamic therapy (PDT) represents a promising direction in the administration of a prescribed quantity of photosensitizer and light. However, the design of a specific probe for the real-time in vivo monitoring of 1O2 generation still remains a critical and unsolved challenge as it is ensured that the probe is easily-prepared, stable, biocompatible, water-soluble, and cell-permeable. In this contribution, we report a novel luminescence light-up nanoprobe for the real-time in vivo monitoring of 1O2 generation using imidazole-functionalized carbon dots. This work has provided solid evidence that the generation dynamics of 1O2 rather than its cumulative amount is a promising evaluation standard for the PDT efficacy. We believe that our success will be irreplaceably advantageous in substantially reduced risks from deleterious treatment-related side effects by screening advanced photosensitizers. This work also motivates scientists to take the role of functionalized carbon dots into account in the evaluation of 1O2 generation-related life processes. |
Introduction
Photodynamic therapy (PDT) has received great attention in both fundamental research and cancer treatment over the past decades thanks to its high spatiotemporal selectivity and minimal invasiveness.1–4 Upon light irradiation, photosensitizers employ tissue oxygen to generate highly cytotoxic singlet oxygen (1O2), which subsequently kills diseased cells through apoptosis or necrosis.5–7 A standard clinical PDT protocol does not only rely on sufficient production of 1O2, but also on the administration of a prescribed quantity of photosensitizer and light.8 However, highly active photosensitizers and high-power light in photodynamic action can damage healthy cells and compromise therapeutic efficacy.9 Therefore, how to monitor the photosensitizer working in the body and how to evaluate the exact treatment end point are important. The real-time in vivo monitoring of 1O2 generation represents a promising direction in screening advanced photosensitizers and determining the light exposure end point in order to reduce the risks from deleterious treatment-related side effects. To address this problem, it is generally recognized that chemiluminescence (CL) probes are an ideal candidate for the real-time in vivo monitoring of 1O2 generation.10 However, to the best of our knowledge, a highly efficient CL probe of 1O2 meeting these requirements still remains an unsolved challenge.A direct approach is to measure 1O2 generation in vivo by detecting the near-IR luminescence of 1O2 at a wavelength of 1270 nm owing to its inherent disadvantages (e.g., insufficient sensitivity and unconventional detector).11 To overcome these hurdles, some strategies have been developed for the real-time monitoring of 1O2 generation. Almost all of the CL probes for 1O2 measurement are based on the strong enophile nature of 1O2 toward [2+2] or [2+4] cycloaddition reactions with double-bond structures.10,12–14 However, the quenching of luminescence emission in water limits their practical applications in vivo. In addition, the current established CL probe-based fluoresceinyl cypridina luciferin analog (FCLA)12 strategies suffer from cross-interference caused by other reactive oxygen species in biological systems, and their solutions are thermally unstable and must be stored at −80 °C. Excitingly, Shabat and co-workers recently pioneered a highly selective and sensitive CL probe for the detection of 1O2 through the formation of a new dioxetane luminophore.10 Unfortunately, such a developed CL probe could not be used for the detection of intracellular 1O2 before it was functionalized with a cell-penetrating peptide by a three-step synthesis. Accordingly, the complicated and time-consuming synthetic processes and high instability made it impractical and inconvenient for the real-time in vivo monitoring of 1O2. Furthermore, we have previously developed a CL method to monitor 1O2 generation using the tetraphenylethene-sodium dodecyl sulfonate surfactant with aggregation-induced emission characteristics.14 Disappointingly, in vitro and in vivo use of this probe in the detection of 1O2 faced an insurmountable obstacle because of its localization onto the cell membrane through hydrophobic interactions. Taking into account these facts, it is clearly understood that the design of a specific probe for the real-time in vivo monitoring of 1O2 generation is technically challenging as it has to be ensured that the probe is easily-prepared, stable, biocompatible, water-soluble, and cell-permeable.
Carbon dots (CDs) have been utilized as versatile scaffolds for sensing subcellular biomolecules due to their water solubility, high biocompatibility, excellent cell-permeability and good photostability.15–17 It is generally recognized that the imidazole ring can specifically react with 1O2 to form an excited intermediate, which further emits strong luminescence when it is incorporated into conjugated structures.18,19 In this contribution, we designed and synthesized a kind of imidazole-functionalized CDs (Im-CDs) by a one-step hydrothermal carbonization method using histidine as the sole precursor. Interestingly, the CL of the Im-CDs could be selectively triggered by 1O2 through the formation of electronically excited carbonyls from the breakdown of unstable endoperoxide intermediates (Fig. 1). The relationship between the generation dynamics of 1O2 and the PDT efficacy in vitro and in vivo was explored. It was found that the surviving fraction datum as a function of the generation dynamics of 1O2 were fitted much better with a single hit multiple target cell survival model (reduced χ2 = 3.22), which can be used for a direct estimate of the surviving fraction of tumor cells from the generation dynamics of 1O2. The results revealed that the generation dynamics of 1O2 but not its cumulative amount plays a vital role in the PDT efficacy.
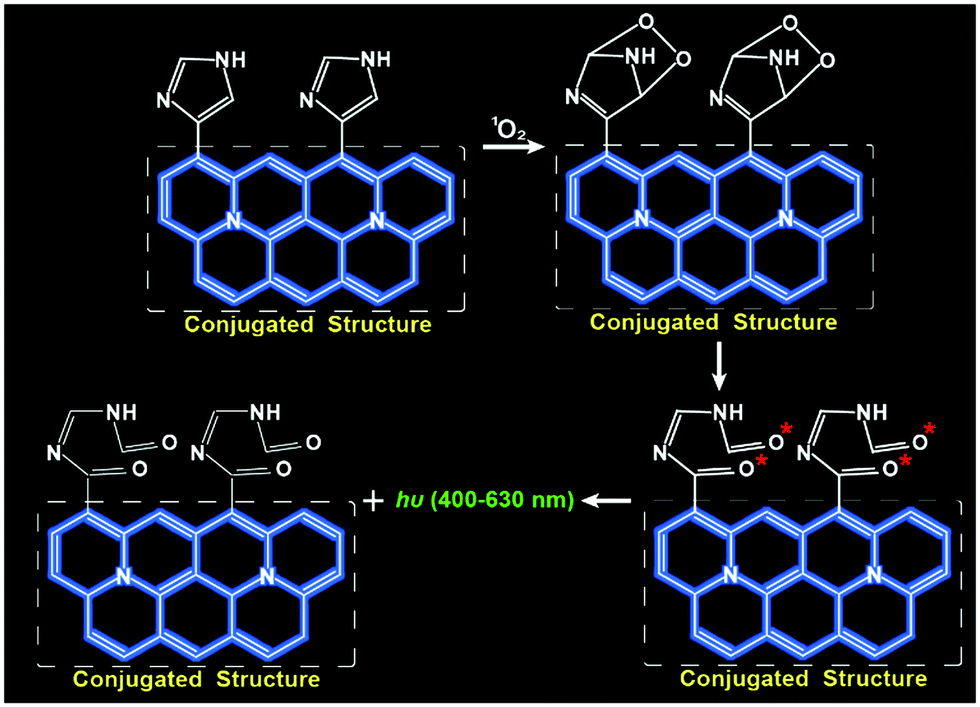 | ||
| Fig. 1 Possible mechanism of the Im-CD-based luminescence probe for real-time monitoring of 1O2. | ||
Results and discussion
The as-prepared Im-CDs exhibited excellent optical characteristics and good water-solubility (Fig. S1–S3 and Table S1, ESI†). Strong emission of the Im-CDs was observed at 402 nm under near ultraviolet 331 nm excitation (Fig. 2A). In the FT-IR spectra of the Im-CDs (Fig. 2B), the peaks in the range of 1400–1520 cm−1 were assigned to the vibration of the imidazole backbone, and the peaks at 2855 cm−1 and 2960 cm−1 were attributed to the vibration of the alkyl side chain of the imidazole ring.20 The FT-IR spectra confirmed the existence of imidazole groups on the surface of the Im-CDs. Moreover, the main contribution of the pyrrolic nitrogen (400.1 eV) in the XPS N 1s spectrum also revealed that the imidazole groups were embedded in the Im-CDs (Fig. 2C).21,22 The Raman spectrum and XRD pattern of the Im-CDs further identified the presence of graphitic carbon, indicating the conjugated structures in the Im-CDs (Fig. 2D and Fig. S4, ESI†).23 In conclusions, Im-CDs with conjugated structures were successfully synthesized.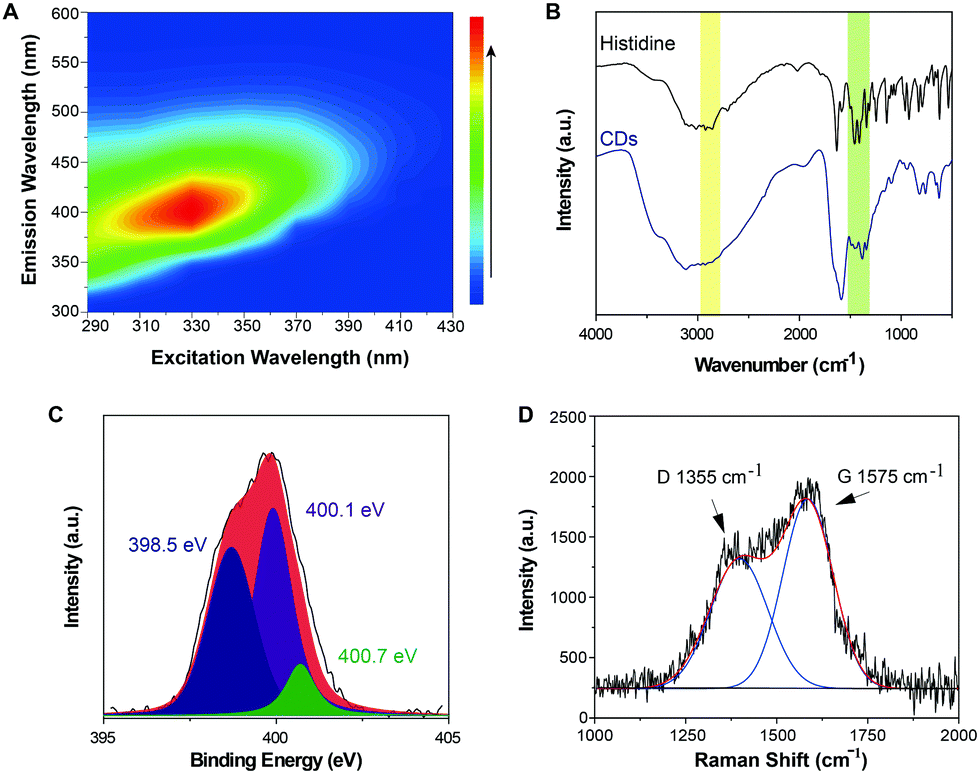 | ||
| Fig. 2 (A) Excitation–emission matrices of the Im-CDs. (B) FT-IR spectra of histidine and the Im-CDs, respectively. (C) XPS N 1s spectrum of the Im-CDs. (D) Raman spectrum of the Im-CDs. | ||
The 1O2-triggered CL emission of the Im-CDs was investigated in a static injection CL setup (Fig. S5, ESI†). The results showed that strong CL emission of the Im-CDs was observed in the presence of 1O2 from the H2O2–IO4− system24 in 50 mM phosphate buffer solution (PBS, pH 7.4) (Fig. S6, ESI†). The strong and fast CL emission is shown in the inset of Fig. S6 (ESI†). Moreover, the addition of 50 mM PBS (pH 7.4) had no influence on the CL emission of the Im-CD-1O2 system (Fig. S7, ESI†). In comparison, very weak emission was detected in the reaction of 1O2 with histidine, indicating that the conjugated structures of the CDs contributed to a significant enhancement of the CL emission. Moreover, serine-CDs were synthesized by using serine as the raw material. The excitation-dependent photoluminescence behavior of the serine-CDs is shown in Fig. S8 (ESI†). The reason for the behavior was that the different kinds of functional groups (e.g., C–OH, C–O, C–O–C, and C–H) on the surface of the CDs could lead to various energy levels and a series of emissive traps.25 It was found that weak emission was aroused by the reaction between 1O2 and serine-CDs in the absence of imidazole groups in the control measurements. The results implied that the CL differences were attributed to the presence of the imidazole groups. Therefore, the imidazole groups in the conjugated structures of the CDs played a key role in the strong CL emission. As shown in Fig. S9 (ESI†), the emission of the Im-CD-1O2 CL system remained unchanged when the concentration of Im-CDs was higher than 0.5 mg mL−1. 0.5 mg mL−1 Im-CDs were utilized in the following measurements, and the optimum synthesis temperature was 240 °C (Fig. S10, ESI†). The as-prepared Im-CDs at both lower and higher synthesis temperature could induce a decrease in the CL intensity. The reason for this phenomenon was that a higher synthesis temperature could lead to a higher carbonization degree and a lower amount of functional groups on the surface of the CDs; on the contrary, a lower synthesis temperature could result in a lower carbonization degree and fewer conjugate structures of the CDs.26 Furthermore, the CL emission of the Im-CDs upon the reaction with 1O2 lay in the band 400 to 630 nm (Fig. 3A, inset), suggesting that the emitting species was the electronically excited carbonyls from the [2+4] cycloaddition reaction between 1O2 and imidazole groups in the CDs.19,20 On the other hand, the formation of carbonyl groups in the Im-CDs was further confirmed by the XPS C 1s spectrum. The XPS C 1s spectra for the pristine CDs and 1O2-treated CDs are shown in Fig. S11 (ESI†). Remarkably, the increased content of C![[double bond, length as m-dash]](https://www.rsc.org/images/entities/char_e001.gif) O (Table S2, ESI†) indicated the formation of carbonyl groups on the surface of the CDs.22 Meanwhile, the decreased content of CC suggested that the double-bond structures of the Im-CDs were broken when they were attacked by 1O2. As expected, such carbonyl groups in the CDs were generated in the presence of 1O2, and the CL emission of the Im-CDs was aroused (Fig. 1). Therefore, we concluded that the strong CL emission was from the electronically excited carbonyls on the surface of the Im-CDs.
O (Table S2, ESI†) indicated the formation of carbonyl groups on the surface of the CDs.22 Meanwhile, the decreased content of CC suggested that the double-bond structures of the Im-CDs were broken when they were attacked by 1O2. As expected, such carbonyl groups in the CDs were generated in the presence of 1O2, and the CL emission of the Im-CDs was aroused (Fig. 1). Therefore, we concluded that the strong CL emission was from the electronically excited carbonyls on the surface of the Im-CDs.
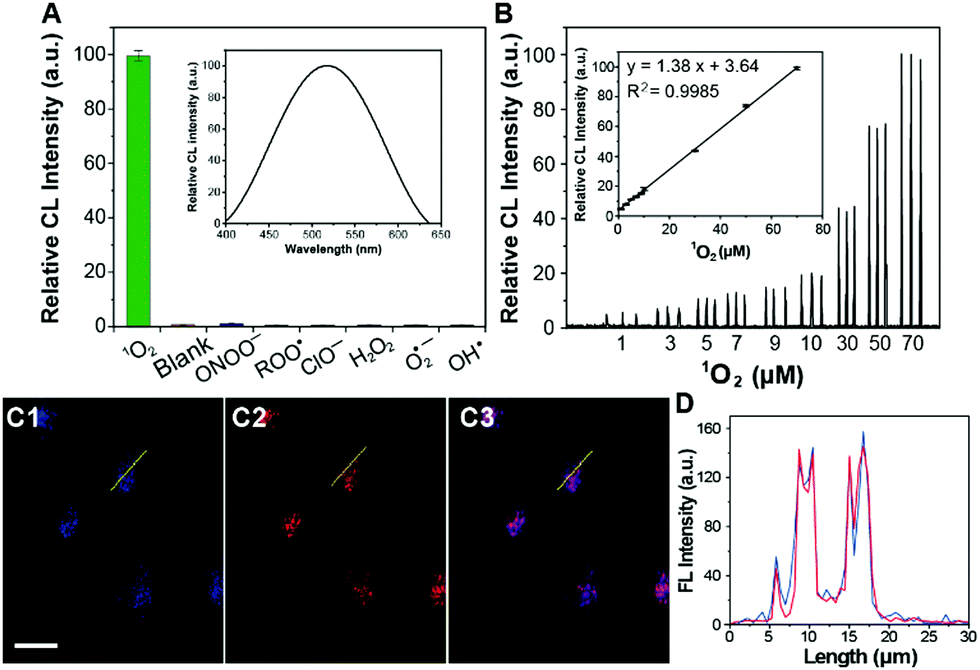 | ||
| Fig. 3 (A) CL intensity of the Im-CDs in the presence of different ROS. (B) CL responses of cells loaded with the Im-CDs towards various concentrations of 1O2 from the IO4−-H2O2 system. Inset: Calibration curve for 1O2. Error bars were defined as the standard deviation, n = 5. (C) Colocalization images of HeLa cells stained with the Im-CDs (C1, blue channel) and Lyso-Tracker Red (C2, red channel), and the overlay of the Im-CDs and Lyso-Tracker Red (C3). (D) Intensity profiles within the ROI (yellow line) of the Im-CDs and Lyso-Tracker Red across HeLa cells. Scale bars = 20 μm. The concentrations of 1O2 and other ROS were 10.0 μM and 100.0 μM, respectively. | ||
The selectivity of the Im-CDs towards reactive oxygen species (ROS), including 1O2, H2O2, t-butylhydroperoxide (TBHP), ONOO−, ClO−, ˙OH, O2˙− and ROO˙, was investigated in PBS at pH 7.4. As shown in Fig. 3A, strong CL emission was produced in the presence of 10 μM 1O2, whereas no noticeable CL emission was observed when the imidazole-functionalized CD solution was mixed with other ROS. These observations revealed that the Im-CDs exhibited a high specificity towards 1O2. Moreover, an obvious decrease of the CL emission of the proposed system appeared in the presence of NaN3 (a scavenger for 1O2) and ascorbic acid (a scavenger for ROS).27 Thiourea (a scavenger for ˙OH) and nitro blue tetrazolium chloride (a scavenger for O2˙−) had little effects on the CL emission (Fig. S12, ESI†). Note that Fe2+-catalyzed decomposition of TBHP could also act as a potential source of 1O2 in biological systems.12 It was found that the Im-CDs could also enhance the CL intensity from the Fe2+-catalyzed decomposition of the TBHP system (Fig. S13 and S14, ESI†). These results further indicated that we could design a specific CL probe for 1O2 by using the imidazole groups in the conjugated structures of the CDs as a specific recognition element towards 1O2.
In view of the poor water-solubility of the reported organic probes for 1O2,11 the as-prepared Im-CDs in this work exhibited good water-solubility, facile synthesis and high luminescence efficiency. These advantages made the Im-CDs an ideal probe for 1O2 measurement in vivo (Fig. S15–S17, ESI†). Note that hemolysis is an important concern for nanomaterials.28,29 Therefore, a hemolysis assay was performed to investigate the interaction between the Im-CDs and blood components. The negligible changes in hemolysis percentage in the test concentration range (Fig. S18, ESI†) indicated the extremely low hemolytic property of the Im-CDs. It was concluded that the Im-CDs were considered low toxic to live cells. Finally, the effects of some typical intracellular interferents in biological samples were investigated on the CL intensity of the Im-CDs in the presence of 1O2, including three proteases, and some important reductants, cationic ions and anionic ions. As shown in Fig. S19 and Table S3 (ESI†), these substances had no influence on the detection of 10.0 μM 1O2. In conclusion, the Im-CDs could be used for the detection of 1O2 in biological environments.
The IO4−–H2O2 system was used to produce exogenous 1O2 in HeLa cells.23 Before incubation with various concentrations of H2O2, the cells were treated with 0.5 mg mL−1 Im-CDs for 4 h.30 Then, the CL intensities were recorded when 100.0 μM IO4− solution was injected into the above-mentioned cells. The CL intensities were found to be linear with concentrations of 1O2 in the range of 1.0–70.0 μM (R2 = 0.9985) in HeLa cells (Fig. 3B). The final concentration of 1O2 was determined by H2O2,14 and the detection limit was 87.0 nM (S/N = 3). The relative standard deviation for three independent measurements of 1.0 μM 1O2 was 2.7%. The CL intensities decreased with the addition of NaN3 (1.0 mM) into the present system (Fig. S20, ESI†). Moreover, the proposed CL probe was successfully used to monitor the generation dynamics of 1O2 in HeLa cells throughout the phorbol 12-myristate 13-acetate (PMA) stimulation period (Fig. S21, ESI†).31 These results demonstrated that the Im-CDs could be used for the monitoring of 1O2 generation in real biological systems.
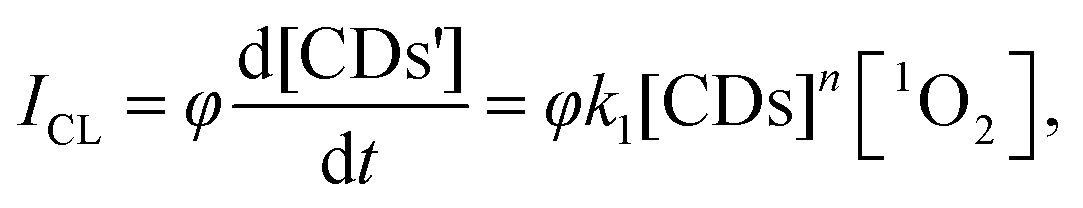
1O2 is the major cytotoxic agent in type-II PDT (Fig. S22, ESI†).32 The chemical reaction pathways for the detection of 1O2 generation are exhibited in Fig. 1. Inspired by the real-time detection property of the CL detector,33,34 the relationship of the CL intensity (ICL) and 1O2 concentration could be expressed as
 | (1) |
The interval for CL measurement was set at 1.0 s per spectrum, and then the generation dynamics of 1O2 could be obtained directly from the CL intensity curve. Based on the calibration curve for the 1O2 generation in HeLa cells (Fig. 3B), the generation dynamics of 1O2 (r[1O2]) at moment t during PDT could be expressed as
 | (2) |
 | (3) |
Afterwards, the average generation dynamics of 1O2 (R[1O2]) over a time T was
 | (4) |
Firstly, Fig. 3C and D showed that the Im-CDs were localized in lysosomes. Thus, we investigated the influence of the generation dynamics of 1O2 on the PDT efficacy in HeLa cells with three lysosomal-targeted type-II photosensitizers: methylene blue (MB), hypocrellin B (HB) and hypericin (HY).35–37 The ICL–t curves of the three photosensitizers are shown in Fig. S24 (ESI†), and the r[1O2]–t curves (Fig. 4A) were then obtained using the data in the ICL–t curves and eqn (2). In order to investigate the relationship between the generation dynamics of 1O2 and the PDT efficacy in HeLa cells, the cumulative amount of 1O2 was controlled for various fluences with different treatment times. The integral area under the generation dynamics curve (Fig. 4A) from 0.0 to 25.0 min was taken as the cumulative amount of 1O2 (Fig. S25, ESI†). For the same cumulative amount of 1O2, the treatment time for HB, MB and HY was 4.5, 6.9 and 25.0 min, respectively. Therefore, the generation dynamics of 1O2 in HeLa cells was increased in the following order: HY < MB < HB during the treatment time. In addition, the PDT efficacy was evaluated by CCK-8 assays. After irradiation, HeLa cells were incubated at 37 °C for 24 h. As shown in Fig. 4B, the cell viability decreased in the following order: HB > MB > HY. Furthermore, the HeLa cells treated by PDT mediated by the three photosensitizers exhibited different degrees of apoptosis and necrosis. The proportions of HeLa cell death from apoptosis were 24.39% for HY, 57.49% for MB and 53.99% for HB, and the proportions of HeLa cell death from necrosis were 1.78% for HY, 1.50% for MB and 16.97% for HB, respectively (Fig. 4C). These results implied that the HB photosensitizer with the rapid generation dynamics of 1O2 could lead to an increased PDT efficacy, which exhibited serious cytotoxic damage and made the cancer cells undergo a rapid death (such as necrosis). In comparison, for the same cumulative amount of 1O2, the MB and HY photosensitizers with the slow generation dynamics of 1O2 could trigger a programmed cell death type response (Fig. 4D). As shown in Fig. S26–S28 (ESI†), the findings were also supported by the data from two other type-II clinical photosensitizers: chlorin e6 (Ce6) and meta-tetra(hydroxyphenyl)chlorin (mTHPC). The peaks in the generation dynamics curves may be due to photobleaching of the photosensitizers. mTHPC was used as the model photosensitizer. Afterwards, the photobleaching analysis of mTHPC was performed under the same conditions. The trend of the bleaching rate (Fig. S29, ESI†) was consistent with that in the generation dynamics curve (Fig. S27A, ESI†), indicating that the use of the Im-CDs to monitor the generation dynamics of 1O2 is valid.38 On the other hand, the presence of the HY, MB, HB, Ce6 and mTHPC photosensitizers had little influence on the detection of 1O2 (Fig. S30 and S31, ESI†). The emission of the proposed CL probe could not excite these photosensitizers to produce 1O2. These results implied the reliability of the Im-CDs for the real-time monitoring of 1O2 in PDT with these photosensitizers.
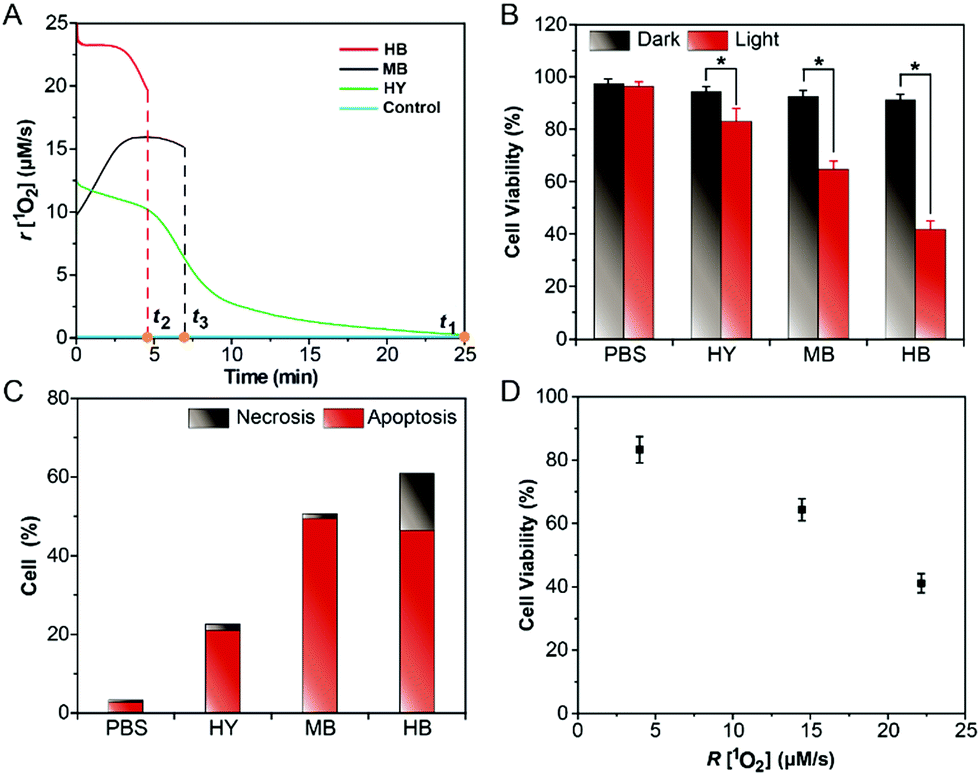 | ||
| Fig. 4 (A) The generation dynamics of 1O2 from the photosensitized reaction with HB, MB, and HY in HeLa cells during PDT. (B) Relative viabilities of HeLa cells after incubation with PBS, HY, MB and HB with or without 600 nm irradiation (60 mW cm−2). (C) Proportions of HeLa cell death from apoptosis and necrosis after incubation with PBS, HY, MB and HB with 600 nm irradiation (60 mW cm−2). (D) Relative viabilities of HeLa cells as a function of the average generation dynamics of 1O2 from the photosensitized reaction with HY, MB and HB in HeLa cells under the same cumulative amount of 1O2 generation. Error bars were defined as the standard deviation, n = 9. After irradiation, HeLa cells were incubated at 37 °C for 24 h. Control meant the photosensitized reaction without photosensitizer. | ||
The generation dynamics of 1O2 in a tumor model was investigated to further explore the relationship between the generation dynamics of 1O2 and the PDT efficacy in vivo. Fig. 5A shows the generation dynamics of 1O2 from the photosensitized reaction with HB, MB, and HY. Since the generation dynamics of 1O2 in mouse tumors was proportional to the CL intensities based on eqn (1) and (2), the generation dynamics of 1O2 in mouse tumors was increased according to the following order: MB < HB < HY. The integral area under the ICL–t curve (Fig. 5A) was taken as the cumulative CL intensity. The cumulative CL intensity was proportional to the cumulative amount of 1O2. Fig. 5B shows the cumulative CL intensity as a function of treatment time. The treatment time (t1) for MB with slow generation dynamics of 1O2 was 20.0 min. For the same cumulative CL intensity, the treatment time (t2 and t3) for HY and HB was 5.5 and 9.5 min, respectively.
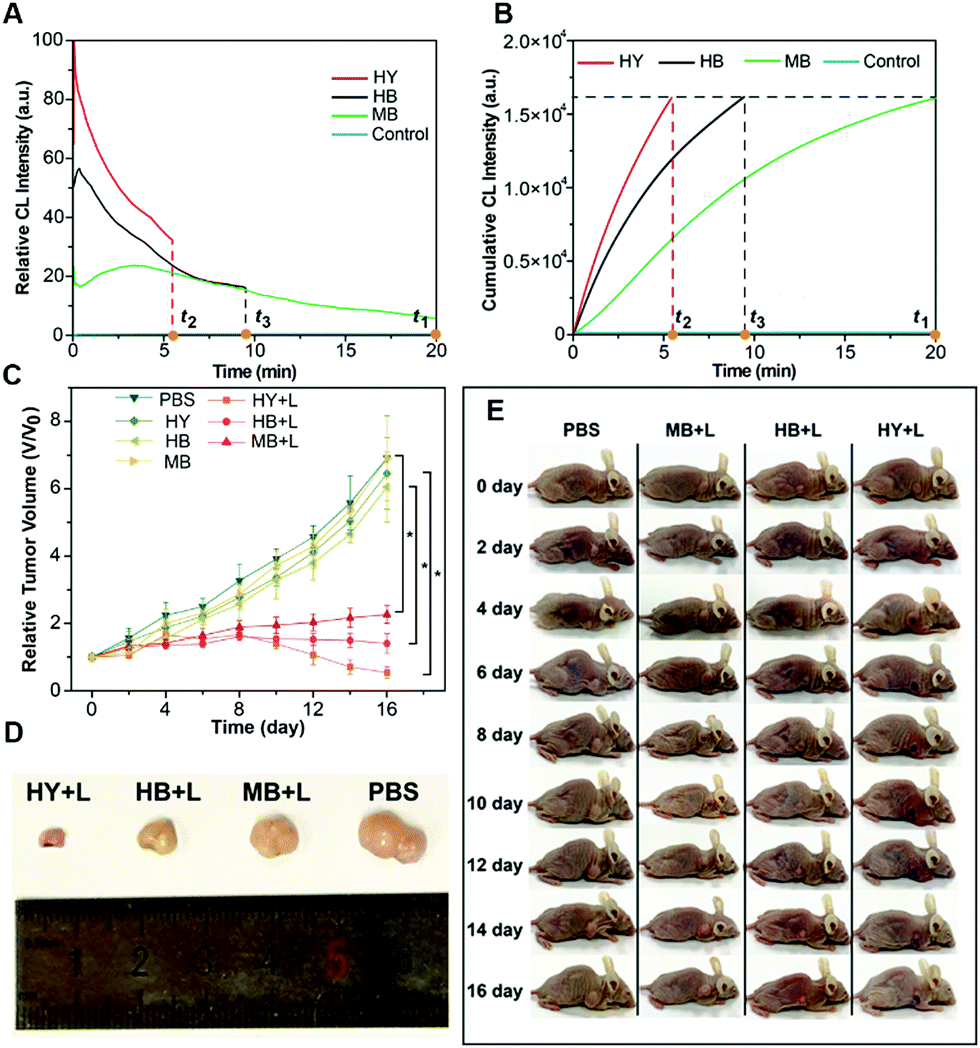 | ||
| Fig. 5 (A) The generation dynamics of 1O2 from the photosensitized reaction with HB, MB, and HY in tumors during PDT. The maximum CL intensity was normalized to 100. (B) Cumulative CL intensity of 1O2 from the photosensitized reaction with HB, MB, and HY in tumors during PDT processes. Control in A and B meant the photosensitized reaction without photosensitizer. (C) Tumor growth curves of mice with the various treatments. Tumor sizes were normalized to their initial sizes. Error bars were defined as the standard deviation, n = 5 mice with three repeats. (D) Corresponding images of tumors taken on day 16 of treatment. (E) Representative photographs of mice with the various treatments. | ||
Tumor sizes after PDT are recorded in Fig. 5C. The tumor growth was significantly inhibited for HY, HB and MB mediated PDT. In comparison with the control group (i.e., the mice injected with PBS), the mice injected with HY, HB and MB, respectively, showed a much smaller tumor size after 16 days of treatment (Fig. 5D and E). On the other hand, the relative tumor volume was increased in the following order: HY < HB < MB. Additionally, hematoxylin and eosin (H&E) stains of tumor slices from different groups are shown in Fig. S32 (ESI†). The degree of tissue necrosis was increased in the following order: MB < HB < HY. Interestingly, these variation tendencies were in accordance with that obtained from the generation dynamics of 1O2 in tumors: HY with the more rapid generation dynamics of 1O2 in tumors could lead to a significantly smaller tumor volume and severe tissue necrosis, in comparison to HB and MB with the slower generation dynamics of 1O2. At the same time, no obvious changes in the body weight of the mice were observed in the study period for all groups (Fig. S33, ESI†), implying that the employed Im-CDs and photosensitizers (i.e., HY, HB and MB) displayed no acute toxicity. Subsequently, the relationship between the generation dynamics of 1O2 and the PDT efficacy in vivo was also tested by monitoring the photosensitized reaction with two clinical photosensitizers (i.e. Ce6 and mTHPC) using a low-pass interference filter at 630 nm (Fig. 6 and Fig. S34, ESI†). As shown in Fig. 6D and E, the relative tumor volume of the mice in the treatment with mTHPC, Ce6 and PBS, respectively, was increased in the following order: mTHPC < Ce6 < PBS. The results from Ce6 and mTHPC were consistent with those from the other three photosensitizers, further confirming that the generation dynamics of 1O2in vivo played a vital role in the increased PDT efficacy. On the other hand, H&E stains (Fig. S35, ESI†) showed no obvious damage of major organs (i.e., the heart, liver, spleen, lung, and kidneys), indicating a satisfactory safety profile of the Im-CDs in vivo. Meanwhile, the complete blood count and serum biochemistry indicated that the Im-CDs exhibited no appreciable toxicity to mice at our tested dose within 16 days, and were safe for the real-time in vivo monitoring of 1O2 (Fig. S36 and S37, ESI†).
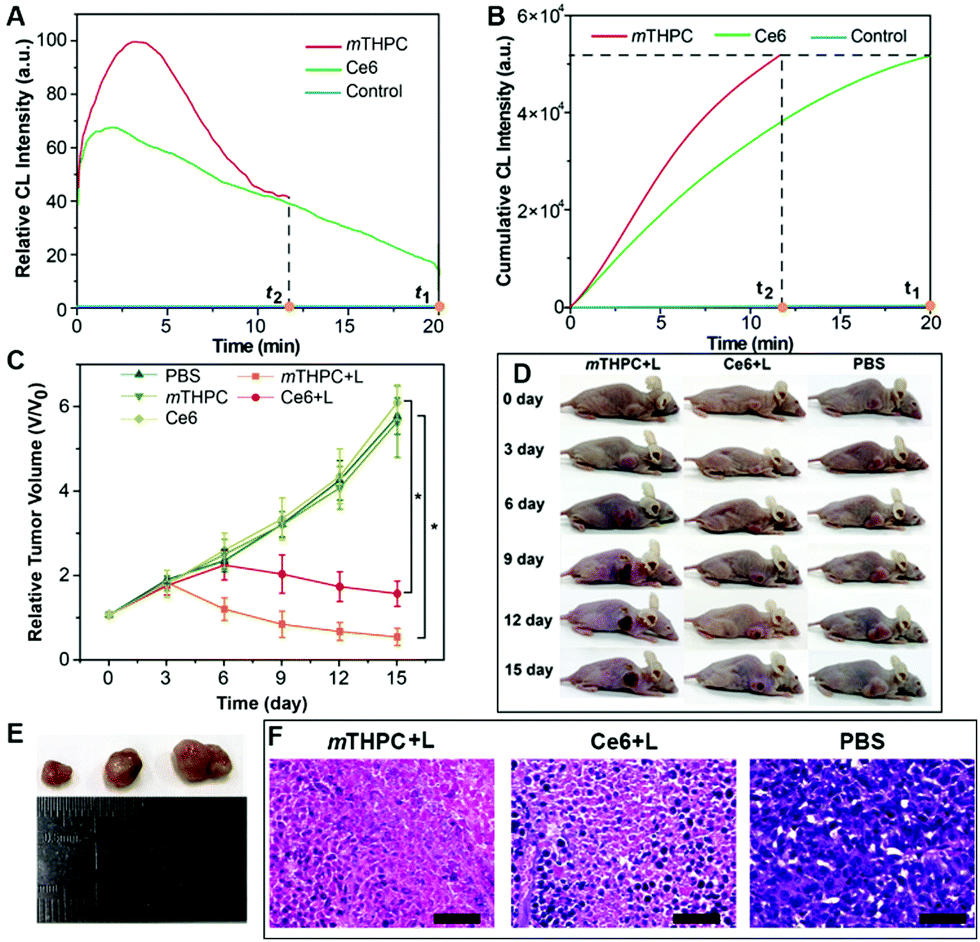 | ||
| Fig. 6 (A) The generation dynamics of 1O2 from the photosensitized reaction with mTHPC and Ce6 in tumors during PDT. The maximum CL intensity was normalized to 100. (B) Cumulative CL intensity of 1O2 from the photosensitized reaction with mTHPC and Ce6 in tumors during PDT. Control in A and B meant the photosensitized reaction without photosensitizer. (C) Tumor growth curves of mice with the various treatments. Tumor sizes were normalized to their initial sizes. Error bars were defined as the standard deviation, n = 5 mice with three repeats. (D) Corresponding images of tumors taken on day 15 of treatment. (E) Representative photographs of mice with the various treatments. (F) H&E images of tumors treated with PBS, mTHPC with irradiation, and Ce6 with irradiation collected on day 15. Scale bar, 50 μm. | ||
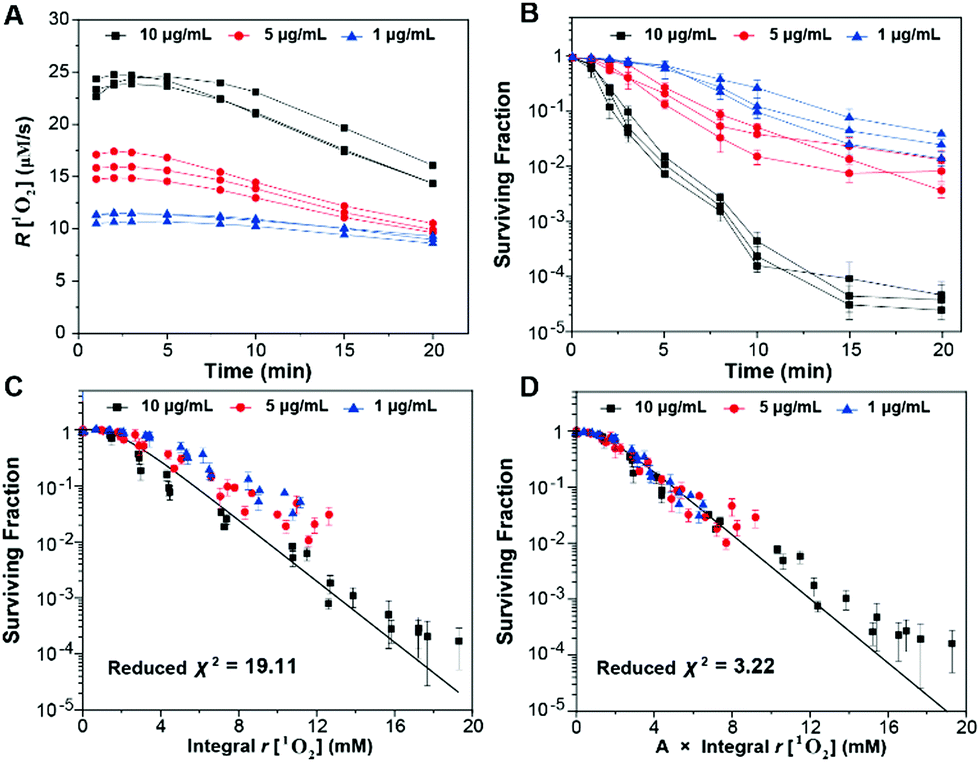
In order to clearly quantify the influence of the generation dynamics of 1O2 on the PDT efficacy, we investigated the relationship between the generation dynamics of 1O2 and the surviving fraction in vitro by using mTHPC as the model photosensitizer. In the experiments, we varied the concentrations of mTHPC and the treatment time (or the total fluence), while maintaining the same irradiation fluence rate. The generation dynamics of 1O2 as a function of treatment time for all of the experiments are shown in Fig. S38 (ESI†). The generation dynamics of 1O2 decreased with an increase in treatment time due to a combination of 3O2 consumption and mTHPC photobleaching.39 The average generation dynamics of 1O2 (Fig. 7A) and the cumulative amount of 1O2 (Fig. S39, ESI†) could be calculated from the data in Fig. S38 (ESI†). The results suggested that higher concentrations of mTHPC could result in more rapid generation dynamics of 1O2 and a larger cumulative amount of 1O2 generation. The cytotoxicity for a given fluence increased with increasing mTHPC incubation concentration. Subsequently, the data from Fig. 7B and Fig. S39 (ESI†) were combined to generate Fig. 7C, which showed the surviving fraction versus the integral generation dynamics of 1O2. The surviving fraction (SF) of cells as a function of the dose metric (D) is given by
| SF = 1 − (1 − exp(−D/D0))n, | (5) |
 | ||
| Fig. 7 (A) The average generation dynamics of 1O2 from the photosensitized reaction with various concentrations of mTHPC in HeLa cells during PDT. (B) Surviving fraction versus treatment time under a range of treatment conditions. (C) The fitting result of the surviving fraction as a function of the integral generation dynamics of 1O2. (D) The fitting result of the surviving fraction as a function of the modified integral generation dynamics of 1O2. | ||
In light of the evidence for adaptive responses, the approach is to converge the integral generation dynamics of 1O2 for various generation dynamics of 1O2 by an adaptive response function. The cytotoxic effect of PDT was more closely related to the initial generation dynamics of 1O2.41 Accordingly, we tested an empirical adaptive response factor (A) to the integral generation dynamics of 1O2
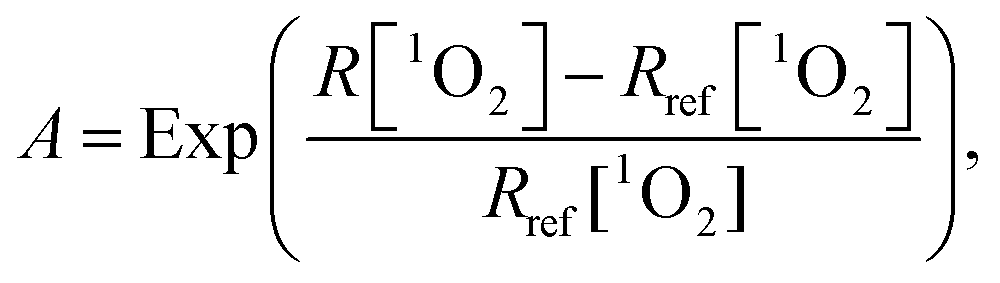 | (6) |
The dose metric is therefore:
 | (7) |
Subsequently, a better fit of the multiple-target survival model (eqn (5)) was achieved (reduced χ2 = 3.22) (Fig. 7D). From the fitting results, D0 was 1.53 ± 0.04 mM, which implied that 1.53 ± 0.04 mM 1O2 was required to reduce the survival by 1/e. The data were consistent with those in a previous study.38 Therefore, the surviving fraction of tumor cells could be estimated from the generation dynamics of 1O2 through the established multiple-target survival model. This investigation of a new dose metric for PDT could provide a deep insight into the relationship between the generation dynamics of 1O2 and the PDT efficacy. Our analysis could support the idea that the generation dynamics of 1O2 is responsible for the PDT efficacy.
Conclusions
In summary, we have designed a novel CL light-up probe for the real-time in vivo monitoring of 1O2 generation using Im-CDs with the advantages of facile synthesis, water-solubility, stability, biocompatibility and cell-permeability. The observation of the relationship between the generation dynamics of 1O2 and the PDT efficacy in both HeLa cells and tumor models demonstrated that the rapid generation dynamics of 1O2 could lead to an increased PDT efficacy in comparison with the slow generation dynamics of 1O2 in the presence of the same cumulative amount of 1O2. The reason for this phenomenon is that the presence of a cytoprotective autophagy pathway may reduce the biological effects at the slow generation dynamics of 1O2. The surviving fraction datum as a function of the generation dynamics of 1O2 are fitted much better with a modified multiple-target survival model (reduced χ2 = 3.22), which could be applied to estimate the surviving fraction of tumor cells from the generation dynamics of 1O2. This work has provided solid evidence that the generation dynamics of 1O2 rather than its cumulative amount is a promising evaluation standard for the PDT efficacy. We believe that this work will lay the foundation for the feasible evaluation of 1O2 generation-related life processes.Conflicts of interest
There are no conflicts to declare.Acknowledgements
This work was supported by the National Natural Science Foundation of China (21705035, 21974008, 61520106015 and 61635014).Notes and references
- D. Manoharan, W.-P. Li and C.-S. Yeh, Nanoscale Horiz., 2019, 4, 557–578 RSC.
- M. Li, H. Zhang, Y. Hou, X. Wang, C. Xue, W. Li, K. Cai, Y. Zhao and Z. Luo, Nanoscale Horiz., 2020, 5, 202–217 RSC.
- F. Hu, D. Mao, X. Cai, W. Wu, D. Kong and B. Liu, Angew. Chem., Int. Ed., 2018, 57, 10182–10186 CrossRef CAS PubMed.
- S. Shrestha, J. Wu, B. Sah, A. Vanasse, L. N. Cooper, L. Ma, G. Li, H. Zheng, W. Chen and M. P. Antosh, Proc. Natl. Acad. Sci. U. S. A., 2019, 116, 16823–16828 CrossRef CAS PubMed.
- Y. Wan, G. Lu, J. Zhang, Z. Wang, X. Li, R. Chen, X. Cui, Z. Huang, Y. Xiao, J. Chelora, W. Zhang, Y. Liu, M. Li, H.-Y. Xie and C.-S. Lee, Adv. Funct. Mater., 2019, 29, 1903436 CrossRef.
- G. Lan, K. Ni, S. S. Veroneau, X. Feng, G. T. Nash, T. Luo, Z. Xu and W. Lin, J. Am. Chem. Soc., 2019, 141, 4204–4208 CrossRef CAS PubMed.
- C. Ji, Q. Gao, X. Dong, W. Yin, Z. Gu, Z. Gan, Y. Zhao and M. Yin, Angew. Chem., Int. Ed., 2018, 57, 11384–11388 CrossRef CAS.
- Y. Gao, X. Wang, X. He, Z. He, X. Yang, S. Tian, F. Meng, D. Ding, L. Luo and B. Z. Tang, Adv. Funct. Mater., 2019, 29, 1902673 CrossRef.
- T. Zhang, Y. Li, Z. Zheng, R. Ye, Y. Zhang, R. T. K. Kwok, J. W. Y. Lam and B. Z. Tang, J. Am. Chem. Soc., 2019, 141, 5612–5616 CrossRef CAS PubMed.
- N. Hananya and D. Shabat, Angew. Chem., Int. Ed., 2017, 56, 16454–16463 CrossRef CAS PubMed.
- Y. Wei, J. Zhou and D. Xing, J. Biomed. Opt., 2007, 12, 014002 CrossRef.
- X. Li, G. Zhang, H. Ma, D. Zhang, J. Li and D. Zhu, J. Am. Chem. Soc., 2004, 126, 11543–11548 CrossRef CAS PubMed.
- J. Wang, D. Xing, Y. He and X. Hu, Cancer Lett., 2002, 188, 59–65 CrossRef CAS.
- F. Zou, W. Zhou, W. Guan, C. Lu and B. Z. Tang, Anal. Chem., 2016, 88, 9707–9713 CrossRef CAS PubMed.
- C. Ding, A. Zhu and Y. Tian, Acc. Chem. Res., 2014, 47, 20–30 CrossRef CAS PubMed.
- G. Hong, S. Diao, A. L. Antaris and H. Dai, Chem. Rev., 2015, 115, 10816–10906 CrossRef CAS PubMed.
- F. R. Baptista, S. A. Belhout, S. Giordani and S. J. Quinn, Chem. Soc. Rev., 2015, 44, 4433–4453 RSC.
- K. Nakashima, Biomed. Chromatogr., 2003, 17, 83–95 CrossRef CAS PubMed.
- G. Lu, J. Wada, T. Kimoto, H. Iga, H. Nishigawa, M. Kimura and Z. Hu, Eur. J. Org. Chem., 2014, 1212–1219 CrossRef CAS.
- H. Huang, C. Li, S. Zhu, H. Wang, C. Chen, Z. Wang, T. Bai, Z. Shi and S. Feng, Langmuir, 2014, 30, 13542–13548 CrossRef CAS PubMed.
- S. Hu, A. Trinchi, P. Atkin and I. Cole, Angew. Chem., Int. Ed., 2015, 54, 2970–2974 CrossRef CAS PubMed.
- Y. Wang and A. Hu, J. Mater. Chem. C, 2014, 2, 6921–6939 RSC.
- Y. Hu, J. Yang, J. Tian, L. Jia and J.-S. Yu, Carbon, 2014, 77, 775–782 CrossRef CAS.
- J. M. Lin and M. Yamada, Anal. Chem., 1999, 71, 1760–1766 CrossRef CAS PubMed.
- L. Tang, R. Ji, X. Cao, J. Lin, H. Jiang, X. Li, K. S. Teng, C. M. Luk, S. Zeng, J. Hao and S. P. Lau, ACS Nano, 2012, 6, 5102–5110 CrossRef CAS PubMed.
- W. Xue, Z. Lin, H. Chen, C. Lu and J.-M. Lin, J. Phys. Chem. C, 2011, 115, 21707–21714 CrossRef CAS.
- Y. Gong, B. Yu, W. Yang and X. Zhang, Biosens. Bioelectron., 2016, 79, 822–828 CrossRef CAS PubMed.
- T. Mizuhara, K. Saha, D. F. Moyano, C. S. Kim, B. Yan, Y.-K. Kim and V. M. Rotello, Angew. Chem., Int. Ed., 2015, 54, 6567–6570 CrossRef CAS PubMed.
- K. Dong, E. Ju, J. Liu, X. Han, J. Ren and X. Qu, Nanoscale, 2014, 6, 12042–12049 RSC.
- W. Zhou, Y. Cao, D. Sui and C. Lu, Angew. Chem., Int. Ed., 2016, 55, 4236–4241 CrossRef CAS PubMed.
- D. Song, S. Cho, Y. Han, Y. You and W. Nam, Org. Lett., 2013, 15, 3582–3585 CrossRef CAS PubMed.
- W. Piao, K. Hamaoka, T. Fujisawa, S. Takeuchi, T. Komatsu, T. Ueno, T. Terai, T. Tahara, T. Nagano and Y. Urano, J. Am. Chem. Soc., 2017, 139, 13713–13719 CrossRef CAS PubMed.
- W. An, L. S. Ryan, A. G. Reeves, K. J. Bruemmer, L. Mouhaffel, J. L. Gerberich, A. Winters, R. P. Mason and A. R. Lippert, Angew. Chem., Int. Ed., 2019, 58, 1361–1365 CrossRef CAS PubMed.
- S. Gnaim, A. Scomparin, S. Das, R. Blau, R. Satchi-Fainaro and D. Shabat, Angew. Chem., Int. Ed., 2018, 57, 9033–9037 CrossRef CAS PubMed.
- J. S. Dysart, G. Singh and M. S. Patterson, Photochem. Photobiol., 1995, 61, 632–638 CrossRef PubMed.
- K. J. Mellish, R. D. Cox, D. I. Vernon, J. Griffiths and S. B. Brown, Photochem. Photobiol., 2002, 75, 392–397 CrossRef CAS PubMed.
- T. A. Theodossiou, J. S. Hothersall, P. A. D. Witte, A. Pantos and P. Agostinis, Mol. Pharmacol., 2009, 6, 1775–1789 CrossRef CAS PubMed.
- J. S. Dysart, G. Singh and M. S. Patterson, Photochem. Photobiol., 2005, 81, 196–205 CrossRef CAS PubMed.
- S. Coutier, S. Mitra, L. N. Bezdetnaya, R. M. Parache, I. Geprgakoudi, T. H. Foster and F. Guillemin, Photochem. Photobiol., 2001, 73, 297–303 CrossRef CAS PubMed.
- J. J. Reiners, P. Agostinis, K. Berg, N. L. Oleinick and D. Kessel, Autophagy, 2010, 6, 7–18 CrossRef CAS PubMed.
- S. Kawauchi, Y. Morimoto, S. Sato, T. Arai, K. Seguchi, H. Asanuma and M. Kikuchi, Lasers Med. Sci., 2004, 18, 179–183 CrossRef CAS PubMed.
Footnote |
| † Electronic supplementary information (ESI) available: Experimental details, additional figures and table. See DOI: 10.1039/d0nh00128g |
| This journal is © The Royal Society of Chemistry 2020 |