 Open Access Article
Engineering the morphology of palladium nanostructures to tune their electrocatalytic activity in formic acid oxidation reactions†
Bulti
Pramanick
,
Trivender
Kumar
,
Aditi
Halder
 * and
Prem Felix
Siril
 *
*
School of Basic Science, Indian Institute of Technology Mandi, Himachal Pradesh 175005, India. E-mail: prem@iitmandi.ac.in; aditi@iitmandi.ac.in
First published on 21st October 2020
Abstract
Pd nanomaterials can be cheaper alternative catalysts for the electrocatalytic formic acid oxidation reaction (FAOR) in fuel cells. The size and shape of the nanoparticles and crystal engineering can play a crucial role in enhancing the catalytic activities of Pd nanostructures. A systematic study on the effect of varying the morphology of Pd nanostructures on their catalytic activities for FAOR is reported here. Palladium nanoparticles (Pd0D), nanowires (Pd1D) and nanosheets (Pd2D) could be synthesized by using swollen liquid crystals as ‘soft’ templates. Swollen liquid crystals are lyotropic liquid crystals that are formed from a quaternary mixture of a surfactant, cosurfactant, brine and Pd salt dissolved in oil. Pd1D nanostructures exhibited 2.7 and 19 fold higher current density than Pd0D and Pd2D nanostructures in the FAOR. The Pd1D nanostructure possess higher electrochemically active surface area (ECSA), better catalytic activity, stability, and lower impedance to charge transfer when compared to the Pd0D and Pd2D nanostructures. The presence of relatively higher amounts of crystal defects and enriched (100) crystal facets in the Pd1D nanostructure were found to be the reasons for their enhanced catalytic activities.
1 Introduction
The increasing energy demands and environmental concerns associated with conventional fossil fuels have prompted the search for alternative energy sources.1 One of the potential alternative energy sources is fuel cells. They convert fuels into electrical energy through chemical reaction pathways. Fuel cells provide clean and sustainable energy by directly utilizing renewable fuels such as formic acid, methanol, and hydrogen.1,2 Direct alcohol fuel cells (DAFCs) are attractive for onboard applications. However, they have certain limitations such as relatively high operating temperature and high membrane crossover in polymer electrolyte membrane (PEM) based fuel cells. Direct formic acid fuel cells (DFAFCs) are attractive as they are devoid of such difficulties.3 Platinum (Pt) is the most electro-active material for fuel cell reactions. Pt nanostructures are active for the methanol electro-oxidation reaction,4 ethanol electro-oxidation5,6 and formic acid oxidation reaction (FAOR).7,8 Unfortunately, Pt is prone to be poisoned easily by CO adsorption on the active sites. Due to this, the electro-catalytic activity of the catalyst gets drastically lowered. Besides, Pt is a very costly metal owing to its relatively low abundance and is the major hindrance for commercialization of fuel cells.9Recently, a great deal of attention has been paid to develop alternative catalysts that are cheaper than Pt.10,11 Pd nanostructures have emerged as a potential alternative as they have comparable activity and are cheaper when compared to Pt.12–14 Moreover, the formic acid reduction reaction with Pd catalysts proceeds by the direct dehydrogenation pathway, avoiding the formation of poisoning CO.9 The electrocatalytic activity of noble metal nanostructures depends on their surface area, crystal phase, particle morphology and the abundance of active sites.13 The electrocatalytic activity of metal catalysts can be varied by controlling the crystal structure, shape, size and composition of the materials at the nanoscale.9,13,15,16 Thus, particle size modulation and crystal engineering can be employed to tune the catalytic activities of metallic nanostructures.17 Hence, the synthesis of highly active Pd catalysts with a controlled shape and size is one of the most interesting aspects in fuel cell research.18,19
The particle size of Pd nanoparticles supported on carbon was found to have a profound effect on their catalytic activities for the FAOR.20 In contrast, the size of anisotropic Pd particles did not affect their FAOR activities.21 The electrocatalytic FAOR activities of Pd nanostructures were found to be sensitive to the shape of the nanoparticles. The maximum current densities decreased in the order cubes > truncated cubes > cuboctahedra > truncated octahedra > octahedra.21 This study concluded that the oxidation of formic acid on Pd(100) was more rapid than that on Pd(111).21 It has been shown in many studies that the electrocatalytic activities of Pd are strongly dependent on the exposed crystal facets.9 Among the low index planes of Pd, the maximum current density of the FAOR increases in the positive scan as follows: Pd(110) < Pd(111) < Pd(100).22 Studies using single crystal Pd surfaces were performed to understand the role of the crystal planes of Pd in the FAOR.22 It is also known that Pd nanoparticles having twinned structures showed better FAOR activity than commercial Pd.23 However, often controlling the size, shape and crystal structure alone may not be sufficient to achieve better catalytic activities as crystal defects also play a key role.
The morphology of nanomaterials in general and Pd nanostructures specifically can be tuned in solution by various approaches such as seed mediated growth, kinetic control or by the use of surfactants, capping agents or ligands.24,25 Self assembled structures such as micelles and their higher ordered structures such as lyotropic liquid crystals can be used as ‘soft’ templates.26,27 Swollen liquid crystals (SLCs), a class of lyotropic liquid crystals, were used effectively to synthesize nanostructures of various shapes of Pd and other metals.28–33 SLCs are formed by the self-assembly of surfactants and their structural aspects can be tuned by varying their composition and hence are versatile templates for the preparation of nanostructures of metals, metal oxides and polymers.27,28,31,34–36 We could achieve nanoparticles (0D), nanorods (1D) and nanosheets (2D) of Pd with the help of SLCs as reported earlier.28,31,32 In this paper, the shape dependency of Pd nanostructures on their FAOR electrocatalytic activity has been studied in detail. The change in the morphology was found to have a strong role in the electrocatalytic FAOR activities.
2 Experimental section
2.1 Materials
Cetyltri-methylammonium bromide (CTAB), toluene, sodium chloride (NaCl), tris(dibenzylideneacetone) dipalladium (0) (Pd2(dba)3), sodium borohydride (NaBH4), 1-pentanol, isopropanol (iPA) and hydrazine hydrate were purchased from Merck. Formic acid, sulfuric acid and Nafion® solution in methanol (5% by mass) were from Fisher Scientific. Ultrapure Milli Q deionised water (Elga pure lab option-R7) was used for the experiments.2.2 Preparation of the Pd nanostructures
The nanostructures were synthesized using a surfactant assisted ‘soft’ templating approach.37,38 Typically, CTAB (1.5 g) was dissolved in aqueous NaCl solution (3 mL, 0.1 M) in a Pyrex glass culture tube by heating at 60 °C for 20 min. Toluene (4.5 mL) containing the salt of Pd2(dba)3, (10−3 M) was added to the above surfactant solution and mixed by vortexing to form an emulsion. The emulsion gradually was transformed into the mesophase on the addition of the required amount of the co-surfactant, i.e. 2-pentanol in aliquots of 20 μL. The mesophases were kept sealed for a few days to equilibrate at room temperature. The Pd precursor was converted into Pd nanostructures by exposing the mesophases to either hydrazine vapor,31,33 hydrogen32 or carbon monoxide gas.28 The Pd nanostructures were extracted from the mesophase by dissolving excess CTAB in isopropanol followed by centrifugation. The extracted Pd nanostructures were copiously washed by using isopropanol.2.3 Testing the electrocatalytic activities
The catalyst ink was prepared by adding the catalyst (0.5 mg) and the Nafion solution (10 μL) into an iPA and water (1![[thin space (1/6-em)]](https://www.rsc.org/images/entities/char_2009.gif) :
:![[thin space (1/6-em)]](https://www.rsc.org/images/entities/char_2009.gif) 1) mixture (500 μL). Then, the catalyst suspension (11–13 μL) was dropcast on a clean glassy carbon (GC) disk electrode having a 5 mm diameter (geometric area = 0.196 cm2) and dried under an infrared (IR) lamp. The electrocatalytic activities of the different catalysts were tested on an Autolab electrochemical workstation (Metrohm, 302N) in a standard three electrode system. Ag/AgCl saturated with 3 M KCl and a Pt wire were used as the reference and counter electrodes, respectively. A rotating disc electrode (RDE) of the catalyst deposited GC was used as the working electrode.
1) mixture (500 μL). Then, the catalyst suspension (11–13 μL) was dropcast on a clean glassy carbon (GC) disk electrode having a 5 mm diameter (geometric area = 0.196 cm2) and dried under an infrared (IR) lamp. The electrocatalytic activities of the different catalysts were tested on an Autolab electrochemical workstation (Metrohm, 302N) in a standard three electrode system. Ag/AgCl saturated with 3 M KCl and a Pt wire were used as the reference and counter electrodes, respectively. A rotating disc electrode (RDE) of the catalyst deposited GC was used as the working electrode.
2.4 Characterization
The morphology of the nanostructures was characterized by using field emission scanning electron microscopy (FESEM, FEI Nova Nano SEM-450). The samples were drop casted on a clean silicon wafer and dried in air. The characteristics of the samples were studied further by using transmission electron microscopy (TEM, FEI Tecnai G2 20 S-TWIN) imaging as well as atomic force microscopy (AFM, AFM Dimension ICON, Bruker) imaging. Solid state analysis was carried out using powder X-ray diffraction (PXRD) recorded with Cu Kα used as an X-ray source (λ = 1.54 Å) by using a Smart Lab 9 kW rotating anode X-ray diffractometer. X-ray photoelectron spectroscopy (XPS) analysis was performed using a Thermo Scientific NEXSA SURFACE ANALYSIS System. Inductively coupled plasma mass spectrometry (ICP-MS) analysis was carried out by using an Element XR system (Thermo Fischer Scientific, Germany) coupled to a 7500a ICP mass spectrometer (SAIF, IIT Bombay, India).3 Results and discussion
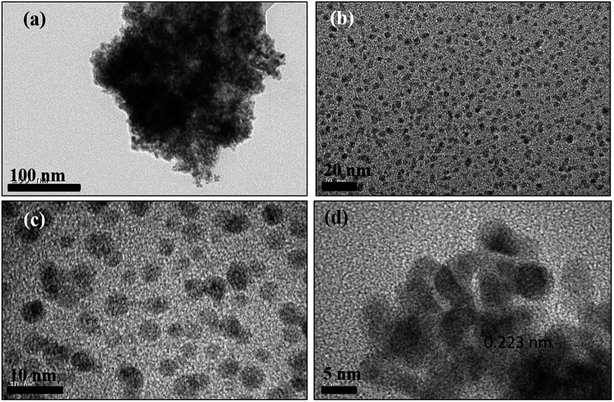
A bright yellow colored transparent and viscous mesophase was formed on mixing the surfactant solution with the oil phase and co-surfactant as shown in Fig. 1. Synthesis of the nanostructures was carried out as reported earlier.28,31,32 The color of the transparent mesophase turned completely to dark black, black and dark blue on exposure to hydrazine, hydrogen gas and CO respectively as depicted in Fig. 1. The color change was similar to what was already reported in the literature and confirmed the transformation of the Pd salt to Pd nanostructures.28,31,32The TEM images of the nanostructures (Fig. 2–4) revealed the formation of Pd nanostructures having a similar morphology to the nanoparticles that were prepared under similar conditions.28,31,32 The shape and size of the nanoparticles varied according to the nature of the reducing agent used. Exposure of the Pd2(dba)3 containing mesophase to hydrazine vapour resulted in the formation of spherical Pd nanoparticles predominantly as evident from Fig. 2(a–d). The histogram showing the particle size distribution is shown in Fig. S1a (ESI†). A small amount of nanorods and nanowires could also be seen along with spherical particles. This particular sample will henceforth be named Pd0D nanostructures. The spherical nanoparticles had an average size of 5.52 ± 2.76 nm and were observed to be highly agglomerated due to the high surface energy of the small particles. The agglomeration of the Pd0D was evident from the FESEM images given in Fig. 5(a and b) also.
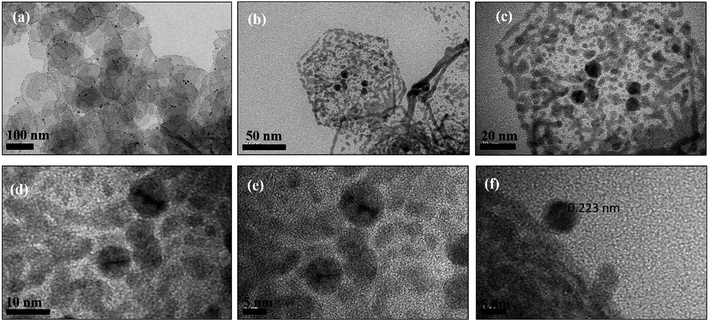 | ||
| Fig. 4 (a–c) TEM images and (d–f) HRTEM images of Pd hexagonal nanosheets (Pd2D) at different resolutions. | ||
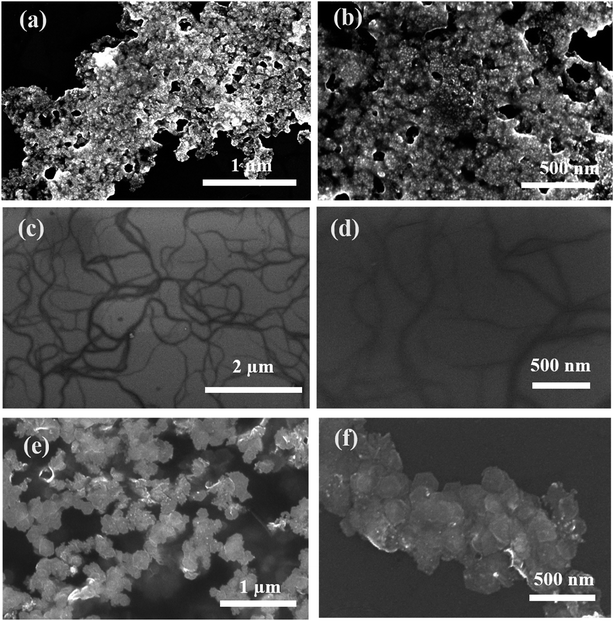 | ||
| Fig. 5 FESEM images of (a, b) Pd0D, (c, d) Pd1D and (e, f) Pd2D nanostructures at different magnifications. | ||
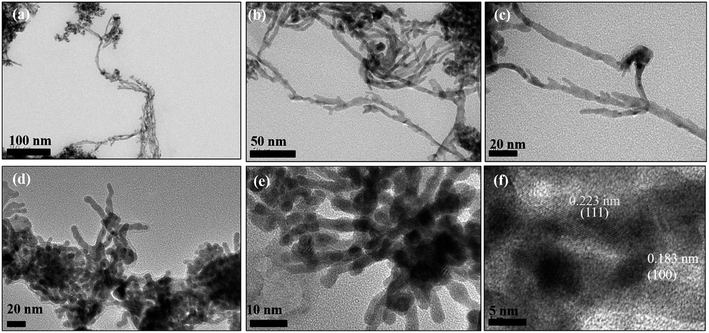
However, exposure of the mesophase to hydrogen gas resulted in the formation of nanowires of Pd along with a small fraction of spherical nanoparticles as shown in Fig. 3 (a–f). The sample has been named Pd1D nanostructures. The nanowires have a uniform diameter of 6.08 ± 0.86 nm as evident from the histogram shown in Fig. S1b (ESI†). The nanowires are very long ranging up to many micrometers as per the FESEM images shown in Fig. 5(c and d) as well as the AFM image given in Fig. 6b. Interestingly, exposure of the Pd2(dba)3 containing mesophase to CO resulted in the formations of sheets of Pd with a hexagonal structure as shown in Fig. 4(a–f). Hence, the nanostructures are named Pd2D nanostructures. The hexagonal Pd2D nanostructures have an average diagonal length of 80 ± 11.5 nm as shown in Fig. S1c (ESI†).31,32,39 The nanosheets have thickness in the range of about 4 nm as per AFM measurements. The nanosheets were highly porous as per the TEM images.
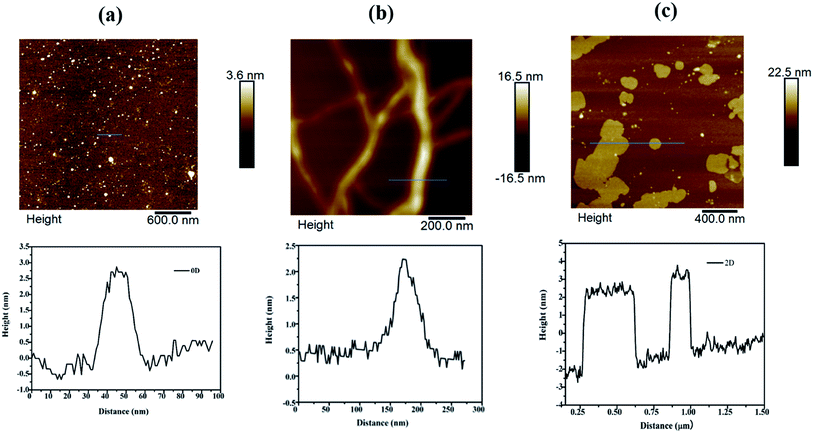 | ||
| Fig. 6 AFM images of (a) Pd0D, (b) Pd1D and (c) Pd2D nanostructures along with the height profile along the line marked in the images. | ||
Selected area electron diffraction (SAED) of the nanostructures was carried out and the patterns are shown in Fig. S2 (ESI†). The nanostructures are polycrystalline in nature as they showed the presence of (111), (200), (220), (311) and (222) planes respectively of the face centered cubic (fcc) morphology of Pd.
The interplay between the kinetics of ligand exchange of dba with the reducing agents, confinement effect of the mesophases and the selective adsorption and blocking of certain crystal facets are the reasons for the observed variation in the morphology. These factors are reported and discussed elsewhere.28,31–33 The gaseous reducing agents (viz. hydrazine vapour, hydrogen gas and carbon monoxide) diffuse slowly from the top to bottom of the mesophase containing Pd2(dba)3. Ligand exchange leads to coalescence of the Pd atoms within the confinement of the mesophases. Simultaneous formation of a greater number of nuclei happens in the presence of hydrazine than hydrogen. Hence, the formation of spherical nanoparticles predominates in the presence of hydrazine. However, growth of the initially formed nuclei within the confinement along the axis of cylindrical micelles takes place in the presence of hydrogen, leading to the formation of nanowires.31,32 Ligand exchange with CO is well known to lead to the formation of nanosheets of Pd due to the lateral coalescence of initially formed Pd-carbonyl clusters.40,41
The HRTEM images of 0D, ID and 2D Pd nanostructures along with their FFT patterns are shown in Fig. 7(a, b), (c, d) and (e, f) respectively. The HRTEM images and their respective FFT patterns of all three types of nanostructures showed the presence of (111) planes with a lattice spacing of 0.223 nm. However, HRTEM images and their FFT patterns of Pd1D showed the presence of (100) planes in addition to the (111) planes. In addition, the HRTEM images of Pd1D revealed lattice defects and twin boundaries. The plane positions in Pd1D indicated accumulation of dislocations at the boundaries. Nanorods with structural defects and uneven twin boundary defects often arise due to their typical nucleation and growth patterns.42
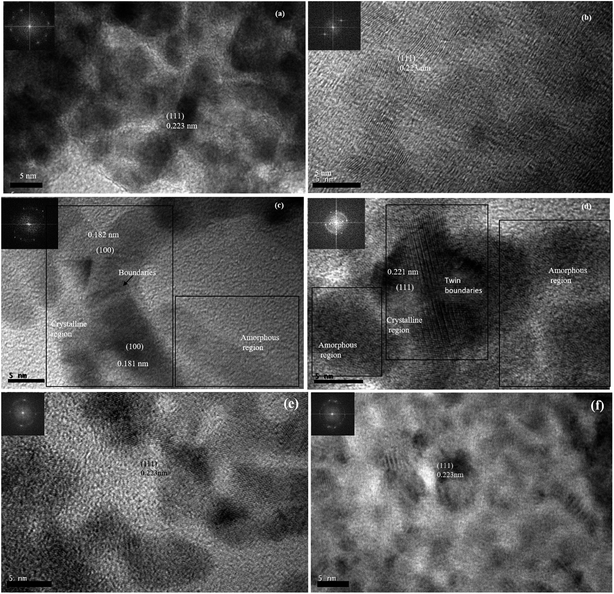 | ||
| Fig. 7 HRTEM images and the live FFT patterns from the HRTEM images of Pd nanostructures. (a, b) Pd0D (c, d) Pd1D and (e, f) Pd2D. | ||
The solid state characteristics of the synthesized nanomaterials were studied using PXRD and the data are presented in Fig. 8. All three nanostructures showed peaks corresponding to the fcc structure of Pd. The peaks at 2θ of 39.4, 46.3 and 67.5 correspond to the (111), (200), (220) and (311) planes of Pd as per the JCPDS database. The characteristic diffraction peaks of (111), (200), (220) and (311) planes appeared at 2θ, 39.77, 46.44, 67.96 and 81.84 respectively for Pd0D, 39.80, 46.49, 67.78 and 81.84 for Pd1D and at 40.08, 46.64, 68.02 and 82.08 for Pd2D.32,43,44 The Pd2D nanostructures have sharper diffraction peaks than the others. Peak broadening was observed for Pd0D and Pd1D nanostructures owing to their small crystallite sizes. The peak intensity ratios for Pd (111), (200), (220) and (311) planes are 1![[thin space (1/6-em)]](https://www.rsc.org/images/entities/char_2009.gif) :
:![[thin space (1/6-em)]](https://www.rsc.org/images/entities/char_2009.gif) 0.39
0.39![[thin space (1/6-em)]](https://www.rsc.org/images/entities/char_2009.gif) :
:![[thin space (1/6-em)]](https://www.rsc.org/images/entities/char_2009.gif) 0.27
0.27![[thin space (1/6-em)]](https://www.rsc.org/images/entities/char_2009.gif) :
:![[thin space (1/6-em)]](https://www.rsc.org/images/entities/char_2009.gif) 0.25 for Pd0D 1
0.25 for Pd0D 1![[thin space (1/6-em)]](https://www.rsc.org/images/entities/char_2009.gif) :
:![[thin space (1/6-em)]](https://www.rsc.org/images/entities/char_2009.gif) 0.44
0.44![[thin space (1/6-em)]](https://www.rsc.org/images/entities/char_2009.gif) :
:![[thin space (1/6-em)]](https://www.rsc.org/images/entities/char_2009.gif) 0.34
0.34![[thin space (1/6-em)]](https://www.rsc.org/images/entities/char_2009.gif) :
:![[thin space (1/6-em)]](https://www.rsc.org/images/entities/char_2009.gif) 0.32 for Pd1D and 1
0.32 for Pd1D and 1![[thin space (1/6-em)]](https://www.rsc.org/images/entities/char_2009.gif) :
:![[thin space (1/6-em)]](https://www.rsc.org/images/entities/char_2009.gif) 0.40
0.40![[thin space (1/6-em)]](https://www.rsc.org/images/entities/char_2009.gif) :
:![[thin space (1/6-em)]](https://www.rsc.org/images/entities/char_2009.gif) 0.28
0.28![[thin space (1/6-em)]](https://www.rsc.org/images/entities/char_2009.gif) :
:![[thin space (1/6-em)]](https://www.rsc.org/images/entities/char_2009.gif) 0.24 for Pd2D respectively. Evidently, the Pd1D nanostructures have a distinctly lower relative amount of (111) planes when compared to the other crystal planes than Pd0D and Pd2D nanostructures.
0.24 for Pd2D respectively. Evidently, the Pd1D nanostructures have a distinctly lower relative amount of (111) planes when compared to the other crystal planes than Pd0D and Pd2D nanostructures.
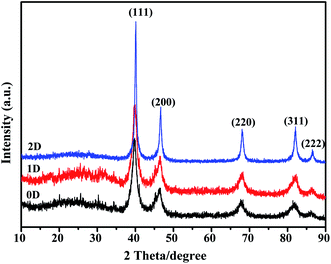 | ||
| Fig. 8 X-ray diffraction patterns of the 0D, 1D and 2D Pd nanostructures at a scan rate of 2° per min. | ||
The surface chemical composition and oxidation states of the Pd nanostructures were investigated using the XPS technique and survey spectra are shown in Fig. S3 (ESI†). Deconvolution of high resolution-scans of Pd as shown in Fig. 9 clearly confirmed the existence of Pd 3d3/2 and Pd 3d5/2 (340 and 335 eV) for metallic Pd0 states. The nanostructures have a partially oxidized surface which was evident from the presence of doublets at 337 and 342.5 eV corresponding to Pd2+ oxidation states. There was some variation in the amount of oxides in each sample as shown in Table 1. The Pd0D particles have a higher oxide content owing to the fine particle size and higher surface area. The deconvoluted binding energy of the C 1s spectrum of Pd0D NPs fitted in two peaks at 284.82 eV (C–C) and 286.2 eV (C–O), for Pd1D 284.86 eV (C–C) and 286.3 eV(C–O) and for Pd2D 284.81 eV(C–C) and 286.2 eV(C–O) respectively. The Pd2D nanostructure showed a third peak at 289.3 eV corresponding to C![[double bond, length as m-dash]](https://www.rsc.org/images/entities/char_e001.gif) O binding energy in Fig. S4 (ESI†). This peak appeared because of the strong tendency of Pd to adsorb CO on the (111) facets.45 ICP-MS was used to determine the actual Pd in the synthesized Pd nanostructure and the measured amount of the Pd metal is given in Table 1.
O binding energy in Fig. S4 (ESI†). This peak appeared because of the strong tendency of Pd to adsorb CO on the (111) facets.45 ICP-MS was used to determine the actual Pd in the synthesized Pd nanostructure and the measured amount of the Pd metal is given in Table 1.
 | ||
| Fig. 9 High resolution X-ray photoemission spectra of Pd nanostructures corresponding to Pd 3d of (a) 0D, (b) 1D and (c) 2D. | ||
| Catalysts | ICP-MS | Surface metal composition from XPS | |||||
|---|---|---|---|---|---|---|---|
| Pure Pd | Pd metal relative (%) | Pd metal oxide relative (%) | Binding energy Pd 3d5/2 (eV) | Binding energy Pd 3d3/2 (eV) | Binding energy Pd2+ 3d5/2 (eV) | Binding energy Pd2+ 3d3/2 (eV) | |
| Pd0D | 87% | 78.4 | 21.6 | 335.05 | 340.28 | 336.78 | 342.39 |
| Pd1D | 78% | 87.4 | 10.6 | 335.25 | 340.58 | 336.88 | 342.18 |
| Pd2D | 91% | 85.0 | 15.0 | 335.74 | 340.98 | 337.78 | 343.08 |
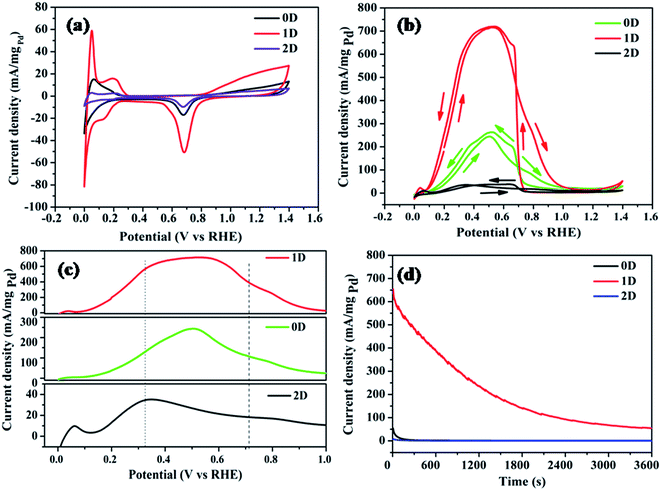
The cyclic voltammograms of the modified GC electrodes in H2SO4 electrolyte (0.5 M), at a scan rate of 10 mV s−1 are shown in Fig. 10a. In the cathodic scan, the three peaks at the potential 0.0, 0.136 and 0.686 V vs. RHE arise corresponding to the absorption, adsorption of H2 atoms on Pd facets and surface reduction of Pd, respectively.46 During the anodic scan, the peaks observed at 0.051 and 0.20 V vs. RHE are due to desorption of hydrogen atoms and oxidation of adsorbed hydrogen respectively on the Pd sites.47 The three different nanostructures of Pd have different surface structures and thus possess different electrocatalytic activities. The asymmetric cathodic and anodic peaks in the 0.00–0.12 V range are attributed to the electro-absorption and electro-desorption of absorbed H. The distinct hydrogen underpotential deposition region (Hupd) on the Pd1D sample clearly reflects its high electrochemical surface area in comparison to that of Pd0D and Pd2D, giving an indication that Pd1D might be catalytically more active than the rest. The hydrogen absorption/desorption region of Pd is interesting due to the adsorption of H. There are two distinct regions noted to be present in this region due to electrochemical deposition of H: (a) HUPD region and (b) overpotential deposition of hydrogen (OPD-H).48,49 In fact, out of the three samples, the Pd1D sample only exhibited the distinct Hupd and Hopd regions. Among all three catalysts, Pd1D also showed the highest electrical double layer region.
Electrochemically active surface area (ECSA) is a significant parameter to evaluate catalytic activity and quantify the number of active sites for an electrode. The ECSA of the Pd nanostructures was estimated by integrating the peak area of reduced Pd(II) oxide during cathodic scan in the range of 0.52–0.84 V vs. RHE (See Fig. 10a). The ECSA was calculated using the following equation:50,51
| ECSA = Q/0.424 mC cm−2 × Pdm |
Fig. 10b represents the CV curves of the synthesized catalysts in H2SO4 (0.5 M) + HCOOH (0.5 M) at a scan rate of 10 mV s−1 indicating the FAOR in the presence of Pd nanostructures. Among the three catalysts, Pd1D exhibited the highest current density for the FAOR. The first oxidation peak in CV curves refers to the formic acid oxidation whereas the second peak indicates the completion of the formic acid oxidation to carbon dioxide. The onset potential for the FAOR is lowest for Pd1D (0.08 V), and highest for Pd2D (0.129 V) as shown in Fig. 10c. This clearly reveals that the active sites for adsorption of formic acid are more abundant in Pd1D than the others and lowest in Pd2D. The electrooxidation of formic acid is known to follow the ‘dual pathway’ mechanism. The ‘direct pathway’ involves the formation of active intermediates, followed by the electro-oxidation of the intermediate.52–55 On the other hand, the ‘indirect pathway’ involves the formation of carbon monoxide as an intermediate. It is important to avoid the ‘indirect pathway’, as adsorption of CO on the catalytic surface is highly detrimental due to the blockage of the active sites. The reaction pathway for all three catalysts seems to follow the ‘direct pathway’ for the FAOR.
The forward scans and backward scans for all three catalysts have been compared from the cyclic voltammograms in Fig. 10c and S5† respectively. The highest peak position corresponding to the FAOR was observed at 0.502, 0.34 and 0.528 V vs. RHE respectively for Pd0D, Pd2D and Pd1D. The presence of CO as the capping agent in Pd2D has driven the reaction towards the indirect pathway as it did not allow the dehydrogenation of formic acid. Hence, the lowest current density for the FAOR was recorded for Pd2D. This proves that not only the morphology, but the capping agent also plays a crucial role in determining the activity of the catalysts. In the case of Pd0D and Pd1D catalysts, the direct pathway for the FAOR was followed. The Pd1D catalyst showed the maximum current density of 720 mA mgPd−1 which is 2.7 times higher than that of Pd0D (263 mA mgPd−1) and 19 times higher than that of Pd2D (37 mA mgPd−1). The electrocatalytic activity of the Pd nanostructures followed the order 1D > 0D > 2D. Electrochemical impedance measurements shown in Fig. S6 (ESI†) showed the lowest charge transfer resistance for Pd1D and highest for Pd2D nanostructures. This indicates the presence of residual surfactant/capping agent in the Pd nanostructures and their role in the charge transfer process.
Besides very good electrocatalytic activity, the long-term stability of a catalyst is an important criterion for its practical application in fuel cells. Hence, chronoamperometry measurements were performed to study steady state formic acid oxidation currents at 0.35 V vs. RHE. The current densities gradually decreased with time for all the catalysts as can be seen from Fig. 10d. This is due to the deactivation of the catalysts due to the adsorption and poisoning by CO. However, the current decay rate of Pd1D was much slower than that of the other two catalysts. After 3600 s, the current density of Pd1D was 55 mA mgPd−1, indicating that the catalyst could maintain 8.4% of its original activity.
The electrocatalytic FAOR activity of the Pd nanostructures clearly delineates a profound impact of the morphology of the nanostructures and the presence of residual surfactant/capping agent on their catalytic activities. It is of great interest to understand the reasons behind such a difference in the activity as the catalytic material (Pd) was the same. Some hint about the difference in the crystal structure of the nanostructures was evident from PXRD and SAED patterns. While Pd0D and Pd2D have predominantly high amounts of (111) facets of fcc Pd, other facets are relatively more abundant in Pd1D. Moreover, the presence of adsorbed CO on the (111) facets of 2D nanostructures resulted in their lower electrocatalytic activity than Pd1D and Pd2D. Nevertheless, as catalytic activity is predominantly a surface phenomenon, it is important to understand the crystal nature of the surface of the particles. We have performed detailed HRTEM imaging and FFT analysis of the samples to develop a deeper understanding of the surface characteristics. While Pd(111) planes were present in all three nanostructures, the presence of (100) planes was also evident in Pd1D nanostructures. Thus, the presence of more active (100) facets of Pd on the surface of Pd1D is one of the main reasons for the observed enhanced FAOR electrocatalytic activity. Moreover, there were more defect sites and twin boundaries on the Pd1D surface. Defect sites on the Pd surface are well known to promote FAOR activities.14
Finally, the catalytic activity of the Pd1D nanostructure was compared with those of other Pd based catalysts that are reported in the literature for the FAOR. It is evident from Table 2 that Pd1D showed one of the best catalytic activities among Pd based catalysts including bi-metallic nanomaterials, and supported Pd nanoparticles on graphene and carbon nanotubes. Thus, it can be concluded that the catalytic activities of Pd nanomaterials could efficiently be tuned by controlling the morphology and engineering the surface properties.
| Catalyst | ECSA (m2 gPd−1) | Current density (mA mgPd−1) | Ref. |
|---|---|---|---|
| CuPd@Pd tetrahedron | 10.17 | 501.8 | 56 |
| Pd–MO2N/rGO | 58.12 | 532.7 | 57 |
| Pd–Sn-INNs | 18.6 | 553.37 | 58 |
| Pd51Cu49 | 33.2 | 517.0 | 59 |
| Pd1Ni1-Ns/RGO | 98.2 | 604.3 | 60 |
| PdCuSn/CNTs | 37.92 | 534.83 | 61 |
| Pd/NS-G | 83.4 | 501.8 | 62 |
| AP-Pd/GN | 72.72 | 446.3 | 63 |
| 2D porous Pd nanosheets | 12.9 | 409.3 | 64 |
| Pd3Pt half-shells | 21.3 | 318.0 | 65 |
| Pd6Co/3DG | 51.0 | 430.8 | 66 |
| Us-Pd4Ir@Graphene | 76.3 | 578.6 | 67 |
| PdCo/WC-C | 58.9 | 534.7 | 68 |
| Pd 1D | 89.80 | 720.0 | This work |
4 Conclusions
We could efficiently control the morphology of the Pd nanoparticles by the use of swollen liquid crystals as a ‘soft’ structure directing template along with the use of an appropriate reducing agent. Exposure of mesophases containing the Pd precursor to hydrazine vapour, hydrogen gas and carbon monoxide resulted in the formation of Pd nanostructures having spherical, nanowire and nanosheet morphologies, respectively. Morphology of the Pd nanostructures has a profound effect on the electrocatalytic activities in the formic acid oxidation reaction. The nanowires showed many fold higher electrocatalytic activities when compared to spherical nanoparticles and nanosheets. The higher electrocatalytic activity of the nanowires is due to the presence of a relatively higher proportion of (100) facets as well as crystals defects. Moreover, the presence of strongly bound carbon monoxide on the surface of Pd2D nanosheets adversely affected their catalytic activities.5 Conflicts of interest
There are no conflicts to declare.Acknowledgements
Advance material research centre (AMRC), IIT Mandi is acknowledged for providing experimental facilities. UGC-RGNF is thanked for providing fellowship to Bulti. Financial assistance from DST, SERB through EMR_2016_006756 is also gratefully acknowledged.References
- M. S. Faber and S. Jin, Energy Environ. Sci., 2014, 7, 3519–3542 RSC.
- M. Del Cueto, P. Ocón and J. M. L. Poyato, J. Phys. Chem. C, 2015, 119, 2004–2009 CrossRef CAS.
- X. Ji, K. T. Lee, R. Holden, L. Zhang, J. Zhang, G. A. Botton, M. Couillard and L. F. Nazar, Nat. Chem., 2010, 2, 286–293 CrossRef CAS.
- G. B. Melle, F. W. Hartl, H. Varela and E. Sitta, J. Electroanal. Chem., 2018, 826, 164–169 CrossRef CAS.
- R. Rizo, D. Sebastián, J. L. Rodríguez, M. Jesús and E. Pastor, J. Catal., 2017, 348, 22–28 CrossRef CAS.
- Z. Zheng, Y. Huyan, H. Li, S. Sun and Y. Xu, Sens. Actuators, B, 2019, 127065 CrossRef CAS.
- Y. Kang, L. Qi, M. Li, R. E. Diaz, D. Su, R. R. Adzic, E. Stach, J. Li and C. B. Murray, ACS Nano, 2012, 6, 2818–2825 CrossRef CAS.
- C. S. Russell, Am. Stat., 1985, 39, 333 CrossRef.
- K. Jiang, H. X. Zhang, S. Zou and W. Bin Cai, Phys. Chem. Chem. Phys., 2014, 16, 20360–20376 RSC.
- H. Wang, S. Lu, Y. Zhang, F. Lan, X. Lu and Y. Xiang, J. Mater. Chem. A, 2015, 3, 6282–6285 RSC.
- L. Sharma, H. S. Khushwaha, A. Mathur and A. Halder, J. Solid State Chem., 2018, 265, 208–217 CrossRef CAS.
- S. Sarkar and S. C. Peter, Inorg. Chem. Front., 2018, 5, 2060–2080 RSC.
- A. Chen and C. Ostrom, Chem. Rev., 2015, 115, 11999–12044 CrossRef CAS.
- T. Shen, J. Zhang, K. Chen, S. Deng and D. Wang, Energy Fuels, 2020, 34, 9137–9153 CrossRef CAS.
- A. Halder, S. Patra, B. Viswanath, N. Munichandraiah and N. Ravishankar, Nanoscale, 2011, 3, 725–730 RSC.
- R. Rizo and B. Roldan Cuenya, ACS Energy Lett., 2019, 4, 1484–1495 CrossRef CAS.
- S. Cheong, J. D. Watt and R. D. Tilley, Nanoscale, 2010, 2, 2045 RSC.
- S. D. Senanayake and D. R. Mullins, J. Phys. Chem. C, 2008, 112, 9744–9752 CrossRef CAS.
- S. Guo, S. Dong and E. Wang, ACS Nano, 2010, 4, 547–555 CrossRef CAS.
- W. Zhou and J. Y. Lee, J. Phys. Chem. C, 2008, 112, 3789–3793 CrossRef CAS.
- M. Jin, H. Zhang, Z. Xie and Y. Xia, Energy Environ. Sci., 2012, 5, 6352–6357 RSC.
- N. Hoshi, K. Kida, M. Nakamura, M. Nakada and K. Osada, J. Phys. Chem. B, 2006, 110, 12480–12484 CrossRef CAS.
- Y. Shen, S. Zhang, F. Liao, J. Sun, Q. Dang, M. Shao and Z. Kang, ChemCatChem, 2020, 12, 504–509 CrossRef CAS.
- T. K. Sau and A. L. Rogach, Adv. Mater., 2010, 22, 1781–1804 CrossRef CAS.
- S. Guo and E. Wang, Nano Today, 2011, 6, 240–264 CrossRef CAS.
- S. Ghosh, N. a. Kouamé, L. Ramos, S. Remita, A. Dazzi, A. Deniset-Besseau, P. Beaunier, F. Goubard, P.-H. Aubert and H. Remita, Nat. Mater., 2015, 14, 505–511 CrossRef CAS.
- S. Dutt, P. F. Siril and S. Remita, RSC Adv., 2017, 7, 5733–5750 RSC.
- P. F. Siril, L. Ramos, P. Beaunier, P. Archirel, A. Etcheberry and H. Remita, Chem. Mater., 2009, 21, 5170–5175 CrossRef CAS.
- T. Redjala, G. Apostolecu, P. Beaunier, M. Mostafavi, A. Etcheberry, D. Uzio, C. Thomazeau and H. Remita, New J. Chem., 2008, 32, 1403 RSC.
- F. F. Ksar, G. Surendran, L. Ramos, B. Keita, L. Nadjo, E. Prouzet, P. Beaunier, A. Hagège, F. Audonnet, H. Remita, A. Hagège, F. Audonnet and H. Remita, Chem. Mater., 2009, 21, 1612–1617 CrossRef CAS.
- P. F. Siril, A. Lehoux, L. Ramos, P. Beaunier and H. Remita, New J. Chem., 2012, 36, 2135 RSC.
- M. Chawla, R. Kumar and P. F. Siril, J. Mol. Catal. A: Chem., 2016, 423, 126–134 CrossRef CAS.
- T. Vats, S. Dutt, R. Kumar and P. F. Siril, Sci. Rep., 2016, 6, 33053 CrossRef CAS.
- T. Vats and P. F. Siril, Sci. Data, 2017, 4, 170196 CrossRef CAS.
- S. Dutt and P. F. Siril, Mater. Lett., 2014, 124, 50–53 CrossRef CAS.
- S. Dutt, T. Vats and P. F. Siril, New J. Chem., 2018, 42, 5709–5719 RSC.
- E. P. Dos Santos, M. S. Tokumoto, G. Surendran, H. Remita, C. Bourgaux, P. Dieudonné, E. Prouzet and L. Ramos, Langmuir, 2005, 21, 4362–4369 CrossRef CAS.
- G. Surendran, L. Ramos, B. Pansu, E. Prouzet, P. Beaunier, F. Audonnet and H. Remita, Chem. Mater., 2007, 19, 5045–5048 CrossRef CAS.
- M. Shao, J. Odell, M. Humbert, T. Yu and Y. Xia, J. Phys. Chem. C, 2013, 117, 4172–4180 CrossRef CAS.
- P. F. Siril, L. Ramos, P. Beaunier, P. Archirel, A. Etcheberry and H. Remita, Chem. Mater., 2009, 21, 5170–5175 CrossRef CAS.
- L. Y. Zhang, Y. Ouyang, S. Wang, D. Wu, M. Jiang, F. Wang, W. Yuan and C. M. Li, Small, 2019, 15, 1904245 CrossRef CAS.
- M. S. Colla, B. Amin-Ahmadi, H. Idrissi, L. Malet, S. Godet, J. P. Raskin, D. Schryvers and T. Pardoen, Nat. Commun., 2015, 6, 2–9 Search PubMed.
- A. Kumar, M. M. Mohammadi and M. T. Swihart, Nanoscale, 2019, 11, 19058–19085 RSC.
- C. Sun, Z. Cao, J. Wang, L. Lin and X. Xie, New J. Chem., 2019, 43, 2567–2574 RSC.
- V. V. Kaichev, I. P. Prosvirin, V. I. Bukhtiyarov, H. Unterhalt, G. Rupprechter and H.-J. Freund, J. Phys. Chem. B, 2003, 107, 3522–3527 CrossRef CAS.
- X. M. Wang and Y. Y. Xia, Electrochim. Acta, 2009, 54, 7525–7530 CrossRef CAS.
- H. Conrad, G. Ertl and E. E. Latta, Surface Science, 1974, 41, 435–446 CrossRef.
- A. Zalineeva, S. Baranton, C. Coutanceau and G. Jerkiewicz, Langmuir, 2015, 31, 1605–1609 CrossRef CAS.
- T. Bhowmik, M. K. Kundu and S. Barman, ACS Catal., 2016, 6, 1929–1941 CrossRef CAS.
- X. Guo, L. Yang, B. Shen, Y. Wei, Y. Yang, C. Yang, Q. Jiang, H. He and H. Huang, Mater. Chem. Phys., 2020, 250, 123167 CrossRef CAS.
- W. Pan, X. Zhang, H. Ma and J. Zhang, J. Phys. Chem. C, 2008, 112, 2456–2461 CrossRef CAS.
- Z. Xi, J. Li, D. Su, M. Muzzio, C. Yu, Q. Li and S. Sun, J. Am. Chem. Soc., 2017, 139, 15191–15196 CrossRef CAS.
- Z. Xi, D. P. Erdosy, A. Mendoza-Garcia, P. N. Duchesne, J. Li, M. Muzzio, Q. Li, P. Zhang and S. Sun, Nano Lett., 2017, 17, 2727–2731 CrossRef CAS.
- M. Osawa, K. I. Komatsu, G. Samjeské, T. Uchida, T. Ikeshoji, A. Cuesta and C. Gutiérrez, Angew. Chem., Int. Ed., 2011, 50, 1159–1163 CrossRef CAS.
- P. Waszczuk, T. M. Barnard, C. Rice, R. I. Masel and A. Wieckowski, Electrochem. Commun., 2002, 4, 599–603 CrossRef CAS.
- Y. Chen, Y. Yang, G. Fu, L. Xu, D. Sun, J. M. Lee and Y. Tang, J. Mater. Chem. A, 2018, 6, 10632–10638 RSC.
- H. Yan, Y. Jiao, A. Wu, C. Tian, L. Wang, X. Zhang and H. Fu, J. Mater. Chem. A, 2018, 6, 7623–7630 RSC.
- D. Sun, L. Si, G. Fu, C. Liu, D. Sun, Y. Chen, Y. Tang and T. Lu, J. Power Sources, 2015, 280, 141–146 CrossRef CAS.
- F. Yang, Y. Zhang, P. F. Liu, Y. Cui, X. R. Ge and Q. S. Jing, Int. J. Hydrogen Energy, 2016, 41, 6773–6780 CrossRef CAS.
- D. Bin, B. Yang, F. Ren, K. Zhang, P. Yang and Y. Du, J. Mater. Chem. A, 2015, 3, 14001–14006 RSC.
- F. Zhu, G. Ma, Z. Bai, R. Hang, B. Tang, Z. Zhang and X. Wang, J. Power Sources, 2013, 242, 610–620 CrossRef CAS.
- X. Zhang, J. Zhu, C. S. Tiwary, Z. Ma, H. Huang, J. Zhang, Z. Lu, W. Huang and Y. Wu, ACS Appl. Mater. Interfaces, 2016, 8, 10858–10865 CrossRef CAS.
- H. Zhao, J. Yang, L. Wang, C. Tian, B. Jiang and H. Fu, Chem. Commun., 2011, 47, 2014–2016 RSC.
- X. Qiu, H. Zhang, P. Wu, F. Zhang, S. Wei, D. Sun, L. Xu and Y. Tang, Adv. Funct. Mater., 2017, 27, 1603852–1603861 CrossRef.
- X. Yan, X. Hu, G. Fu, L. Xu, J. M. Lee and Y. Tang, Small, 2018, 14, 1–8 Search PubMed.
- L. Y. Zhang, Z. L. Zhao, W. Yuan and C. M. Li, Nanoscale, 2016, 8, 1905–1909 RSC.
- L. Y. Zhang and Z. Liu, J. Colloid Interface Sci., 2017, 505, 783–788 CrossRef CAS.
- M. Yin, Q. Li, J. O. Jensen, Y. Huang, L. N. Cleemann, N. J. Bjerrum and W. Xing, J. Power Sources, 2012, 219, 106–111 CrossRef CAS.
Footnote |
| † Electronic supplementary information (ESI) available: Particle size distribution, SAED patterns of the Pd nanostructures, XPS survey scan of Pd0D, Pd1D and Pd2D nanostructures, high resolution XPS spectra of C 1s of Pd0D, Pd1D and Pd2D nanostructures, backward scan for the FAOR of all catalysts and Nyquist plots of the three Pd nanostructures. See DOI: 10.1039/d0na00798f |
| This journal is © The Royal Society of Chemistry 2020 |


