
 Open Access Article
 This Open Access Article is licensed under a Creative Commons Attribution-Non Commercial 3.0 Unported Licence
Recent advances in environmentally benign hierarchical inorganic nano-adsorbents for the removal of poisonous metal ions in water: a review with mechanistic insight into toxicity and adsorption
Manjunatha
Channegowda
 *ab
*ab
aDepartment of Chemistry, RV College of Engineering, Bengaluru-560 059, Karnataka, India. E-mail: manjunathac@rvce.edu.in; manju.chem20@gmail.com; Tel: +91 9036651277
bVisvesvaraya Technological University, Belagavi-590018, India
First published on 16th October 2020
Abstract
Recent developments in nanoscience and technology have addressed many of the problems associated with water quality. Accordingly, using the technological outputs of the recent research on nanomaterials, the best solution for the purification of water is highlighted in this review. Herein, the main objective is to provide mechanistic insight into the synthesis of various inorganic nanoadsorbents and their adsorption chemistry for poisonous metal ions present in polluted water. Initially, the toxicity and carcinogenicity of As3+, Pb2+, Cr6+, Cd2+, and Hg2+ metal ions are highlighted. For the removal of these toxic ions, this review focuses on eco-friendly nanoadsorbents. The various preparation procedures utilized for the preparation of nanoadsorbents are briefly discussed. Generally, this is because of the adsorption capacity of nanoadsorbents depends on their morphology, shape, size, surface area, surface active sites, functional groups, and quantization effect. Also, due to the importance of their mechanism of action, the recent developments and challenges of novel nanoadsorbents such as metal oxides, core shell nanoparticles, magnetic nano ferrates, and functionalized core shell magnetic oxides and the processes for the treatment of water contaminated by toxic metal ions such as As3+, Pb2+, Cr6+, Cd2+, and Hg2+ are exclusively reviewed. Further, the adsorption efficiency of inorganic nanoadsorbents is also compared with that of activated carbon derived from various sources for all the above-mentioned metal ions.
 Manjunatha C. | Dr Manjunatha C., is currently an Assistant Professor in the Department of Chemistry, RV College of Engineering, Bengaluru, and recognized PhD Supervisor from Visvesvaraya Technological University (VTU), India. He obtained his M.Sc. in Inorganic Chemistry from the Department of Chemistry, Central College Campus, Bangalore University in 2004 and PhD in the Faculty of Science-Applied Chemistry, from VTU in 2013. His research interests include inorganic nanomaterial chemistry, surface and colloidal chemistry and electrochemistry, with a focus on the design and synthesis of differently shaped functional inorganic materials and their applications in energy storage and conversion, photocatalysis, water purification, phosphors, sensors and nanomedicine. |
1. Introduction
Pure water, free from toxic compounds and pathogens, is crucial to the health of living beings, and is also essential in many industries.1–3 Unfortunately, society has been exposed to limitless toxic chemicals, polluted water, and hybridized and genetically reformed foods.4 Impure water containing toxic pollutants from many industries, including the chemical, pharmaceutical, battery, metallurgical, leather, and mining industries,5,6 is discharged into natural water resources, although it poses a threat to living organisms.7,8The presence of heavy metal ions (specific density >5 g cm−3) in water has been found to have deleterious effect on living organisms.9–11 Among the various water contaminants, the most frequently present and hazardous toxic metals include arsenic (As3+), lead (Pb2+), chromium (Cr6+), cadmium (Cd2+), and mercury (Hg2+).12,13 These toxic metal ions induce toxicity to cells and make them malfunction by replacing the healthy metal ions present in their protein binding sites. There are several reports that confirm that these toxic heavy metal ions cause oxidative deterioration of biological macromolecules by binding to DNA.14,15
Therefore, it is urgent to develop suitable techniques to efficiently remove toxic metal ions from polluted water. Among the various available techniques, the adsorption approach has been proven to be the most effective method for the removal of metal ions. The engineered nanomaterials used as adsorbents in this technique should possess a high surface area, tuneable morphology, and good chemical and thermal stability.16 Hierarchical inorganic nanostructures are favourable for metal ion adsorption since they possess a high surface area, numerous adsorption sites, adjustable chemical compositions and organized hierarchical porosity on different scales.17–20
Among the various inorganic nanoadsorbents, functionalised nanomaterials such as MgO, Fe3O4, Al2O3, MnO2, TiO2, ZnO, CeO2, CuS, and NiP and their core shell nanocomposites have been proven to be very efficient for the adsorption of toxic metal ions.21–26 Researchers have exhibited more interest in magnetic metal oxides than regular nanoscale metal oxides because they can be easily extracted from water under a magnetic field, and thus easily recycled.27,28 Accordingly, the use of these magnetic adsorbents is essential to reduce the cost and improve the adsorption efficiency for the treatment of wastewater.
This review aims to provide an overview about the importance of removing toxic metal ions, particularly As3+, Pb2+, Cr6+, Cd2+, and Hg2+, and highlight their toxicity and carcinogenicity with their mechanisms. For the removal of these toxic metal ions, hierarchically structured inorganic nanoadsorbents with an eco-friendly nature and high surface area developed by various research groups are carefully selected, and their synthesis and adsorption mechanism are systematically discussed. The inorganic nanoadsorbents covered herein all possess hierarchical morphologies such as flowers, tubes, rods, spheres, and core–shell structures. The surface area and active sites of these structures are generally higher than plane/normal structures, and hence their adsorption efficiency is also higher. However, in this review, it is not the aim to provide in-depth information as presented in other review articles, instead the goal is to provide a compendium of this interesting research area using a finite number of examples, focussing on mechanistic aspects. Therefore, some of the important topics, such as nano-assisted bio-remediation, ion-exchange, metal ion sensors, and microbial fuel cells, although interesting, are not covered in this work. In this review article, a brief view on several typical important hierarchically inorganic nanoadsorbents with high surface areas are discussed, including their morphological characterization, adsorption behavior with respect to As3+, Pb2+, Cr6+, Cd2+, and Hg2+ in water systems under different experimental conditions, necessary adsorption mechanism, and their recyclability.
2. Toxicity and its mechanism
The severity of the toxicity of all the above-mentioned metal ions is presented in Fig. 1. The exposure of the skin to significant levels of arsenic has been reported to cause skin cancer, as shown in Fig. 1(a).29 The toxic effects of lead, as shown in Fig. 1(b), mainly include neurocognitive, cardiovascular and psychiatric problems.30 Chromium Cr(VI) is very toxic, and causes lung cancer, nasal irritation, nasal ulcers, and contact dermatitis, as shown Fig. 1(c). Excessive exposure to cadmium causes bone demineralization (Fig. 1(d)), impairs lung function and increases the risk of lung cancer. Acute exposure to both inorganic and organic mercury causes damage to the gastrointestinal tract, nervous system (Fig. 1(e)), lungs, kidneys, and digestive and immune systems.31–33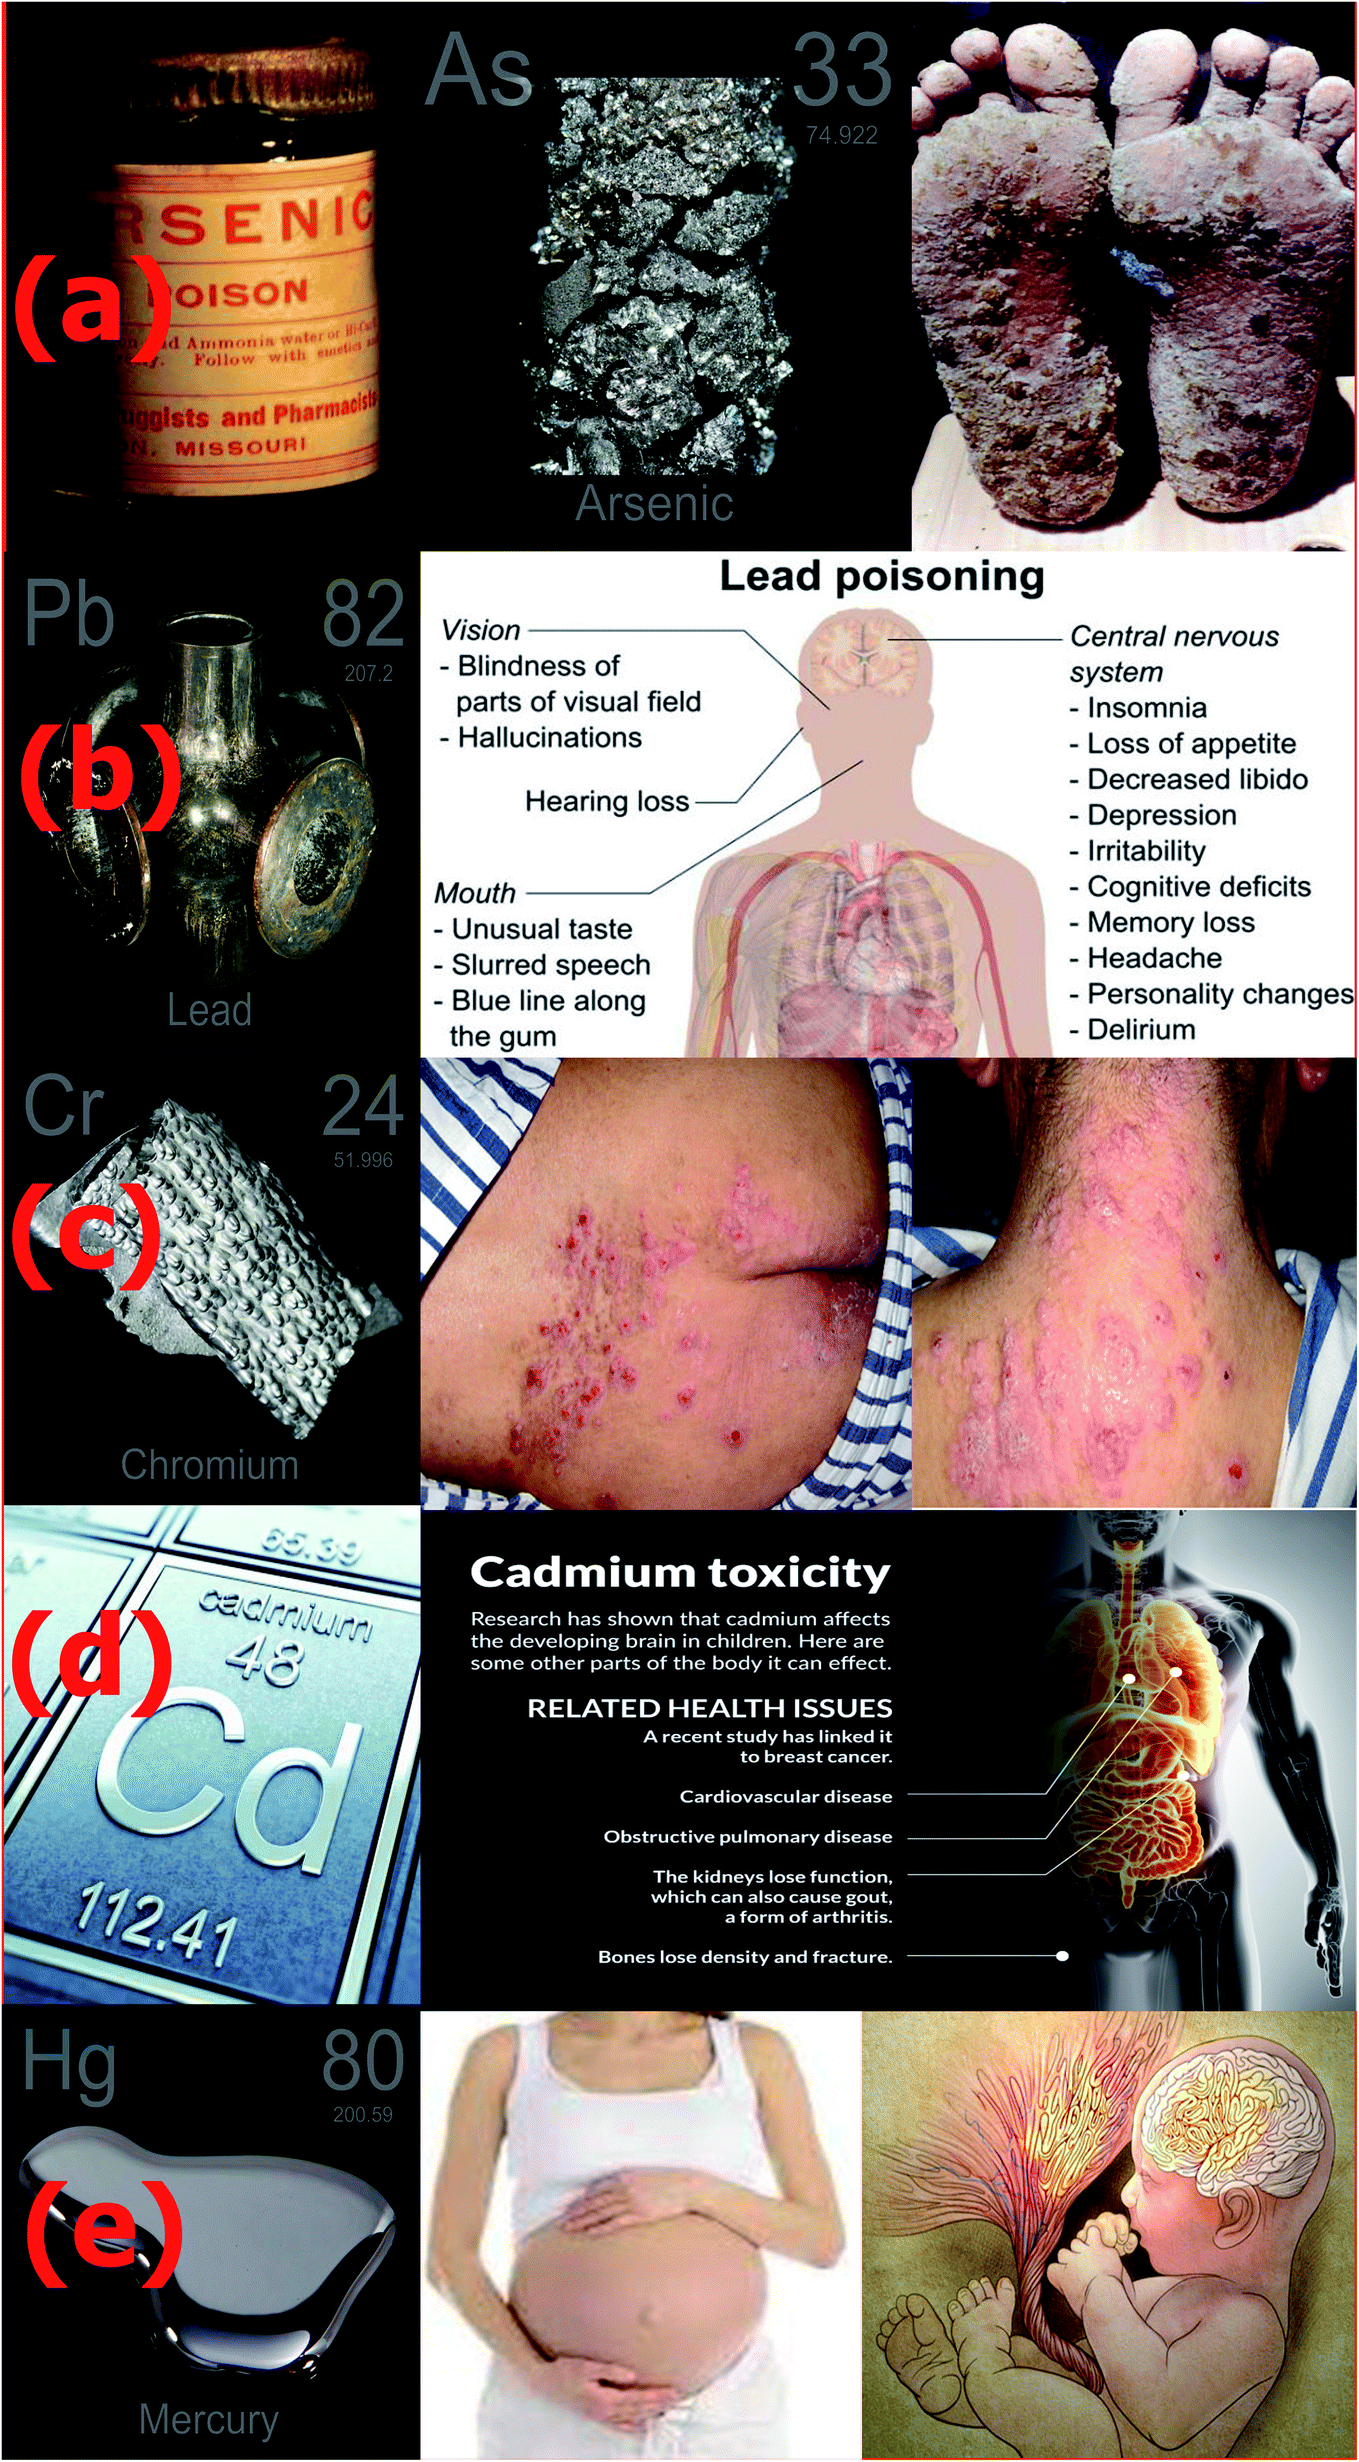 | ||
| Fig. 1 Representative images of toxic metal ions and their health hazards. (a) Arsenic, (b) lead, (c) chromium, (d) cadmium and (e) mercury (ref. 34–42). | ||
2.1. Arsenic: mechanism of its toxicity and carcinogenicity
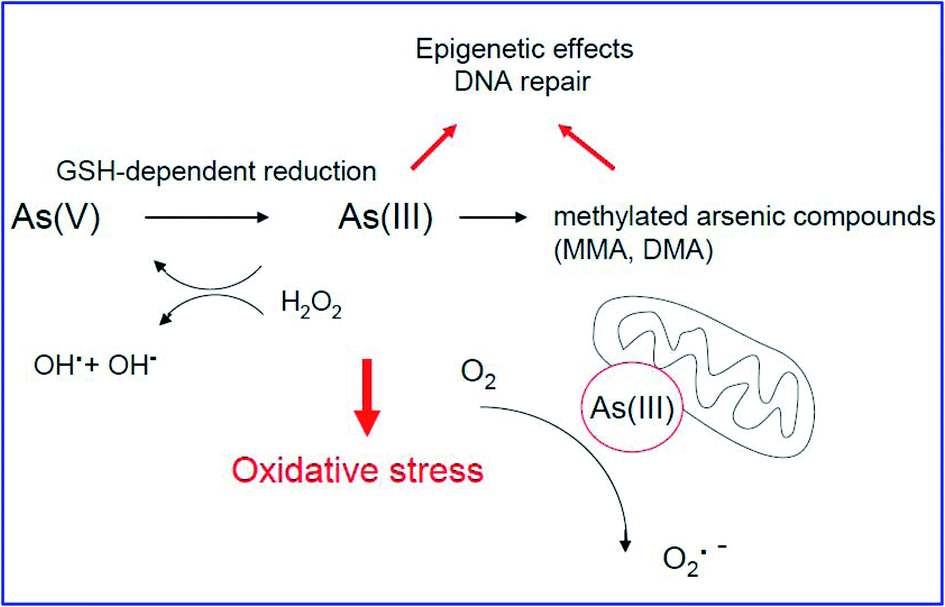
The toxic nature of arsenic (As) is mainly associated with the effects of trivalent arsenite [As(III)] and pentavalent arsenate [As(V)]. As(III) can deactivate over 200 enzymes by linking covalently to the thiol and sulfhydryl groups of proteins.43–45 As(III) inhibits various cellular enzymes such as pyruvate dehydrogenase by reducing pyruvate to acetyl coenzyme A (CoA).46 In addition, it also stops the synthesis of one of the most powerful cellular antioxidants, glutathione (GSH). The toxicity of As(V) occurs via its reduction to As(III),47 which replaces the phosphate ion in glycolytic and cellular respiration.48–50 During the biotransformation of arsenic, inorganic arsenic species (iAs) are converted enzymatically into monomethylarsonic acid (MMA) and dimethylarsinic acid (DMA)51 by bacteria, algae, fungi and humans, as shown in Fig. 2.| iAs(V) → iAs(III) → MMA(V) → MMA(III) → DMA(V) |
 | ||
| Fig. 2 Typical mechanism of arsenic carcinogenicity (ref. 54). | ||
During the above detoxification process, end-products such as MMA(V) and DMA(V) are expelled through the urine. However, MMA(III) remains inside the cell as an intermediate product, which is responsible for arsenic-induced carcinogenesis.52
Fig. 2 represents the typical carcinogenic mechanisms of arsenic compounds. Their carcinogenesis is due to the induction of oxidative stress by ROS species.53 The structural changes in the mitochondrion by arsenic inactivates the mitochondrial enzymes, resulting in the loss of the mitochondrial membrane potential. It is also predicted that the reduction of O2 by As(III) liberates H2O2 and/or arsenic peroxyl radicals, causing DNA damage, as shown in Fig. 2.
2.2. Lead: mechanism of its toxicity and carcinogenicity
Recent articles on the effects of lead show that it severely affects the nervous system, causing multiple neurological disorders such as nerve damage, learning and developmental disabilities, behavioral problems, brain damage, and perhaps Parkinson's disease, schizophrenia, and Alzheimer's disease.55–58 Together with brain damage, lead also induces kidney damage, gastrointestinal diseases, high blood pressure, and vitamin D metabolism.59 The toxicity mechanisms of lead are because it mimics the actions of metal ions and interacts with proteins. By substituting the essential divalent cations (Ca2+, Fe2+, and Mg2+) and also by binding to the sulfhydryl (–SH) and amide groups (–CONH2) of enzymes, lead modifies their configuration and weakens their activities, resulting in malfunction of the host protein. Recent findings on apoptosis in human cancer cells by lead exposure demonstrated that it is caused by oxidative stress-activated cellular and molecular reactions,14 transcriptional activation of stress genes,60 DNA damage,61 externalization of phosphatidylserine, and activation of caspase 3.622.3. Chromium: mechanism of its toxicity and carcinogenicity
The highly mobile Cr(VI) ion is considered to be one of the most toxic heavy metal ions. The chronic consumption of Cr(VI) compounds damages the lungs and nasal passage, and causes sinus cancer, severe dermatitis, severe liver abnormalities, etc. As reported by IARC, Cr(VI) compounds (e.g., CrO42−) are similar to sulfate and phosphate, and thus can easily be substituted by cells via the anionic transport system. The negatively charged CrO42− can easily pass through the anionic channels in cellular membranes, and then undergo reduction to Cr(III) ions. These ions cross-link DNA and proteins, glutathione, ascorbate, etc. The formation of ROS, especially hydroxyl free radicals, is shown in Fig. 3. As shown in Fig. 3, the reduction of Cr(VI) produces glutathione-thiyl radicals, which63 further reduce O2 to O2˙− radicals. Further, Cr(IV) and Cr(III) in the intermediate steps undergo Fenton-type reactions, which generate hydroxyl free radicals (˙OH). The experiments conducted by Ye and co-workers64 confirmed that the generation of ˙OH in cells by Cr(VI) causes severe cytotoxicity. Their study mainly confirmed that the formation of DNA adducts by chromium is the main cause for carcinogenesis.65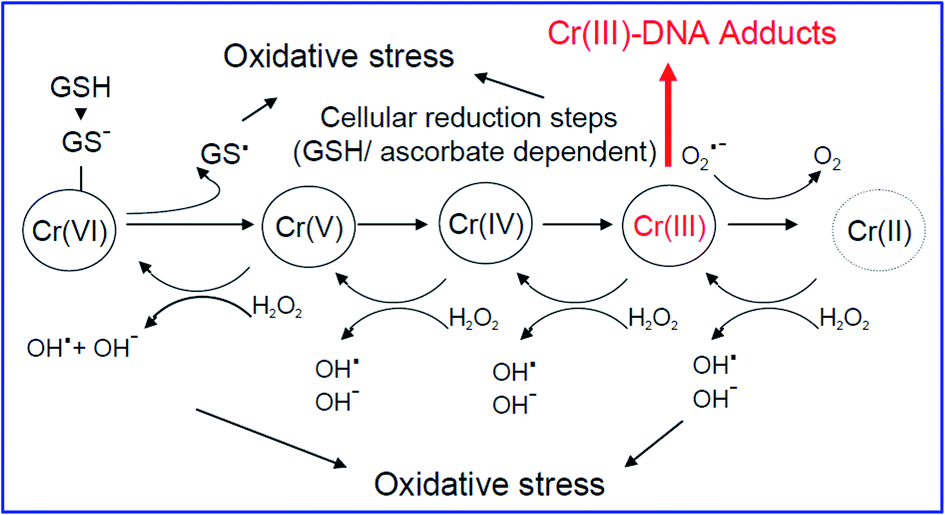 | ||
| Fig. 3 Typical mechanism of chromium carcinogenicity (ref. 54). | ||
2.4. Cadmium: mechanism of its toxicity and carcinogenicity
Cadmium, Cd(II), which has a biological half-life of 30 years, is stored in the liver and kidney, and causes acute tumours in the lungs and kidneys.66 Since Cd(II) has a stable oxidation state of +2 (redox-inactive), it can replace Fe2+ and Cu2+ ions from the intracellular depots of ferritin and apo ferritin,67 inducing oxidative stress, as shown in Fig. 4. Also, it causes a deficiency in iron by binding with glutamate, cysteine, aspartate and histidine ligands. Furthermore, Zn2+, which is present in metallothionein, can also be replaced by Cd2+ because they have the same oxidation state, thus hindering it from acting as a free radical scavenger within the cell.68 As presented in Fig. 4, cadmium helps in the generation of ROS by inhibiting complex III of the mitochondrial respiratory chain, which further leads to the accumulation of semiubiquinones and the formation of O2˙− radicals. It also indirectly triggers oxidative stress by obstructing the communication between SOD and catalase, which are antioxidant enzymes,69 thereby increasing the levels of O2˙− and H2O2, and subsequent lipid peroxidation.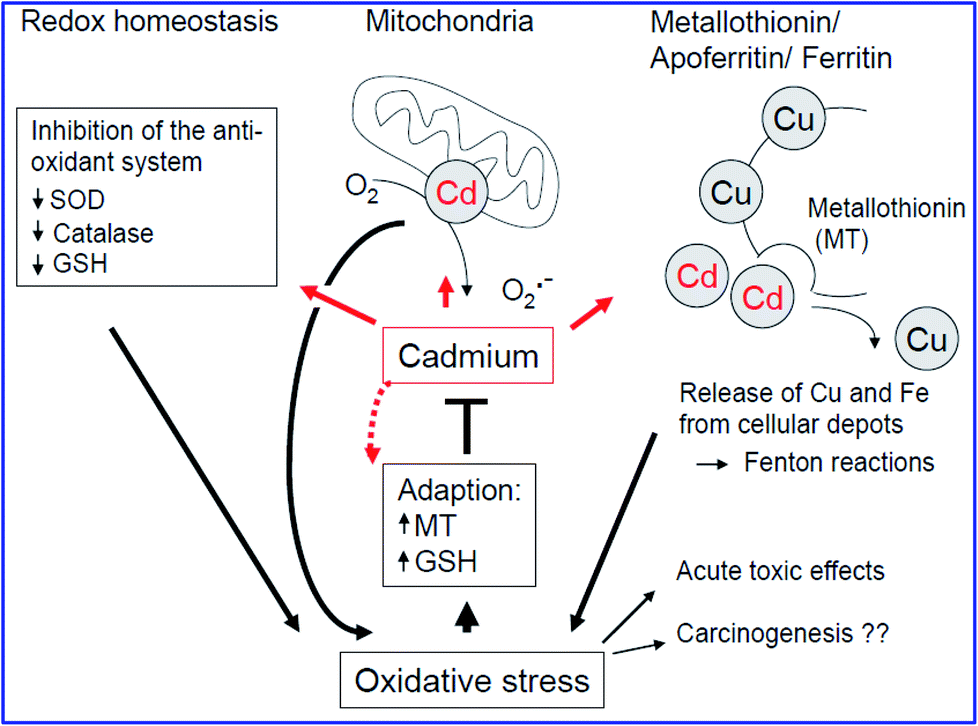 | ||
| Fig. 4 Typical mechanism of cadmium carcinogenicity (ref. 54). | ||
2.5. Mercury: mechanism of its toxicity and carcinogenicity
Various studies have shown that the cytotoxic effect of Hg2+ is linked to cellular oxidative stress.70–72 It is believed that the cytotoxicity of Hg2+ is due to its ability to covalently bond with thiols and selenols, which further decreases the thiol and selenol-based antioxidant buffers (glutathione) in cells. It also changes the redox state of the sulphydrilic lateral chain of cysteines of several enzymes.73–75 Because of these chemical modifications, the balance between the production and scavenging of ROS is disturbed. This is one of the reasons for mercury ion toxicity. The selenol group (–Se–H) group present in several antioxidant enzymes such as glutathione peroxidases and thioredoxin reductase mainly exists in the dissociated nucleophilic form (–Se−).76 The selenol group (–Se–H) is more nucleophilic and shows much higher reactivity toward Hg2+ than the –SH group, as shown in Fig. 5. Therefore, Hg2+ inactivates the enzymes by binding to the selenol (–Se−) group present in the catalytic seleno-cysteine residue of thioredoxin reductase and glutathione peroxidase. In the catalytic cycle, as shown in Fig. 5, glutathione peroxidase converts H2O2 in to 2H2O and two reduced glutathione molecules (GSH) into their oxidized form (GSSG). Similarly, thioredoxin reductase reduces the oxidized thioredoxin (Txr) by simultaneously reacting with NADPH. At the expense of mitochondria, the reduced Txr helps to retain the redox state of protein cysteines (P) from H2O2-mediated oxidation. With the help of the mitochondrial isoform of SOD2, O2˙− is further converted into H2O2. In this way, Hg2+ constrains the activity of selenoproteins.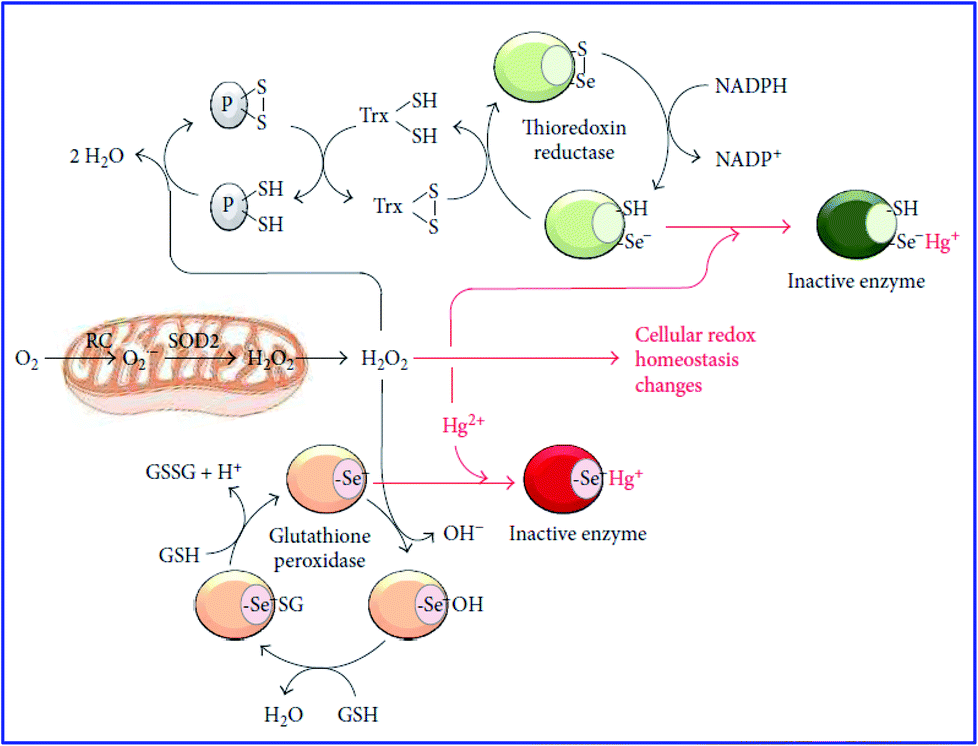 | ||
| Fig. 5 Typical mechanism of mercury carcinogenicity (ref. 77). | ||
3. Adsorption process and removal mechanism of toxic metal ions
3.1 Absorption and adsorption
Absorption is the bulk phenomenon in which one substance (absorbate) in the gaseous, liquid or solid form enters the volume (bulk) of another substance (absorbent), specifically, a solid. It is an endothermic process, in which the absorbed substance remains intact in the absorbent due to the presence of empty space, but they do not have any chemical interaction with each other. However, once the absorbent is absorbed, it cannot be separated easily. In contrast, the adsorption process in exothermic in nature, which occurs on the surface of a substrate (adsorbent), where the adsorbates (gas, liquids or solids) loosely stick to the surface of the adsorbent (solid or liquid) through physical or chemical interaction. Generally, absorption occurs at the macroscopic scale and adsorption at the nanoscopic scale.3.2 Adsorption phenomena and isotherms
Adsorption is a surface phenomenon, in which the adsorbate (in gas/liquid/molecular form or ionic form) binds to the adsorbent (solid) surface.78 The adsorption of molecules can take place in two ways, i.e. “physisorption” and “chemisorption”.79,80 In physisorption, the molecules or ions adsorb on the adsorbate via weak electrostatic interactions and van der Waals forces. However, in the case of chemisorption, the adsorbates are attached to the adsorbent surface via strong chemical bonds.81 In this review, we mainly discuss adsorption related to water treatment, which involves liquid–solid adsorption systems. Here, the metal ions present in the water act as the adsorbate and are adsorbed on the surface of nanoadsorbents, which are in the solid state. The type of interaction between the adsorbent (solid) and adsorbate (metal ions) in liquid medium depends on the surface properties of both of them. If physical forces hold both the adsorbent and adsorbate together, then the adsorption can be multilayer and reversible. However, if they are held by chemical bonds, then the adsorption occurs only as monolayer and is irreversible. It has been observed that under favorable experimental conditions, both physisorption and chemisorption processes can occur simultaneously or independently. Physisorption is exothermic and results in a decrease in the free energy and entropy of the adsorption system. The adsorption mechanism of toxic metal ions by inorganic nanoadsorbents can be explained in two ways. The first mechanism involves the formation of chemical bonds between heavy metal ions and the functional hydroxyl/amino/thiol group on the surface of the nanoadsorbent, forming inner complexes.82,83 Secondly, via the electrostatic attraction between heavy metals and the negatively charged –O− groups on the surface, forming outer complexes.84,85In the water purification process, adsorption results in the removal of metal ions from solution and their accumulation at the solid surface of nanoadsorbents. When adsorption reaches the maximum, the metal ions remaining in the solution reaches a dynamic equilibrium with the nanoadsorbent. The rate at which equilibrium is achieved depends on many parameters such as the surface area of the adsorbent, active sites, surface charge density of metal ions, pH, temperature and concentration of the adsorbate.86,87
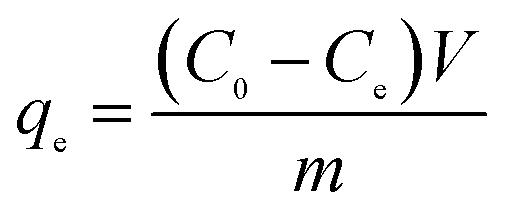
In the case of the adsorption of toxic metal ions in contaminated water, solutions with different concentrations of toxic metal ions are prepared, while maintaining the required pH. Then, a fixed quantity (e.g. 5 mg and 10 mg) of the adsorbent sample is added to a known volume (e.g. 10 mL and 15 mL) of toxic metal ion solution under constant stirring. After stirring for some time, the solid adsorbents are extracted from the solution and the residual concentrations of toxic metal ions are analyzed via UV-visible absorption spectral analysis or inductively coupled plasma-optical emission spectroscopy (ICP-OES) and compared with the initial metal ion concentrations. The adsorption isotherm can be recorded by changing the initial toxic metal ion concentration and stirring for a fixed duration at 25 °C. Using eqn (1), the value of ‘qe’ (equilibrium adsorption efficiency in mg g−1) can be calculated.
 | (1) |
For the rate of the adsorption in a liquid medium involving a solid adsorbent, the rate law can be determined using the slowest steps among the following:
(a) Transportation of the metal ions from the bulk of the solution to the solid adsorbent via liquid medium.
(b) Diffusion of metal ions across the liquid medium surrounding the nanoadsorbent particles to the bare adsorbent surface.
(c) Diffusion of metal ions across the liquid medium into the pores of the adsorbent via intraparticle diffusion.
(d) Adsorption of the metal ions on the adsorbent surface either by surface reaction or physical processes.
(e) Desorption of the metal ions from the solid adsorbent surface (in the case of reversible adsorption).
In most cases, the overall rate of adsorption is controlled by the slowest among the above. However, for some complex systems, the rate of adsorption depends on the combination of two or more steps among those listed above. To understand the adsorption rate and mechanism, various types of isotherm models have been used over the years, some with firm theoretical foundation, while others are empirical in nature. Among them, two models, namely the Freundlich and Langmuir models, are mostly followed for the adsorption of heavy metals in water, as presented in this review.88 The Langmuir adsorption model can be demonstrated by the following equation. This model assumes that the adsorption sites in an adsorbent are finite and have equal energy, and there is no transmigration of the adsorbate in the plane of the surface, resulting in monolayer adsorption. The adsorption data is analysed according to the linear form of the Langmuir isotherm as follows (eqn (2)):
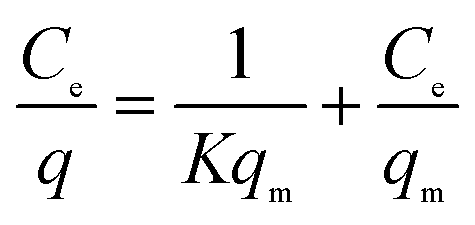 | (2) |
The Freundlich isotherm is considered to be multilayer, nonideal, reversible adsorption at a heterogeneous surface with all its adsorption sites possessing different binding energies.88 Thus, the adsorbent surface has a spectrum of different binding energies, rather than one uniform energy. The Freundlich equation is commonly presented as (eqn (3)):
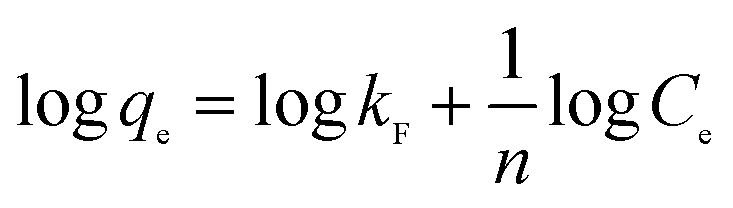 | (3) |
3.3 Categories of nanoadsorbents
Commonly used nanoadsorbents are classified based on their chemical composition and their functionalisation, which make their surface adsorption sites behave completely different. The nanoadsorbents are classified as follows.(a) Metallic nanoadsorbents: various nanostructured and functionalised gold NPs, silver NPs, copper NPs, nickel NPs, platinum NPs, and palladium NPs.
(b) Metal oxide nanoadsorbents: various nanostructured and functionalised ZnO, MgO, CaO, TiO2, CuO, SnO2, NiO, MnO2, etc.
(c) Magnetic nanoadsorbents: various nanostructured and functionalised Fe2O3, Fe3O4, Co3O4, NiO2, ferrates of cobalt (CoFe2O4), nickel (NiFe2O4), manganese (MnFe2O4), zinc (ZnFe2O4), and copper (CuFe2O4); manganese compounds; core–shell structure; etc.
(d) Metal chalcogenide nanoadsorbents: various nanostructured and functionalised MoS2, WS2, MoSe2, WSe2, CuS, CuSe, MnS, MnSe, CoS, NiS, FeS, Fe2S3, etc.
(e) Carbonaceous nanomaterials (CNMs): carbon nanotubes (CNTs), carbon nanoparticles (CNPs), graphene and their functionalised materials.
(f) Silicon nanomaterials (SiNMs): silicon nanotubes (SiNTs), silicon nanoparticles (SiNPs), and silicon nanosheets (SiNSs).
4. Inorganic nano-architectures for the removal of toxic metal ions from water
4.1 Inorganic nano-architectures for the removal of arsenic ions
Arsenic (As) is a highly toxic and carcinogenic metal ion, and thus its presence in water can cause a major threat to the ecosystem and human beings. It is found in two main forms, As(III) and As(V), of which, As(III) is more toxic due to its high affinity to the thiols (–SH) sites of proteins in the human body.89 The IARC and EU categorize arsenic and its compounds (As2O3, As2O5 and arsenate salts) as group 1 carcinogens. These carcinogenic arsenic compounds were removed from water via a simple adsorption method using potential micro/nano-structures adsorbents, which possessed a very high surface area with unique hierarchical structures, by several research groups. Shuliang Yang et al.90 developed hierarchical microspheres of MgO, which effectively captured As(III) ions from water. The hierarchical flower-like MgO hollow microspheres with a high surface area were prepared via the calcination of magnesium glycolate precursors at 500 °C for 2 h in air. As shown in Fig. 6(a) and (b), the SEM and TEM images confirm the flower-like morphology of MgO with a hollow structure. For the adsorption studies, arsenate solutions of different concentrations were prepared using Na2HAsO4·7H2O and the pH was adjusted to 7. The adsorption experiments were conducted for different arsenate concentrations at room temperature using 8 mg of flower-like MgO adsorbent with stirring for 12 h. After stirring, the upper solution was extracted, and the concentration of arsenate was analyzed via inductively coupled plasma-atomic emission spectroscopy (ICP-AES). The adsorption kinetics was studied by using the Langmuir model, where each adsorption site on the surface had identical binding sites, and thus was described as monolayer adsorption. The adsorption efficiency with respect to As(V) ions for the flower-like MgO hollow spheres was compared with that of commercial MgO, as displayed in Fig. 6(c). The results confirmed that the adsorption rate of the flower-like MgO hollow spheres (569.7 mg g−1) was 7.6 times of higher than that of the commercial MgO, as presented in Fig. 6(d). This value is considered to be the highest among the reported MgO and other nanoadsorbents.90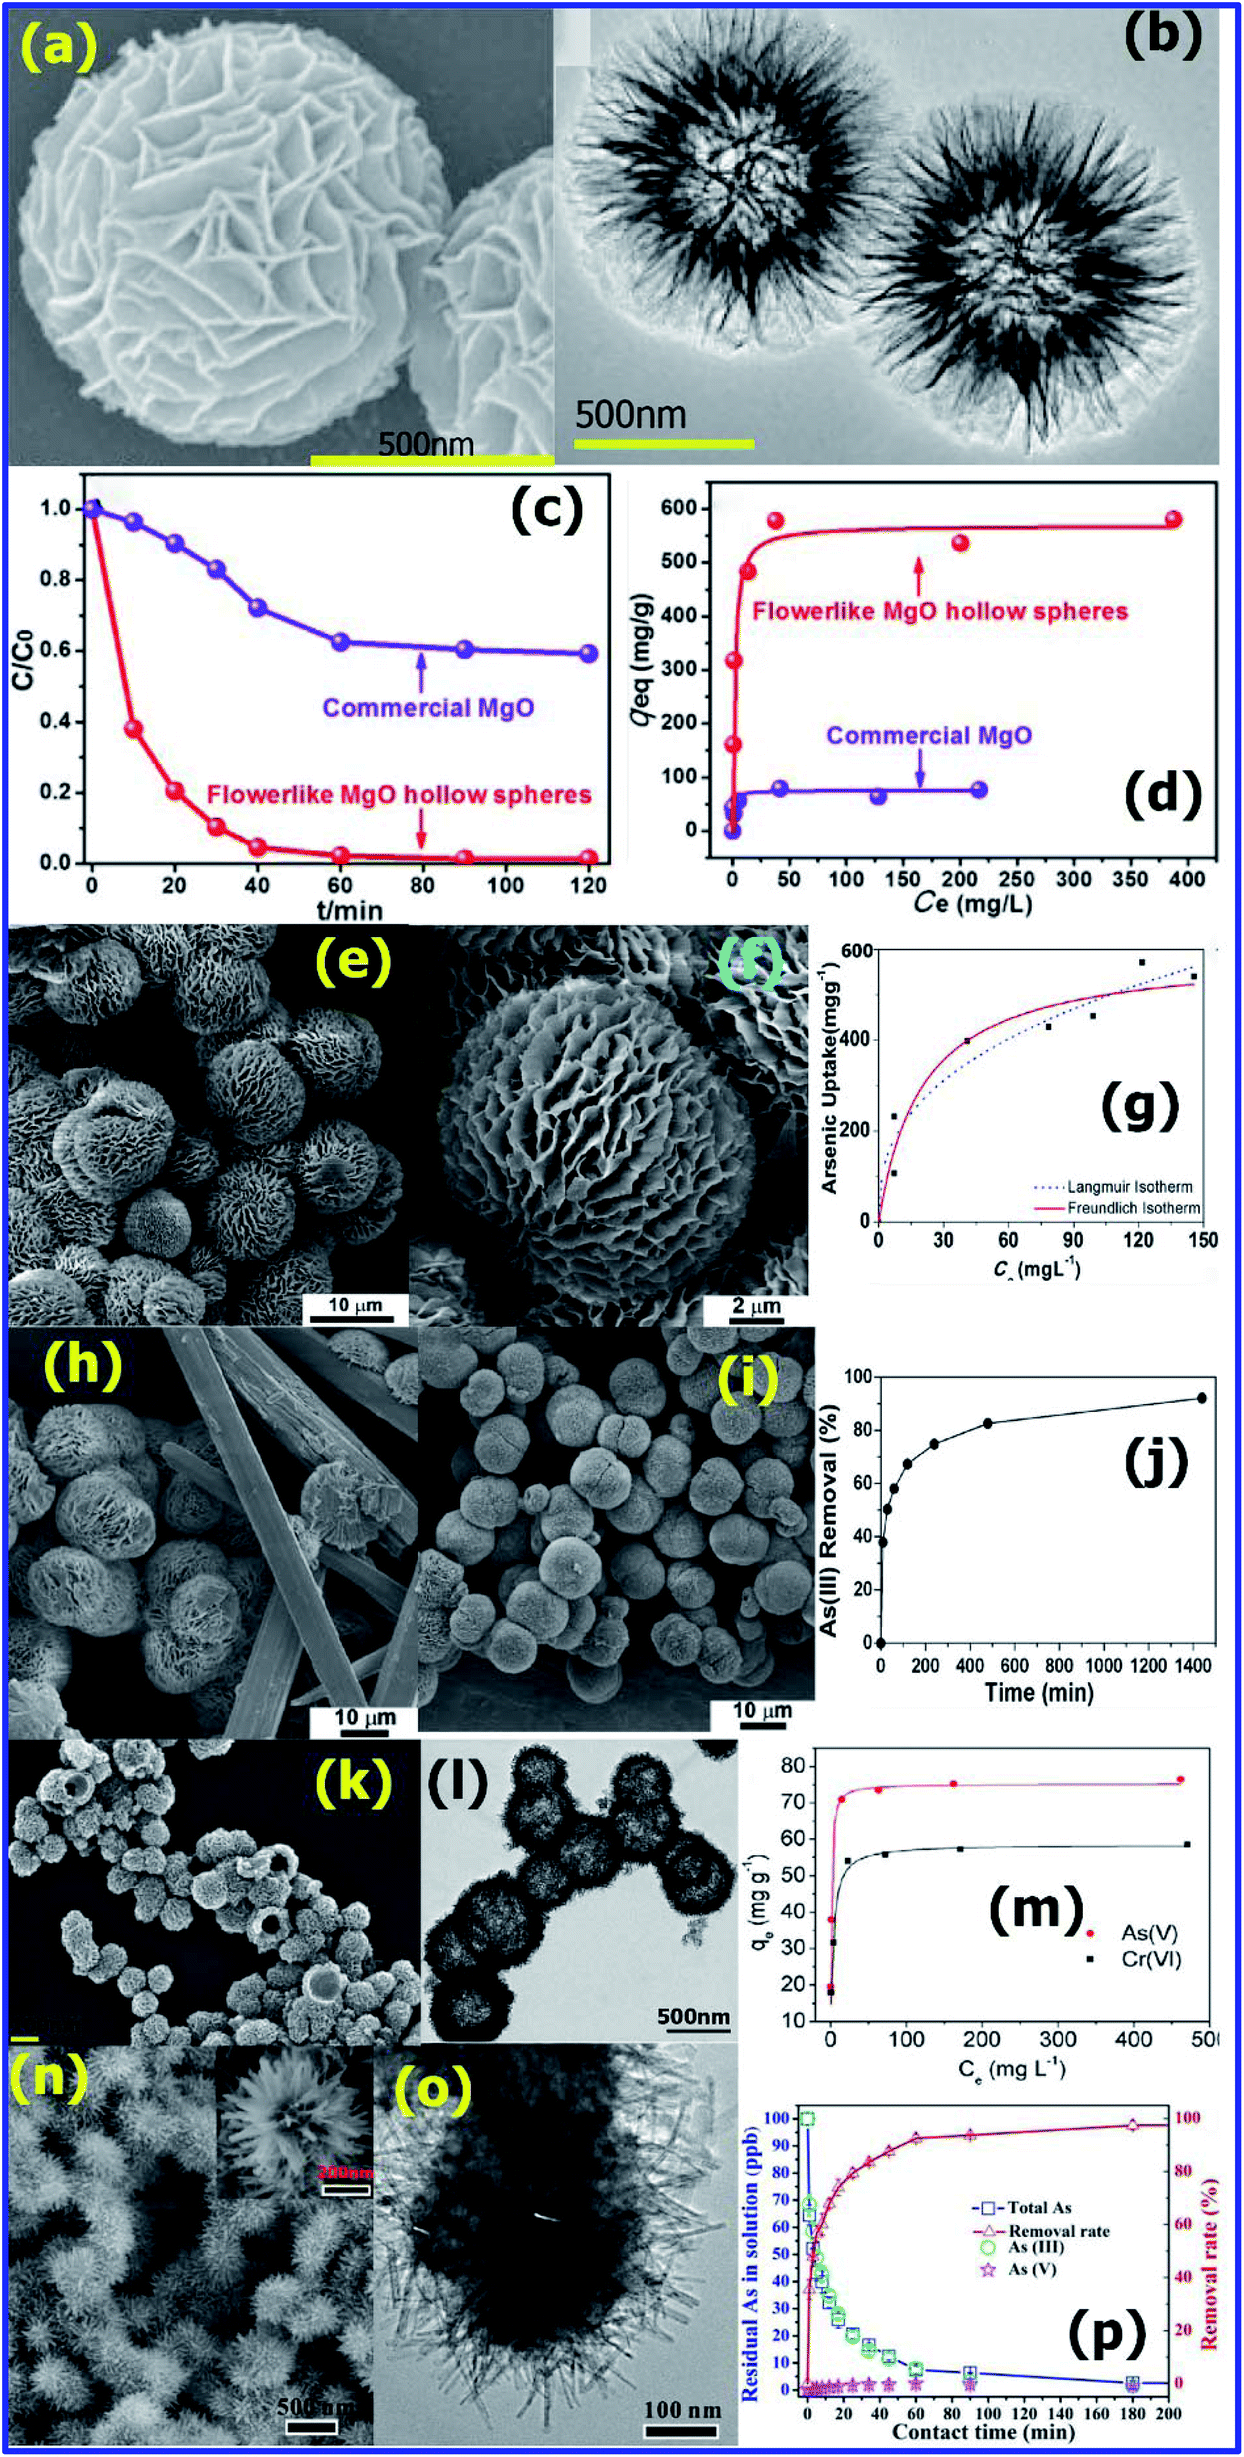 | ||
| Fig. 6 (a) SEM and (b) TEM images of flower-like MgO hollow spheres. (c) Adsorption rates and (d) adsorption isotherm curves of As(V) adsorption on the flower-like MgO hollow spheres (red line) and commercial MgO (violet line). (Reprinted with permission from [ref. 90] Copyright © (2016) the Royal Society of Chemistry.) (e and f) SEM images of MgO-500 and MgO–500 prepared at different aging temperatures (g) 60 °C and (h) 70 °C. (i) As(III) adsorption isotherm, (j) arsenic removal percentage, (Reprinted with permission from [ref. 91] Copyright © (2015) the American Chemical Society) (k) FESEM image and (l) TEM image of as-prepared hollow nest-like α-Fe2O3 nanostructures. (m) Adsorption isotherms of As(V) and Cr(VI) using the hollow nest like α-Fe2O3 nanostructures. (Reprinted with permission from [ref. 92 Copyright © (2013) the American Chemical Society.) (n) SEM (inset: magnified image) and (o) TEM of FeMnxOy@FeOOH. (p) Residual As (total As, As(III), and As(V)) concentration in solution and its removal rate by FeMnxOy@FeOOH. (Reprinted with permission from [ref. 93] Copyright © (2018) the American Chemical Society.) | ||
Similarly, Swasmi Purwajanti et al.91 prepared hierarchical MgO spheres with a uniform size of 10 μm via a precipitation-aging calcination procedure (Fig. 6(e)). It was found that the MgO microspheres were actually constituted by a large number of nano-scale sheets (Fig. 6(f)). Their experimental studies confirmed that the aging temperature played a major role in obtaining the hierarchical MgO microspheres. At 60 °C, they obtained both micro-scale rods and spheres (Fig. 6(f)), and at a temperature above 70 °C, only micro-size spheres made up of nano-scale sheets were obtained (Fig. 6(g) and (h)). The MgO microspheres calcined at different temperatures were used for the adsorption of As(III) ions in water. For effective adsorption results, 20 mg of MgO was dispersed in 50 mL of As(III) solution (different concentrations ranging from 50 to 400 ppm) and stirred for 24 h at 200 rpm. After the stirring was complete, the adsorbent was extracted by centrifugation and the remaining As(III) in the extracted solution was analyzed via ICP-OES. For the solution containing an As(III) concentration of 400 ppm, the MgO microspheres calcined at 400 °C (labelled as MgO-400), possessed an adsorption capacity of about 545 mg g−1, which was highest value recorded. However, the MgO microspheres calcined at 700 °C (MgO-700), only possessed an adsorption capacity of 148 mg g−1. This confirmed that the calcination temperature plays a major role in the adsorption capacity for As(III).91
Furthermore, compared with other nano metal oxides and commercially available arsenic adsorbents, the MgO microspheres reported in this work shows a higher adsorption efficiency for As(III). According to Fig. 6(i), it was observed that with an increase in C0 or Ce, the As(III) adsorption by the MgO-400 adsorbent also increased. Using the Langmuir adsorption isotherm, qmax and KL were calculated to be 595 mg g−1 and 0.040 L mg−1 at 25 °C, and based on the Freundlich adsorption isotherm, ‘KF’ and ‘n’ were found to be 87 mg g−1(1−1/n) and 2.6, respectively. This ‘n’ value of 2.6 (between 2 and 10) confirms that the arsenite anions can be easily adsorbed (Fig. 6(j)).91
Zhenhua Wei et al.92 synthesized hollow nest-like α-Fe2O3 spheres via a glycerol-mediated microwave-assisted hydrothermal method. As shown in Fig. 6(k) and (l), the α-Fe2O3 spheres (∼400 nm) were composed of nanorods with an aspect ratio 5. To study the removal efficiency of the nanoadsorbents for As(V) and Cr(VI), the corresponding metal ion solutions of various concentrations including 10, 20, 50, 100, 200, and 500 ppm were prepared using Na2HAsO4·7H2O and K2Cr2O7, respectively. About 15 mg of hollow α-Fe2O3 nanoadsorbent was added to 30 mL of the above metal ion solution and stirred constantly for 10 h. After equilibrium was achieved, the solid and liquid phases were immediately separated, and the resultant concentration of As(V) or Cr(VI) in the remaining solutions was determined by ICP-OES. To study the adsorption rate, As(V) and Cr(VI) solutions with an initial concentration of 40 ppm were used. The adsorption efficiency of the nest-like α-Fe2O3 spheres was studied using the initial concentration of 40 ppm As5+ and Cr6+ solutions (Fig. 6(m)). The hollow nest-like α-Fe2O3 showed a removal efficiency of 88% for As(V) and 67% for Cr(VI) within 120 min. Using the Langmuir adsorption isotherm model, as shown in Fig. 6(m), the maximum adsorption capacity was calculated to be ∼75.3 mg g−1 for As(V) and ∼58.6 mg g−1 for Cr(VI). These values are much higher than that of previously reported nanomaterials.92
Lu-Bin Zhong et al.93 prepared 3D urchin-like Fe–Mn binary oxide (UFMO) via a one-pot template-free method without the use of a surfactant. The as-synthesized UFMO consisted of an amorphous FeMnxOy binary oxide core and a well-aligned α-FeOOH nanorod shell having a high specific surface area of 142 m2 g−1. Owing to its 3D hierarchical morphology with heterogeneous surface chemical composition due to the core shell combination, it could efficiently adsorb heavy metal ions in water. As shown in the SEM and TEM images (Fig. 6(n) and (o), respectively), UFMO is composed of a spherical core with an average diameter of 250 nm and numerous nanorods 125 nm in length and 15 nm in width. For the adsorption studies, about 100 mL of the 100 ppb As(III) or Cd(II) solution was added to a 150 mL flask together with 50 mg L−1 UFMO nanoadsorbent, and the mixture was constantly stirred at 200 rpm for 6 h at 25 °C with the pH maintained at 7.0 ± 0.1 and 6.5 ± 0.1 for the As(III) and Cd(II) solutions, respectively. All the samples were filtered using Millipore membrane filters (0.22 μm) and their metal ion concentration was determined by ICP-OES. As shown in Fig. 6(p), just 0.05 g L−1 of UFMO could efficiently decrease 100 ppb As(III) to less than 1 ppb, which is below the maximum permissible limit (5 ppb) recommended by the World Health Organization (WHO) for drinking water.93
The various morphological architectures of the inorganic nanoadsorbents used for the adsorption of toxic arsenic ions in water are listed in Table 1. Among the nanoadsorbents listed in Table 1, hierarchical α-Fe2O3 with hollow nest-like spheres92 with the highest BET surface area 152.42 m2 g−1 and exhibits the highest adsorption efficiency of 75.3 mg g−1 for As(V) ions. The hierarchical MgO-400 nanosheets calcined at 400 °C (ref. 91) with the highest BET surface area of 194 m2 g−1 exhibits the highest adsorption efficiency of 545 mg g−1 for As(III) ions. The high adsorption efficiency of the nest-like α-Fe2O3 and flower-like MgO can be attributed to their hierarchical unique morphologies and high surface area.
| Nano-adsorbent | Morphology | BET surface area (m2 g−1) | Toxic ion adsorbed | Max. removal capacity (mg g−1) | Ref. |
|---|---|---|---|---|---|
| α-Fe2O3 | Hollow nest-like spheres | 152.42 | As(V) | 75.3 | 92 |
| α-FeOOH | Chrysanthemum-like micro-spheres | 120.8 | As(V) | 66.2 | 94 |
| α-Fe2O3 | Flowers | 40 | As(V) | 7.6 | 95 |
| α-Fe2O3 | Flowers | 130 | As(V) | 51 | 96 |
| Commercial α-Fe2O3 | Bulk powder | 2 | As(V) | 0.3 | 96 |
| α-FeOOH | Hollow urchin-like spheres | 96.9 | As(V) | 58 | 97 |
| CeO2 | Flowers | 34.1 | As(V) | 14.4 | 98 |
| CeO2 | Hollow nanospheres | 72 | As(V) | 22.4 | 99 |
| MgO-400 | Nanosheets calcined at 400 °C | 194 | As(III) | 545 | 91 |
| MgO-500 | Nanosheets calcined at 500 °C | 122 | As(III) | 502 | 91 |
| MgO-600 | Nanosheets calcined at 600 °C | 34 | As(III) | 339 | 91 |
| MgO-700 | Nanosheets calcined at 700 °C | 16 | As(III) | 148 | 91 |
| Fe3O4–MnO2 | Core–shell nanoplates | 124.85 | As(III) | 72.8 | 100 |
| Fe–Mn binary oxide | Nanowires | 57.6 | As(III) | 171 | 101 |
| Granular activated carbon (GAC) | Porous surface | 1124 | As(V) | 1.430 | 102 |
| Iron impregnated granular activated carbon (Fe-GAC) | Porous surface with aggregated particles | 876 | As(v) | 1.013 | 102 |
| CeO2 coated powdered activated carbon | — | 635 | As(V) | 12 | 103 |
| As(III) | |||||
| Cerium oxide modified activated carbon | Rough surfaces with pores | 414.4 | As(V) | 43.60 | 104 |
| As(III) | 36.77 |
In a typical adsorption process, as presented in Fig. 7, the hierarchically nanostructured metal oxide adsorbent undergoes hydrolysis in aqueous medium, resulting in the formation active hydroxy binding sites. The active hydroxy groups on the surface of the adsorbent bind the As5+ and As3+ ions. The high adsorption efficiency of metal oxide nanostructures for both As3+ and As5+ can be ascribed to following processes: (1) the formation of M(OH)x (x = 2 and 3) (eqn (1)) active sites on the surface of metal oxide MO nanostructures in aqueous medium and (2) monodentate and bidentate complex formation on the surface between As3+ and As5+ species with the surface hydroxyl groups (eqn (3)).
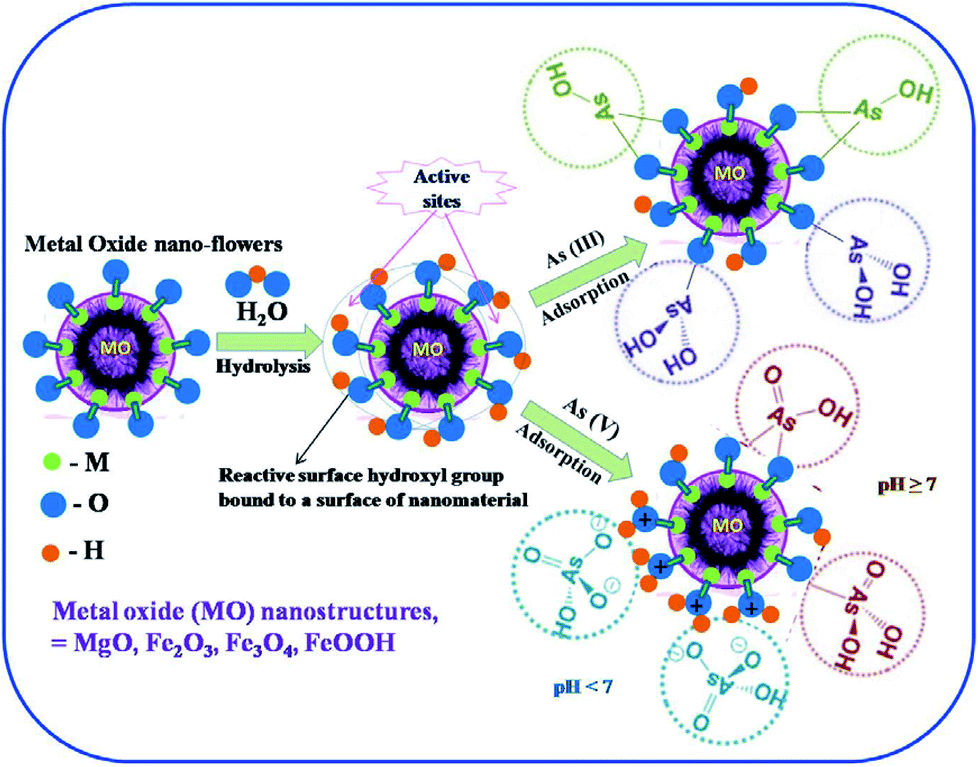 | ||
| Fig. 7 Schematic illustration for the probable mechanisms of As(III) and As(V) adsorption on hierarchical metal oxide nanostructures. | ||
Aqueous protonation reaction of arsenate (As5+) and arsenite (As3+) is as follows:
Arsenate protonation reaction in aqueous medium:
| AsO43− + H+ → HAsO42− | (4) |
| AsO43− + 2H+ → H2AsO4− | (5) |
| AsO43− + 3H+ → H3AsO4 | (6) |
Arsenite protonation reaction in aqueous medium:
| AsO33− + H+ → HAsO32− | (7) |
| AsO33− + 2H+ → H2AsO3− | (8) |
| AsO33− + 3H+ → H3AsO3 | (9) |
Surface complexation reaction (adsorption)
Arsenate adsorption
| M–OH + AsO43− + 3H+ → MH2AsO4 + H2O | (10) |
| M–OH + AsO43− + 2H+ → MHAsO4− + H2O | (11) |
| M–OH + AsO43− + H+ → MAsO42− + H2O | (12) |
Arsenite adsorption
| M–OH + AsO33− + 3H+ → MH2AsO3 + H2O | (13) |
| M–OH + AsO33− + 2H+ → MHAsO3− + H2O | (14) |
The adsorption of arsenic ions also depends on the pH of the solution. It is observed that when the solution is highly acidic (pH = 2), there is an increase in the positively charged sites on the surface due to protonation of the adsorbent, which favors the electrostatic attraction between MO and negatively charged arsenate ions. However, at higher pH values, there is an increase in the number of hydroxyl groups on the MO surface, which enhances its affinity towards As(III) and As(V). These observations confirm that MO adsorbents can be used in a wide pH range for the removal of arsenic in water.
4.2 Inorganic nano-architectures for the removal of lead, Pb(II), ions
Recently, researchers have demonstrated that inorganic metal oxides, hydroxides, and oxy hydroxides are efficient adsorbents for the removal of Pb(II) metal ions in water.105,106Hui Li et al.94 synthesized chrysanthemum-like α-FeOOH microspheres with a diameter of about 1 μm using an H2O/ethylene glycol (EG) cooperation-mediated method (Fig. 8(a)). The individual 3D hierarchical microsphere was comprised of numerous solid nanorods with lengths of a few hundred nanometres. To study the adsorption efficiency of the chrysanthemum-like α-FeOOH microspheres, solutions containing different concentrations (10, 20, 50, 100, 200, 500, 1000, and 1500 ppm) of As(V) and Pb(II) were prepared using Na2HAsO4·7H2O and Pb(NO3)2, respectively. Using 15 mg of α-FeOOH adsorbent, the adsorption isotherms were recorded using inductively coupled plasma-optical emission spectroscopy. Fig. 8(b) shows the adsorption rate of As(V) and Pb(II) at room temperature in water. Using, the Langmuir adsorption isotherm model, as shown in Fig. 8(c), the adsorption efficiency was calculated to be ca. 66.2 mg g−1 for As(V) and 103 mg g−1 for Pb(II). Compared to commercial bulk α-FeOOH, the chrysanthemum-like α-FeOOH microspheres is 100 times more efficient for the adsorption of arsenic ions in water.94
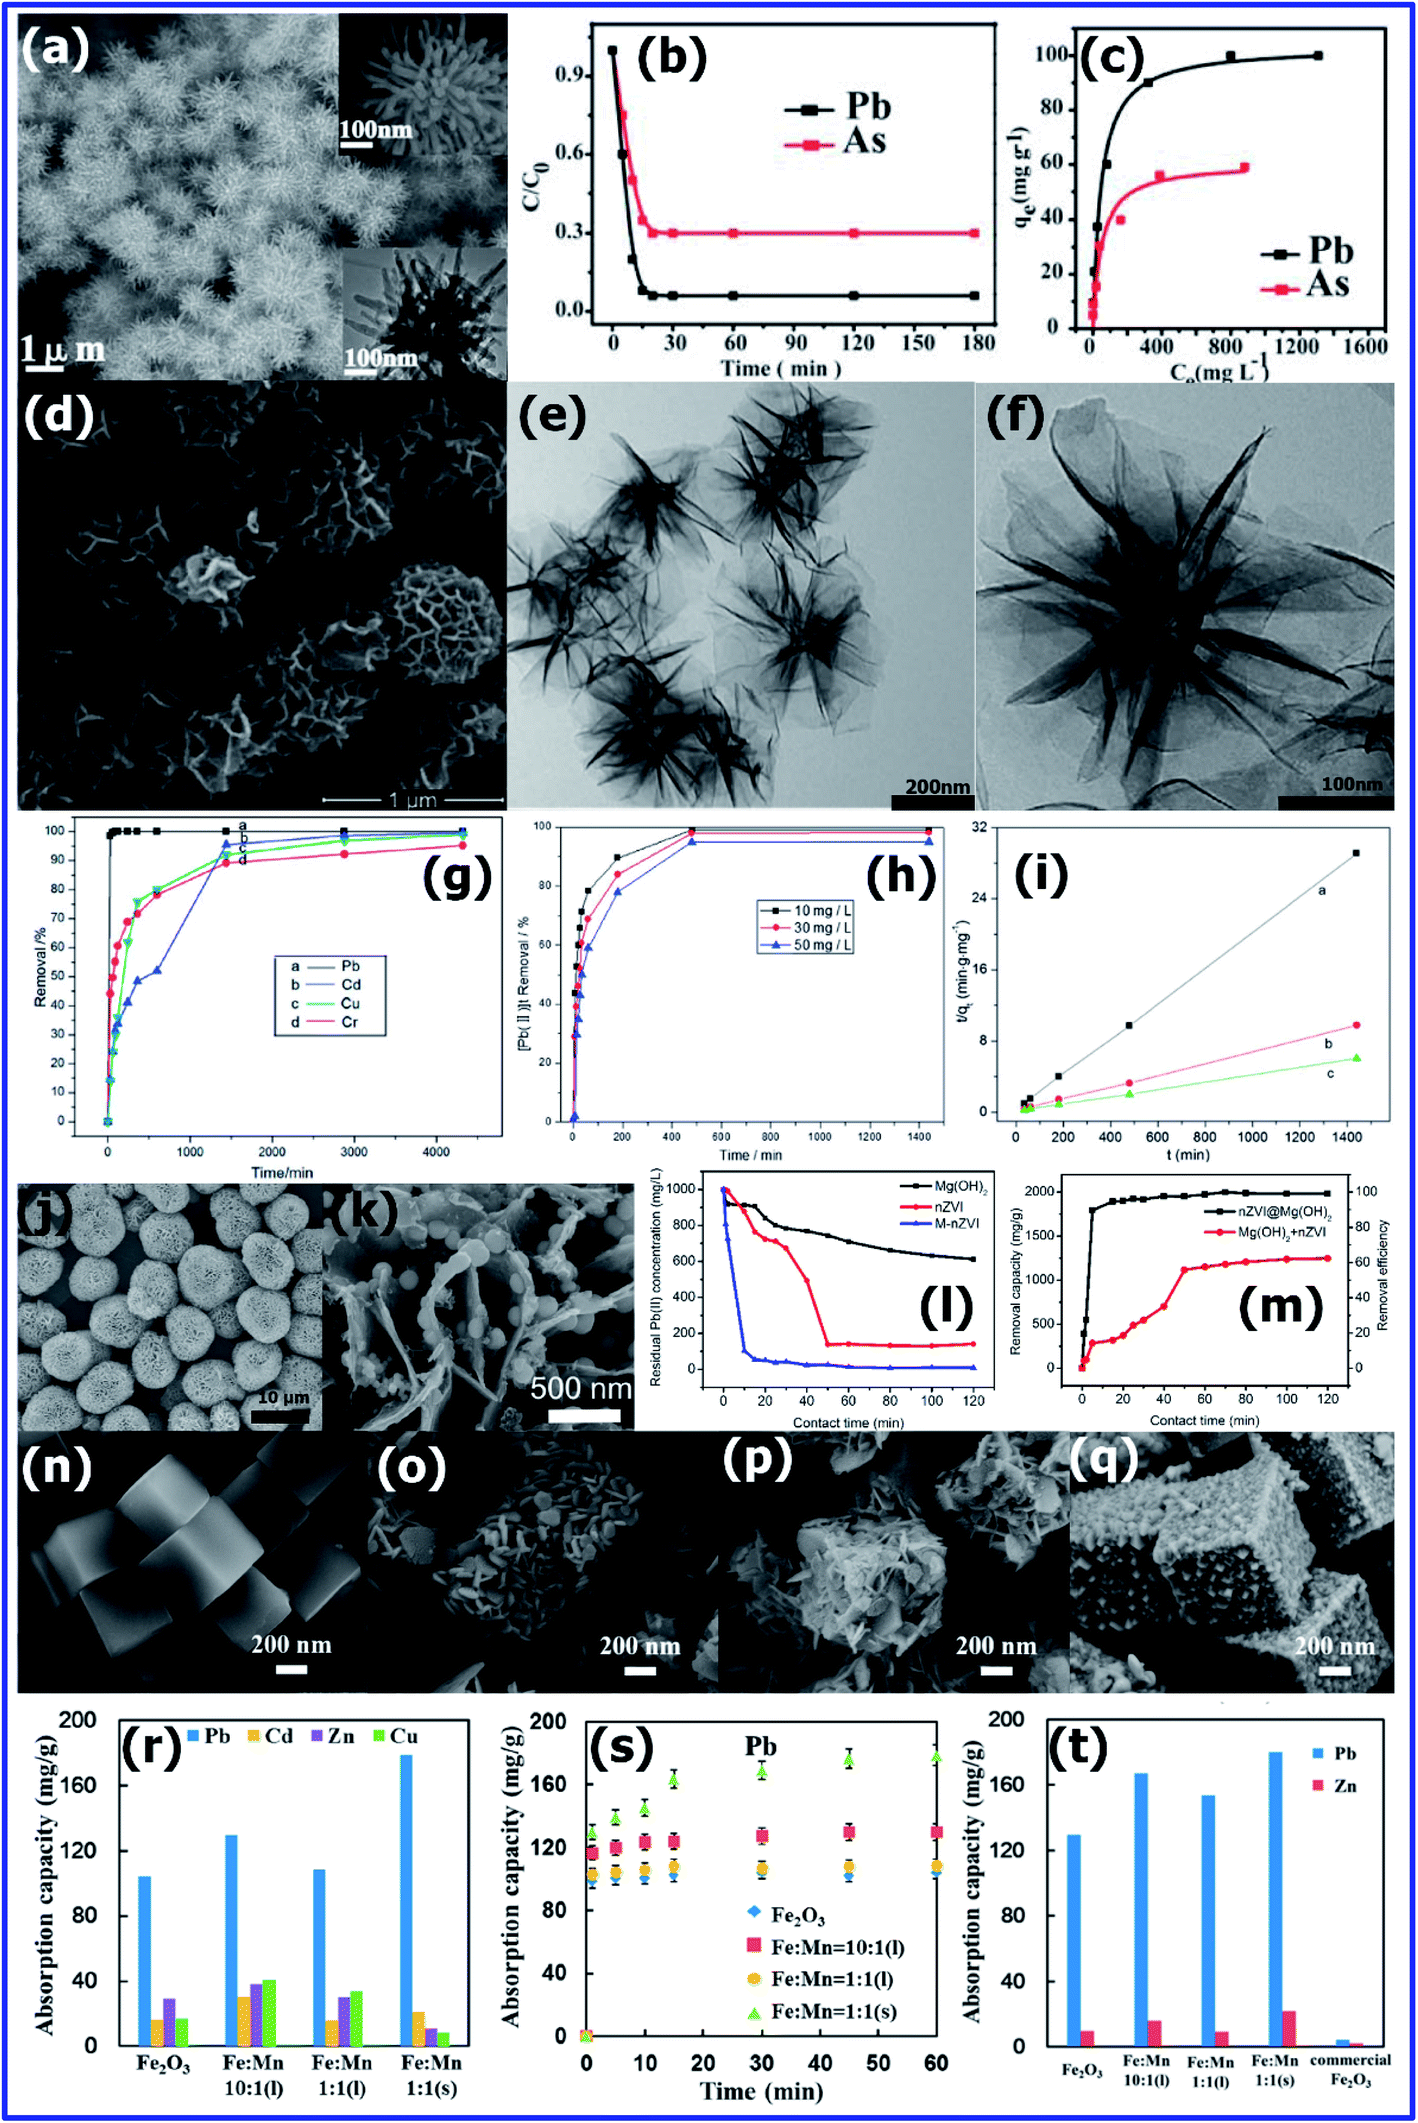 | ||
| Fig. 8 (a) SEM image of the as-obtained chrysanthemum-like α-FeOOH; insets: high-magnification SEM image (upper right) and TEM image (lower right) of an individual structure. (b) Time-dependent concentration of As(V) and Pb(II). (c) Adsorption isotherms of As(V) and Pb(II) using chrysanthemum-like α-FeOOH (Reprinted with permission from [ref. 94] Copyright © (2011) the Royal Society of Chemistry.) (d) SEM and (e and f) TEM images of as-synthesized MnO2 samples. (g) Relationship between the removal efficiency and time for the adsorption of Pb(II), Cd(II), Cu(II) and Cr(VI) by MnO2. (h) Relationship between the removal efficiency and time for the adsorption of Pb(II) by MnO2. (i) Pseudo-second-order kinetics for the adsorption of Pb2+ on the MnO2 sample (T = 30 °C; absorbent dose = 100 mg L−1; and Pb2+ concentration: a = 10 mg L−1, b = 30 mg L−1, and c = 50 mg L−1). (Reprinted with permission from [ref. 107] Copyright © (2014) the Royal Society of Chemistry.) SEM images of (j) flower-like Mg(OH)2 spheres and (k) nZVI@Mg(OH)2. (l) Comparison of Pb(II) removal by nZVI@Mg(OH)2, nZVI, and Mg(OH)2. (m) Comparison of Pb(II) removal capacity and efficiency by nZVI@Mg(OH)2 and weighted sum of the value by nZVI and Mg(OH)2 alone. (Reprinted with permission from [ref. 108] Copyright © (2015) American Chemical Society) SEM images of (n) Prussian blue (PB) (Fe4[Fe(CN)6]3) microcubes, (o) α-Fe2O3, (p) Mn-doped α-Fe2O3 nanoboxes (FM-1-L), and (q) hollow α-Fe2O3/KMn8O16 nanoboxes (FM-1-S). (r) Absorption capacity of five types of heavy metal ions in the presence of the α-Fe2O3/KMn8O16 nanoboxes with different initial concentrations of Fe/Mn. Adsorption isotherms of (s) Pb(II) using the α-Fe2O3/KMn8O16 nanoboxes. (t) Competition absorption properties of a mixture solution (Na+, K+, Mg2+, Ca2+, SO42−, NO3−, and Cl−) using the α-Fe2O3/KMn8O16 nanoboxes and commercial α-Fe2O3 powder. (Reprinted with permission from [ref. 109] Copyright © (2017) American Chemical Society.) | ||
Yuanyuan Guo et al.107 synthesised uniform hierarchical MnO2 microspheres with an average diameter of 700 nm (Fig. 8(d)) using 0.28 g of KMnO4, 0.01 g of NH4H2PO4 and 0.01 g of Na2SO4·10H2O via hydrothermal treatment at 140 °C for 48 h. The morphology was analysed in-depth via TEM, which confirmed that the MnO2 spheres were actually composed of thin nanosheets with a thickness of 2–3 nm, as is clearly shown in Fig. 8(e) and (f).
The adsorption experiments of heavy metal ions such Pb(II), Cd(II), Cu(II) and Cr(VI) were carried out at room temperature and pH 3. To a solution containing 20 ppm of these metal ions, 20 mg of MnO2 adsorbent was added and stirred constantly for 24 h. After sufficient stirring followed by aging, the supernatant solution was withdrawn and tested for metal ion concentration using atomic adsorption spectroscopy (AAS).
They conducted a series of kinetic experiments to determine the adsorption efficiency of the MnO2 microspheres for Pb2+, Cd2+, Cu2+ and Cr6+ at room temperature, and the results are shown in Fig. 8(g). The MnO2 microspheres were able to efficiently remove 100%, 99.6%, 99.1% and 95.2% of Pb2+, Cd2+, Cu2+ and Cr6+, respectively. This high removal efficiency could be attributed to their high specific surface area (252.82 m2 g−1) with abundant active sites. Fig. 8(h) and (i) show the adsorption tendency of the MnO2 adsorbent with respect to different concentrations of Pb2+ (10, 30 and 50 ppm) at 30 °C. The adsorption rate for the removal of Pb2+ by MnO2 was observed to be faster for the initial concentration and decreased with an increase in concentration. This is because for a lower concentration of Pb2+, there will be a large number of available high energy sites on the adsorbent; however, the availability of high energy sites decreases with an increase in the concentration of Pb2+, and hence it adsorbs at low energy sites, which results in a decrease in the adsorption rate.
Using nanoscale zerovalent iron (nZVI) as a support, Minghui Liu et al.108 prepared an nZVI@Mg(OH)2 nanocomposite via a precipitation method for the removal of Pb2+. As shown in the SEM image (Fig. 8(j)), the Mg(OH)2 flower-like spheres (10 μm) were composed of 10–20 nm thin interwoven Mg(OH)2 nanoplates. The high-resolution image of the morphology of nZVI@Mg(OH)2 shown in Fig. 8(k) clearly confirms that the nZVI nanoparticles with a diameter of 40–60 nm are uniformly embedded on the surface of the Mg(OH)2 nanoplates. The adsorption of Pb(II) was carried out using 50 mg of Mg(OH)2, nZVI, and nZVI@Mg(OH)2 adsorbents for 1000 ppm Pb(II) solution having a pH of 6.86 in a 250 mL three-necked flask with stirring at 300 rpm in an N2 environment at room temperature. After certain intervals, 3 mL of suspension was extracted by centrifugation and tested for Pb(II) concentration using ICP-AES. Under the optimal conditions, the Pb2+ removal efficiency of Mg(OH)2, nZVI, and nZVI@Mg(OH)2 is presented in Fig. 8(l). As shown in Fig. 8(l), Mg(OH)2, nZVI and nZVI@Mg(OH)2 reduced the Pb(II) concentration from 1000 ppm to 623.2 ppm, 141.8 ppm, and 6.8 ppm, after 120 min, and the removal efficiency was found to be 775.4, 1718.4, and 1986.6 mg g−1, respectively. The results shown in Fig. 8(m) confirm that the Pb(II) removal efficiency by nZVI@Mg(OH)2 is higher compared to the combined efficiency of both nZVI and Mg(OH)2. It is understood that the synergistic effect between nZVI and Mg(OH)2 caused the composite to show exceptional removal efficiency.108
Qiaoling Mo et al.109 derived hierarchical metal oxide nanostructures such as 500 nm uniform, smooth Prussian blue (PB) (Fe4[Fe(CN)6]3) microcubes (Fig. 8(n)), α-Fe2O3 (Fig. 8(o)), Mn-doped α-Fe2O3 nanoboxes (FM-1-L) (Fig. 8(p)), hollow α-Fe2O3/KMn8O16 nanoboxes (Fig. 8(q)) by annealing metal–organic frameworks (MOFs). The α-Fe2O3 nanoboxes were prepared by annealing PB crystals (Fe4[Fe(CN)6]3) at 650 °C with a slow heating rate of 0.5 °C min−1. Further, the α-Fe2O3/KMn8O16 nanoboxes were prepared by adding KMnO4 solution (1 g L−1) dropwise to 10 mL ethanol solution containing 0.1 g of PB microcubes. The SEM image of α-Fe2O3 (Fig. 8(o)) consisted of nanosheets, which were formed via the calcination PB microcubes at 650 °C. The SEM image (Fig. 8(p)) of the Mn-doped Fe2O3 microcubes was similar to that of the PB crystals. The doping was confirmed by EDS analysis, which indicated the presence of slightly less than 1.5 wt% Mn. The size of the α-Fe2O3 particle in the (104) and (110) directions was found to decrease to 35.3 and 76 nm, respectively, due to the doping of Mn. However, the doping of Mn did not damage the nanobox morphology. Fig. 8(q) shows the SEM image of the α-Fe2O3/KMn8O16 hollow nanoboxes (FM-1-S) with a relative concentration of α-Fe2O3 to KMn8O16 of roughly 2![[thin space (1/6-em)]](https://www.rsc.org/images/entities/char_2009.gif) :1. Due to its large surface area and plenty of surface adsorbed oxygen, FM-1-S showed an exceptional adsorption efficiency. The adsorption efficiencies of all the adsorbents were studied using 40 ppm Pb(II) solution and 10 mg of adsorbents. Together with 40 ppm of both Pb2+ and Zn2+, synthetic wastewater containing a significant amount of interfering ions including Na+ (68.3 ppm), K+ (6.44 ppm), Mg2+ (11.8 ppm), and Ca2+ (34.4 ppm), and significant amount of SO42−, NO3−, and Cl−. Fig. 8(r) represents the equilibrium adsorption capacity (Qe) of all the adsorbents. It was found that Qe for α-Fe2O3, FM-10-L, FM-1-L, and FM-1-S was 104.1 mg g−1, 129.8 mg g−1, 108.5 mg g−1, and 178.8 mg g−1, respectively.109
:1. Due to its large surface area and plenty of surface adsorbed oxygen, FM-1-S showed an exceptional adsorption efficiency. The adsorption efficiencies of all the adsorbents were studied using 40 ppm Pb(II) solution and 10 mg of adsorbents. Together with 40 ppm of both Pb2+ and Zn2+, synthetic wastewater containing a significant amount of interfering ions including Na+ (68.3 ppm), K+ (6.44 ppm), Mg2+ (11.8 ppm), and Ca2+ (34.4 ppm), and significant amount of SO42−, NO3−, and Cl−. Fig. 8(r) represents the equilibrium adsorption capacity (Qe) of all the adsorbents. It was found that Qe for α-Fe2O3, FM-10-L, FM-1-L, and FM-1-S was 104.1 mg g−1, 129.8 mg g−1, 108.5 mg g−1, and 178.8 mg g−1, respectively.109
Fig. 8(s) shows that about 70% Pb2+ could be removed within 1 min, and about 91.6% within 15 min. It was found that by using a slightly higher dose of the adsorbent (0.25 g L−1), the Pb2+ concentration decreased from 40 ppm to 0.76 ppm in just 10 min. This value is considerably lower than the permissible (threshold) value of 1 ppm Pb according to the national standard for wastewater to be released in public.
The adsorption capacity of FM-1-S (α-Fe2O3/KMn8O16 nanoboxes) towards Pb2+ in the presence of other heavy metal ions such as Cu2+, Zn2+, and Cd2+ was also studied (Fig. 8(t)). The high adsorption capacities for Pb2+ in the presence of other ions confirmed that the α-Fe2O3/KMn8O16 nanoboxes are more selective to Pb2+. As reported in Fig. 8(t), the adsorption efficiency of the FM-1-S adsorbent toward 180 ppm Pb2+ was found to be higher than all the other adsorbents.
Moreover, in a mixture of Pb2+ and Zn2+ solution, the α-Fe2O3/KMn8O16 nanoboxes adsorbed relatively very less Zn2+ (21.5 mg g−1), confirming that they can be effective in selectively separating Pb2+ from Zn(II) in a mixture. Fortunately, due to their magnetic nature, the α-Fe2O3/KMn8O16 nanoboxes can be easily extracted from the solution using an external magnetic field.
The various morphological architectures of inorganic nanoadsorbents studied for the adsorption of toxic Pb(II) ions in water are listed in Table 2. Among them, the nZVI@Mg(OH)2 composite108 with flower-like spheres having a BET surface area of 40.2 m2 g−1 exhibited the maximum adsorption capacity of 1986.6 mg g−1 for Pb(II) ions. Also, the hierarchical MgO-nanoflowers110 with a BET surface area 72 m2 g−1 exhibited the maximum adsorption capacity of 1980 mg g−1 for Pb(II) ions. The high adsorption efficiency of chrysanthemum-like α-FeOOH and flower-like Mg(OH)2 spheres, and hollow α-Fe2O3/KMn8O16 nanoboxes109 can be attributed to the hierarchy in their unique morphologies and high surface area.
| Nano-adsorbent | Morphology | BET surface area (m2 g−1) | Max. removal capacity (mg g−1) | Ref. |
|---|---|---|---|---|
| MgO | Flowers | 72 | 1980 | 110 |
| α-FeOOH | Chrysanthemum-like micro-spheres | 120.8 | 103 | 94 |
| α-FeOOH | Bulk commercial | 10 | 1.0 | 94 |
| nZVI@Mg(OH)2 composite | Flower-like spheres | nZV = 11.6 | nZV = 1718.4 | 108 |
| Support material (S.M) = 41.3 | S.M = 775.4 | |||
| Composite = 40.2 | Composite = 1986.6 | |||
| nZVI–zeolite composite | Chain-like structures | nZV = 12.25 | Composite = 806 | 111 |
| Zeolite = 1.03 | ||||
| Composite = 80.37 | ||||
| Sineguelas waste-supported nZVI | Nanoparticles | S.M = 3.9 | S.M = 63.5 | 112 |
| Composite = 35.6 | Composite = 225 | |||
| Kaolin-supported nZVI | Nanoparticles | S.M = 3.7 | Composite = 440.5 | 113 |
| Composite = 26.1 | ||||
| α-Fe2O3/KMn8O16 | Nanoboxes | 452 | 179 | 114 |
| MnFe2O4 | Nanowires | 37.8 | 131 | 115 |
| α-FeOOH | Hollow spheres | 96.9 | 80 | 97 |
| Fe3O4 | Nanoparticles | 43 | 36 | 116 |
| Fe3O4/Fe@ZnO | Nanospheres | 135 | 163 | 117 |
| Fe3O4/MnO2 | Flowers | 118 | 53.2 | 118 |
| MnO2/CNTs | Nanotubes | 275 | 78.7 | 119 |
| MnO2 | Hierarchical microspheres | 252.82 | 149 | 107 |
| Activated carbon derived from the seeds of Caryota urens plant | Heterogeneous, lamellar and spongy structures | — | 42.9 | 120 |
| Activated carbon from hazelnut husks | — | 1092 | 13.05 | 121 |
| Commercial (mesoporous) activated carbon | Rough and coarse with irregular crevices | 4273 | 20.3 | 122 |
 | ||
| Fig. 9 Schematic illustration representing the probable mechanisms of Pb(II) adsorption by hierarchical metal oxide nanostructures. | ||
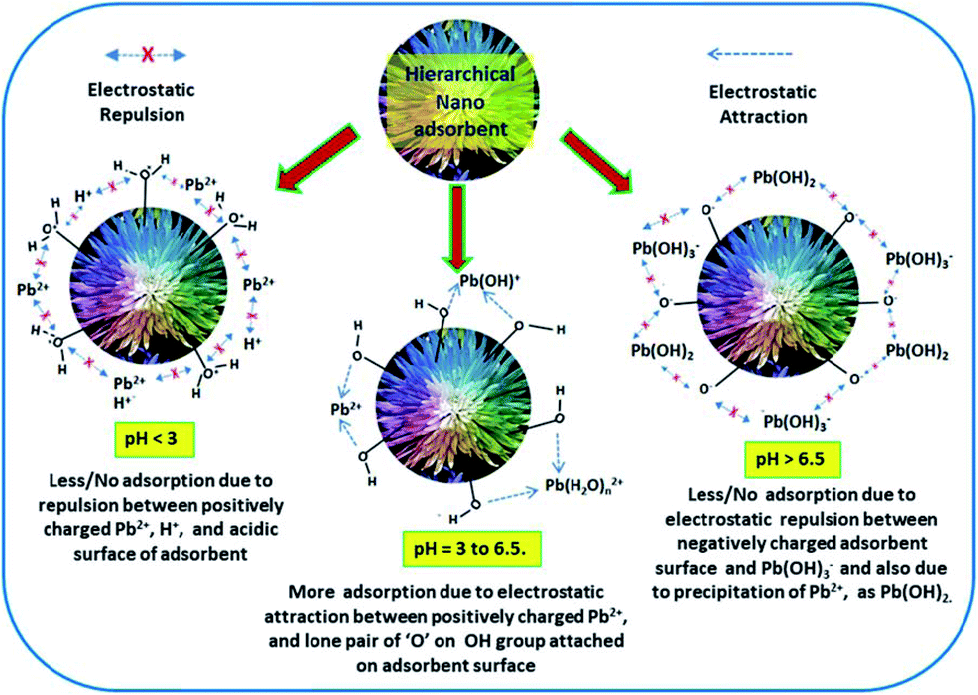
Further, due to hydrolysis, the Pb2+ cation exists in various forms in aqueous solution as follows:
| Pb2+ + nH2O → Pb(H2O)n2+ | (15) |
| Pb(H2O)n2+ → Pb(H2O)n−1 + H+ | (16) |
| nPb2+ + mH2O → Pbn(OH)m2n−m + mH+ | (17) |
Depending on the pH of the solution, the surface of metal oxide nanoadsorbents may also undergo protonation/deprotonation as follows:
 | (18) |
From the above observations, it is understood that the pH value greatly influences the adsorption performance of Pb2+. It has been reported that123 with [Pb2+] = 1 μM, if pH < 5, Pb2+ exists as the dominant species, whereas around pH > 5, Pb(OH)+ tends to exists. Besides, Pb(OH)2 starts to exist after pH = 6.5 (when Ksp = 1.43 × 10⁻²⁰ at 298 K). It was found that there exists very high electrostatic attraction between the negatively charged adsorbent surface and Pb2+ in the pH range of 5 to 6.5. With a decrease in the pH of the solution below 3, the number of positively charged sites on the adsorbent increases, which does not favor the adsorption of Pb2+ ions due to electrostatic repulsion (see Fig. 9). Also, at low pH, due to the competition between the excess H+ ions and Pb2+, the adsorption rate decreases. Therefore, the adsorption rate increases slowly with an increase in pH up to 6.5 due to the balanced opposite charges. However, for pH > 6.5, the adsorption efficiency decreases due to the precipitation of Pb2+ as lead hydroxide and the repulsion between the negatively charged adsorbent and adsorbate, as shown in Fig. 9. Therefore, for the efficient adsorption of Pb2+, the optimum pH of 6 should be maintained.124
4.3 Inorganic nano-architectures for the removal of chromium(VI) ions
It is mandatory that the concentrations Cr(III) and Cr(VI) should not be more than 2 and 0.05 ppm, respectively, in wastewater. Thus, to remove these chromium ions in water, several research groups have developed highly efficient hierarchical nanoadsorbents.Recently, Shijiao Wu et al.125 prepared, various polymorphs of iron oxy hydroxides such as α-FeOOH, β-FeOOH, γ-FeOOH, and δ-FeOOH using the procedure reported by various research groups.122,126–129 The SEM images presented in Fig. 10(a)–(d) correspond to uniform 3D urchin-like α-FeOOH, rod-shaped β-FeOOH, fine-grained irregular particles of γ-FeOOH, and irregular nanoflakes of δ-FeOOH, respectively.
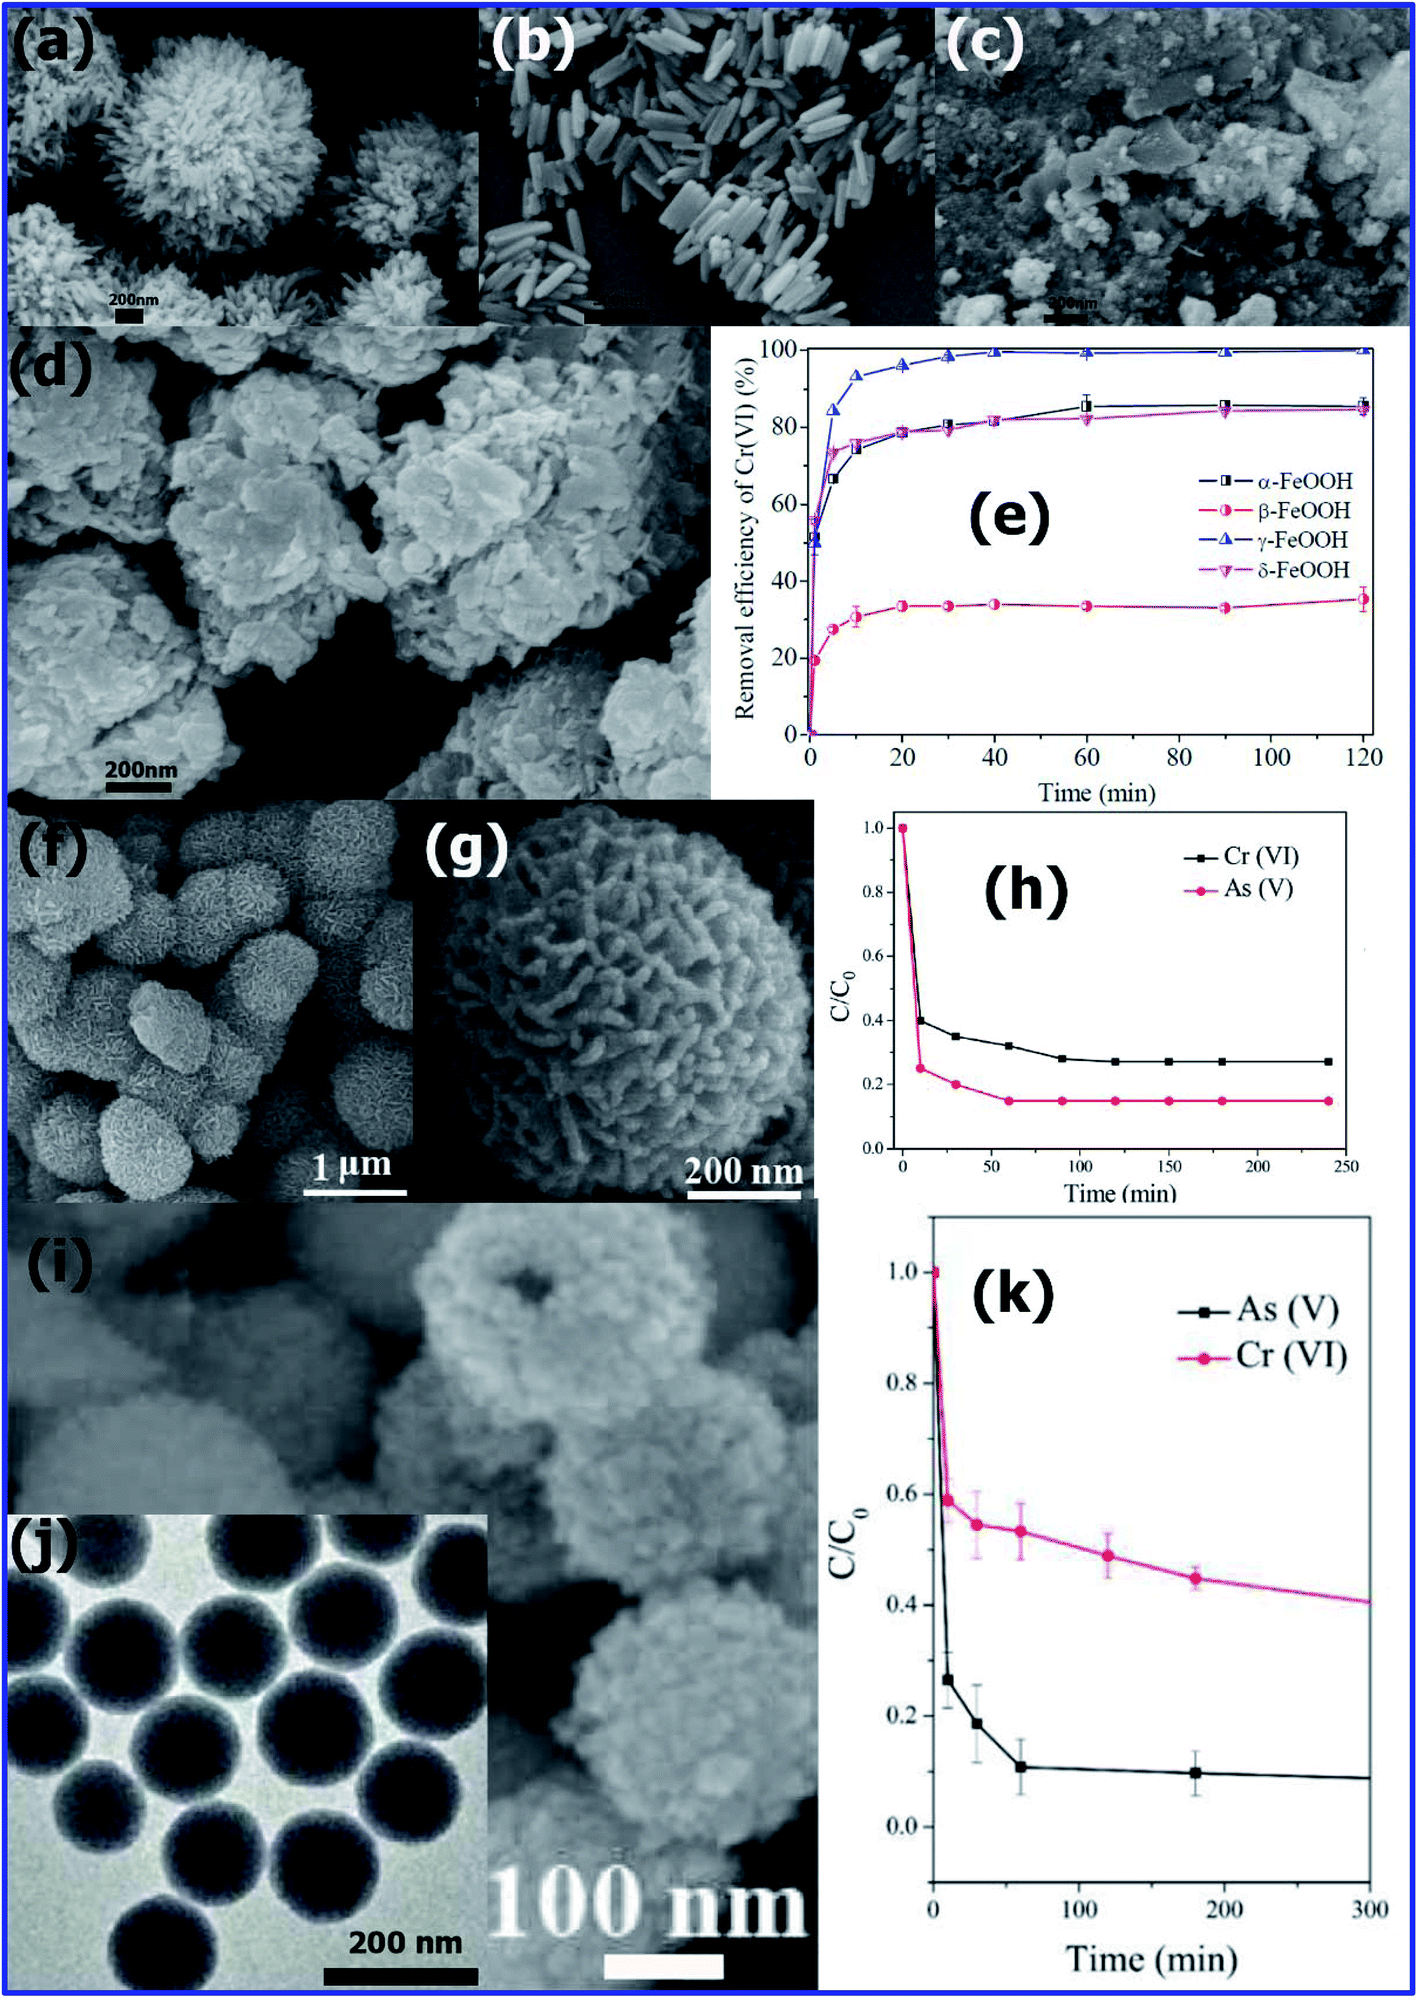 | ||
| Fig. 10 SEM images of (a) α-FeOOH, (b) β-FeOOH, (c) γ-FeOOH, and (d) δ-FeOOH after reaction with Cr(VI). (e) Comparison of Cr(VI) removal by the four FeOOH polymorphs. (Reprinted with permission from [ref. 125] Copyright © (2017) the Royal Society of Chemistry.). (f) Low and (g) high-magnification SEM images of flower-like α-Fe2O3 nanostructures. (h) Adsorption rate curves of As(V) and Cr(VI) using flower-like α-Fe2O3 nanostructures. (Reprinted with permission from [ref. 96] Copyright © (2012) the American Chemical Society.) (i) High-magnification SEM image of the ceria precursor (inset shows a broken nanosphere, scale bar = 100 nm). (j) TEM image of ceria precursor obtained at 1 min (scale bar = 200 nm). (k) Time-dependent concentration of As(V) (initial concentration of 13 mg L−1) using ceria hollow nanospheres. (Reprinted with permission from [ref. 99] Copyright © (2010) the American Chemical Society.) | ||
The adsorption efficiency of all the FeOOH polymorphs was studied by conducting a series of batch experiments. Specifically, 2.5 g L−1 of FeOOH powder was added to 100 mL solution containing 20 ppm Cr(VI) solution, stirred sufficiently and a sample was withdrawn at certain intervals for analysis. Further, using 1,5-diphenylcarbazide, the residual Cr(VI) concentration in the extracted sample was determined using a UV-2400 spectrophotometer at 540 nm. Also, the effect of pH value on the Cr(VI) removal was studied by adjusting the pH value to 3.0, 5.0, 7.0, and 9.0 at room temperature. To understand the adsorption kinetics, the experiments were conducted by adding 0.25 g of FeOOH polymorph adsorbent to 100 mL of solution containing the initial Cr(VI) concentration of 20, 40, 80, 120, 180, 240, and 300 ppm, while maintaining the pH 3 at 25 °C.
The Cr6+ removal efficiency of all the polymorphs of FeOOH was studied for comparison, and the results are shown in Fig. 10(e). The results indicated that the Cr6+ adsorption efficiencies of the FeOOH polymorphs decreased in the order of γ > α ≈ δ > β form of FeOOH. This order of adsorption efficiency is almost similar to the of their surface area (γ-FeOOH > δ-FeOOH > α-FeOOH > β-FeOOH). Therefore, γ-FeOOH having a high surface area exhibits high adsorption efficiency.125
The adsorption maximum reached a fast rate within 60 min, indicating that the Cr6+ adsorption efficiency of the FeOOH polymorphs was very fast. The reason for this very fast removal tendency could be the large number of easily accessible active sites on the surface of the FeOOH polymorphs for Cr6+ species. It was observed that at 60 min, the Cr6+ removal efficiencies by α, β, γ, and δ were about 85.5%, 33.5%, 99.3%, and 82.2%, respectively. By maintaining pH 3, 100% and 84.6% Cr6+ adsorption efficiency was achieved by the γ-FeOOH and δ-FeOOH forms, respectively. Due to its ferromagnetic nature, δ-FeOOH was easily recovered.
Recyclability is very important for any adsorbent to explore its practical applicability. Therefore, the Cr(VI) removal by the FeOOH polymorphs in the successive sorption cycles was also investigated. As shown in Fig. 11, the recyclability of all four FeOOH polymorphs was studied by conducting adsorption for 3 cycles. It was found that except for γ-FeOOH, the residual Cr(VI) concentration increased in the 3 cycles for α-FeOOH, β-FeOOH, and δ-FeOOH. This result was attributed to the loss of active adsorption sites on the surface of α-FeOOH, β-FeOOH, and δ-FeOOH. Very promisingly, γ-FeOOH exhibited very good adsorption efficiency even after 3 times repeated use. In the 3rd adsorption cycle, γ-FeOOH also showed more than 97% Cr(VI) removal efficiency. This was due to its highest surface area (294.5 m2 g−1), and hence it could retain a greater number of adsorption active sites for the further removal of Cr(VI).125
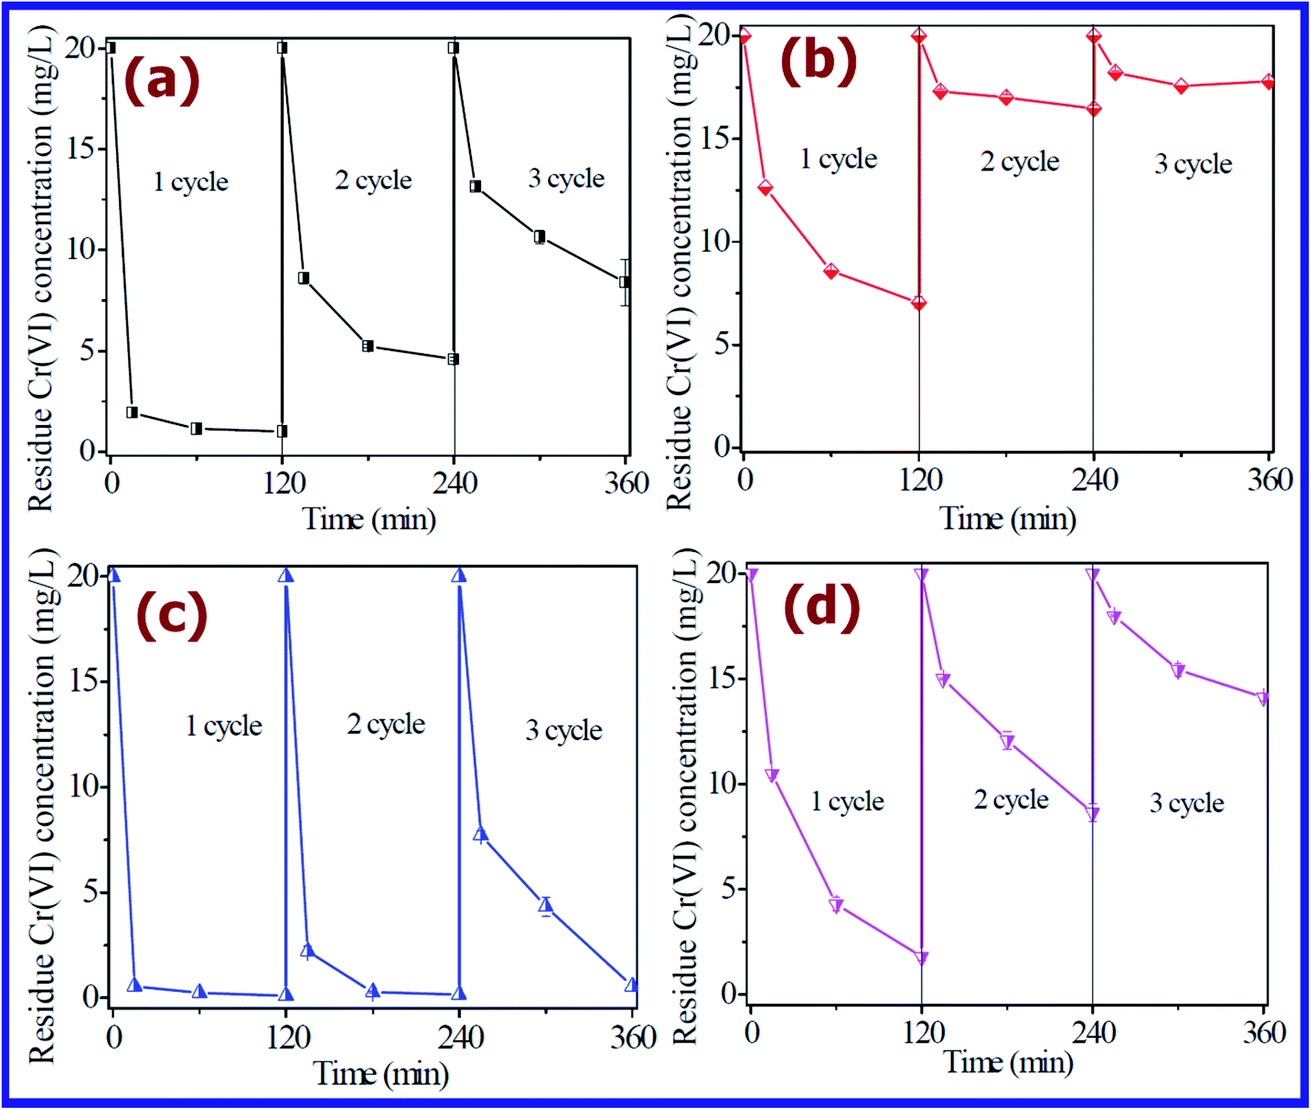 | ||
| Fig. 11 Recycling experiments at solution pH 3.0: (a) α-FeOOH, (b) β-FeOOH, (c) γ-FeOOH, and (d) δ-FeOOH. (Reprinted with permission from [ref. 125] Copyright © (2017) the Royal Society of Chemistry.) | ||
In another work, using a microwave-assisted solvothermal method, Chang-Yan Cao et al.96 synthesized flower-like α-Fe2O3 nanostructures with a high surface area (130 m2 g−1) and hydroxy group-rich surface. The typical SEM image shown in Fig. 10(f) presents flower-like architectures (0.8–1 μm in diameter) composed of hundreds of nanopetals (Fig. 10(g)). For the adsorption studies, solutions of As(V) and Cr(VI) with different concentrations were prepared using Na2HAsO4·7H2O and K2Cr2O7, respectively. By adding 20 mg of flower-like α-Fe2O3 to 25 ppm of 50 mL As(V) and 30 mL Cr(VI) solutions, while maintaining pH 3, the solutions were constantly stirred for 12 h to reach the maximum adsorption. After a specific time, the concentration of metal ions in the remaining solution was analyzed by ICP-OES. Using α-Fe2O3 nanoflowers, they studied the adsorption mechanism for Cr6+ together with As5+ for comparison. The mechanism was analysed via XPS and X-ray absorption near edge structure analysis. The adsorption was attributed to the exchange of ions between the surface hydroxyl groups and Cr6+ species. It was found that about 51 and 30 mg of As5+ and Cr6+, respectively, were adsorbed by 1 g of α-Fe2O3 nanoflowers. The adsorption process was studied using 25 ppm of As5+ and Cr6+ ion solutions. As presented in Fig. 10(h), in the first 30 min, the adsorption rate was very fast, and then it reached equilibrium after 3 h.
Many other metal oxide nanoadsorbents besides iron oxides have been explored as adsorbents for Cr6+ ions, such as cerium oxide (ceria, CeO2). Chang-Yan Cao et al.99 prepared CeO2 hollow nanospheres using 1 mmol of Ce(NO3)3·6H2O and 1.5 mmol of urea. The reaction was carried out at 170 °C in 2 min by microwave irradiation, and then hydrothermal treatment at that temperature for 30 min. After cooling to room temperature, a white precipitate of amorphous ceria was collected, which was washed and calcined in air at 500 °C for 2 h. The SEM image of the CeO2 hollow nanospheres shown in Fig. 10(i) confirms their uniform shape, with an average diameter of 260 nm, which were prepared at 170 °C for 30 min. According to the TEM image (Fig. 10(j)), it was also found that these ceria hollow structures were made up of a 30 nm shell consisting of a large number of nanoparticles. These CeO2 hollow nanospheres were used for the adsorption of Cr6+ ions in solution. For the detailed adsorption studies, metal ion solutions such as As(V), Cr(VI), and Pb(II) were prepared using Na2HAsO4·7H2O, K2Cr2O7, and Pb(NO3)2, respectively. To 10 mL of metal ion solution, about 0.02 g of ceria adsorbent was added at pH 3, and stirred at 25 °C to achieve the maximum adsorption. After sufficient stirring, the remaining metal ions in solution were tested by ICP-OES. The adsorption process was carried out at room temperature, as shown in Fig. 10(k), which indicates that the adsorption process was very fast for both As5+ and Cr6+ solutions. Using the Langmuir adsorption model, the adsorption efficiency was calculated to be 22.4 mg g−1 for As5+ and 15.4 mg g−1 for Cr6+. Very surprisingly, these CeO2 hollow nanospheres showed about 70 times higher adsorption efficiency than that of commercial bulk CeO2. Furthermore, the recycling efficiency of the adsorbent was studied, and the results were found to be promising. The adsorbent was regenerated with NaOH treatment.
The various morphological architectures of inorganic nanoadsorbents investigated for the adsorption of toxic Cr6+ ions present in water medium are listed in Table 3. Among them, the MoS2@Fe3O4 tiny nanoparticles130 having a BET surface area of 74.6 m2 g−1 exhibits the maximum adsorption capacity of 218.18 mg g−1 for Cr6+ ions. Also, Ga-doped ZnO131 exhibits the maximum adsorption capacity of 220.7 mg g−1 for Cr6+ ions. The high adsorption efficiency of the flower-like α-Fe2O3 nanostructures and ceria hollow nanospheres can be attributed to their unique hierarchical morphologies and high surface area.
| Nano-adsorbent | Morphology | BET surface area (m2 g−1) | Max. removal capacity (mg g−1) | Ref. |
|---|---|---|---|---|
| α-Fe2O3 | Hollow nest-like spheres | 152.42 | 58.6 | 92 |
| α-Fe2O3 | Flower-like | 40 | 4.47 | 95 |
| α-Fe2O3 | Flower-like | 130 | 30 | 96 |
| CeO2 | Flowers | 34 | 5.9 | 98 |
| CeO2 | Hollow nano-spheres | 72 | 15.4 | 99 |
| γ-Fe2O3 | Flower | 56 | 3.86 | 95 |
| Fe3O4 | Flower | 34 | 4.38 | 95 |
| Commercial α-Fe2O3 | Bulk | 2 | 0.68 | 95 |
| Amino-modified Fe3O4 | Nanoparticles | — | 11.24 | 132 |
| Fe3O4–Fe2O3 | Nanoparticles | — | 6.0 | 133 |
| Ga-doped ZnO | Nanoparticles | — | 220.7 | 131 |
| Fe@Fe2O3 | Core–shell nanowires | — | 177 | 134 |
| MoS2@Fe3O4NPs | Clumsy tiny particles | 74.6 | 218.18 | 130 |
| Activated carbon from Fox nutshell | — | 2636 | 74.95 | 135 |
| Activated carbon from Ziziphus spina-christi leaf | Abundant bumps and cavities on surface | 69.427 | 13.81 | 136 |
| Chestnut oak shell activated carbon | Porous aggregated particles | 989.4 | 85.47 | 137 |
| Activated carbon from sugar beet bagasse agricultural waste | Irregular shape and size with high porosity | 748 | 52.8 | 138 |
| ZnO-coated activated carbon derived from Peganum harmala seed | Irregular shapes of nanoparticles | 442 | 74.67 | 139 |
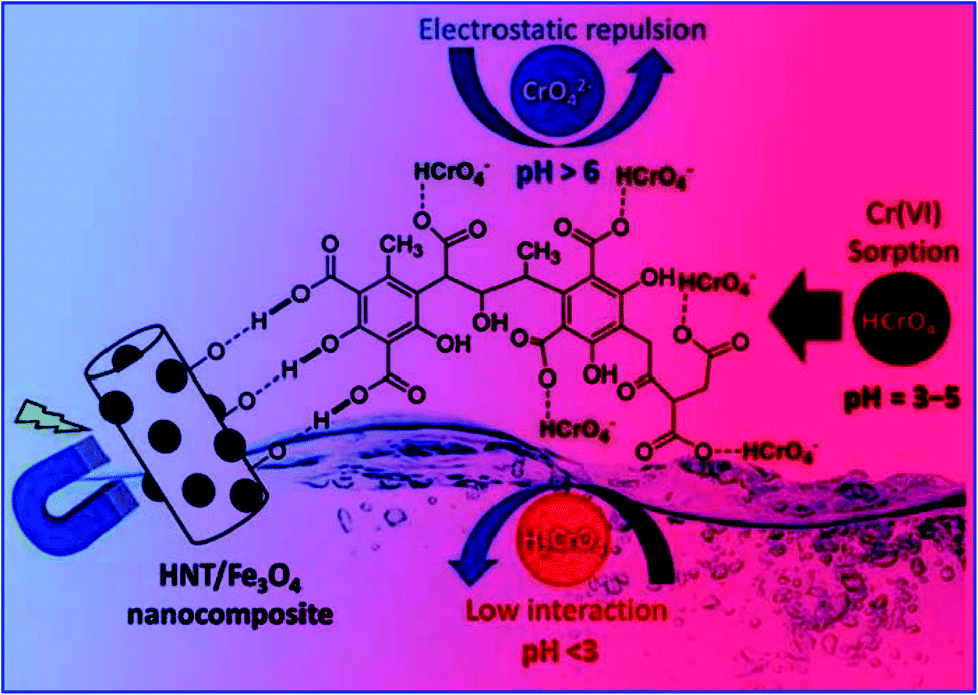 | ||
| Fig. 12 Schematic representation of the adsorption of chromium ions by the HNT/Fe3O4–HA nanoadsorbent at different pH. (Reprinted with permission from ref. 140, Copyright © (2020) John Wiley and Sons.) | ||
This may be due to the formation of the various forms of chromate such as H2CrO4, HCrO4−, CrO42− and Cr2O72− in solution with different pH values. It was found that, the high adsorption capacity was due to the electrostatic attraction between the negatively charged surface and the positively charged acid groups. At the low pH = 2, due to the strong protonation of the acid groups and formation of neutral H2Cr2O7, the electrostatic interaction decreases, which results in a low removal efficiency. However, at pH = 11, due to the strong competition between CrO42− and OH− anions of the nanoadsorbent, the Cr6+ absorption decreases (RE = 44%). However, in the pH range of 3 to 5, the solution contains more dominant negatively charged HCrO4− ions and the nanoadsorbent is positively charged, which is beneficial for more effective adsorption. Therefore, 98% removal efficiency by the HNT/Fe3O4–HA nanocomposite was observed in the pH range of around 3 to 5. Therefore, from the observations, it is clear that the nanoadsorbent has to be carefully designed to be effective to show high efficiency in the pH range of 3 to 5.
4.4 Inorganic nano-architectures for the removal of Cd(II) ions
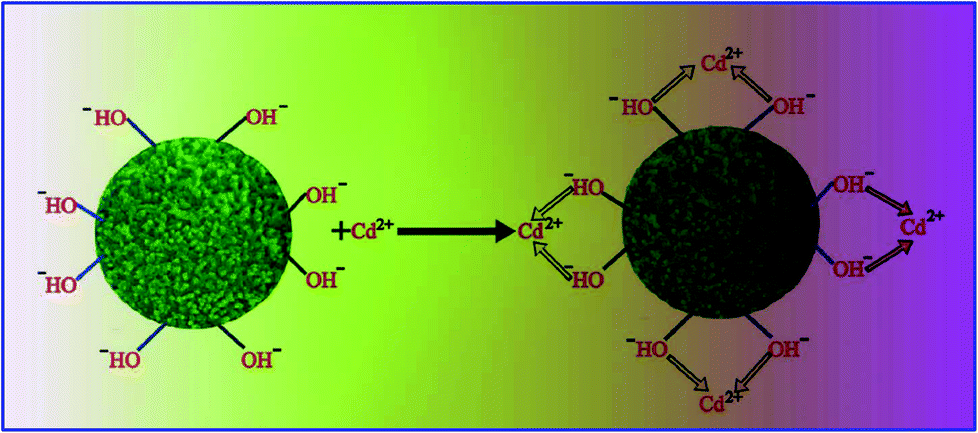
Various research groups have made significant efforts to develop potential adsorbents for the removal of the highly toxic Cd(II) present in water.141,142 Using a microwave-assisted solvothermal method, Chang-Yan Cao et al.110 synthesized a flower-like MgO nanoadsorbent. For the synthesis of MgO, 5 mmol of Mg(NO3)3·6H2O and 10 mmol of urea were dissolved in ethanol and placed in a Teflon-lined autoclave. The sealed autoclave was exposed to microwaves at 150 °C for 3 min, and then hydrothermally treated at that temperature for 30 min. After cooling, the precipitate of amorphous MgO was extracted, washed and calcined in air at 400 °C for 2 h. The SEM (Fig. 13(a)) and TEM images (Fig. 13(b)) confirmed the flower-like morphology of MgO. The BET surface area of the MgO flowers was found to be 72 m2 g−1. The adsorption capacity of these flower-like MgO nanostructures was tested for Cd2+ and Pb2+ for comparison. The metal ion Pb(II) and Cd(II) solutions with different concentrations having pH 7 were prepared using lead nitrate and cadmium nitrate, respectively. To study the adsorption kinetics, 15 mL of 100 ppm metal ion solution containing 10 mg flower-like MgO nanostructures was constantly stirred for 12 h to achieve the maximum adsorption. After a specific time, the remaining metal ions in solution were separated immediately and analysed by ICP-OES. Using 100 ppm of Cd2+ and Pb2+ solution, the adsorption rate was studied (Fig. 13(c)). In the first 30 min, the adsorption process was very fast, and then it reached equilibrium after 1 h. To understand the adsorption mechanism in detail, the adsorption process was also carried by varying the metal ion concentration from 100 to 5000 ppm, as shown in Fig. 13(d). The Langmuir model was used to understand the surface adsorption process for both ions. It was found that 1 g MgO nanoflowers could adsorb about 1500 mg of Cd2+ and 1980 mg of Pb2+, which are significantly higher than that of many reported nanoadsorbents.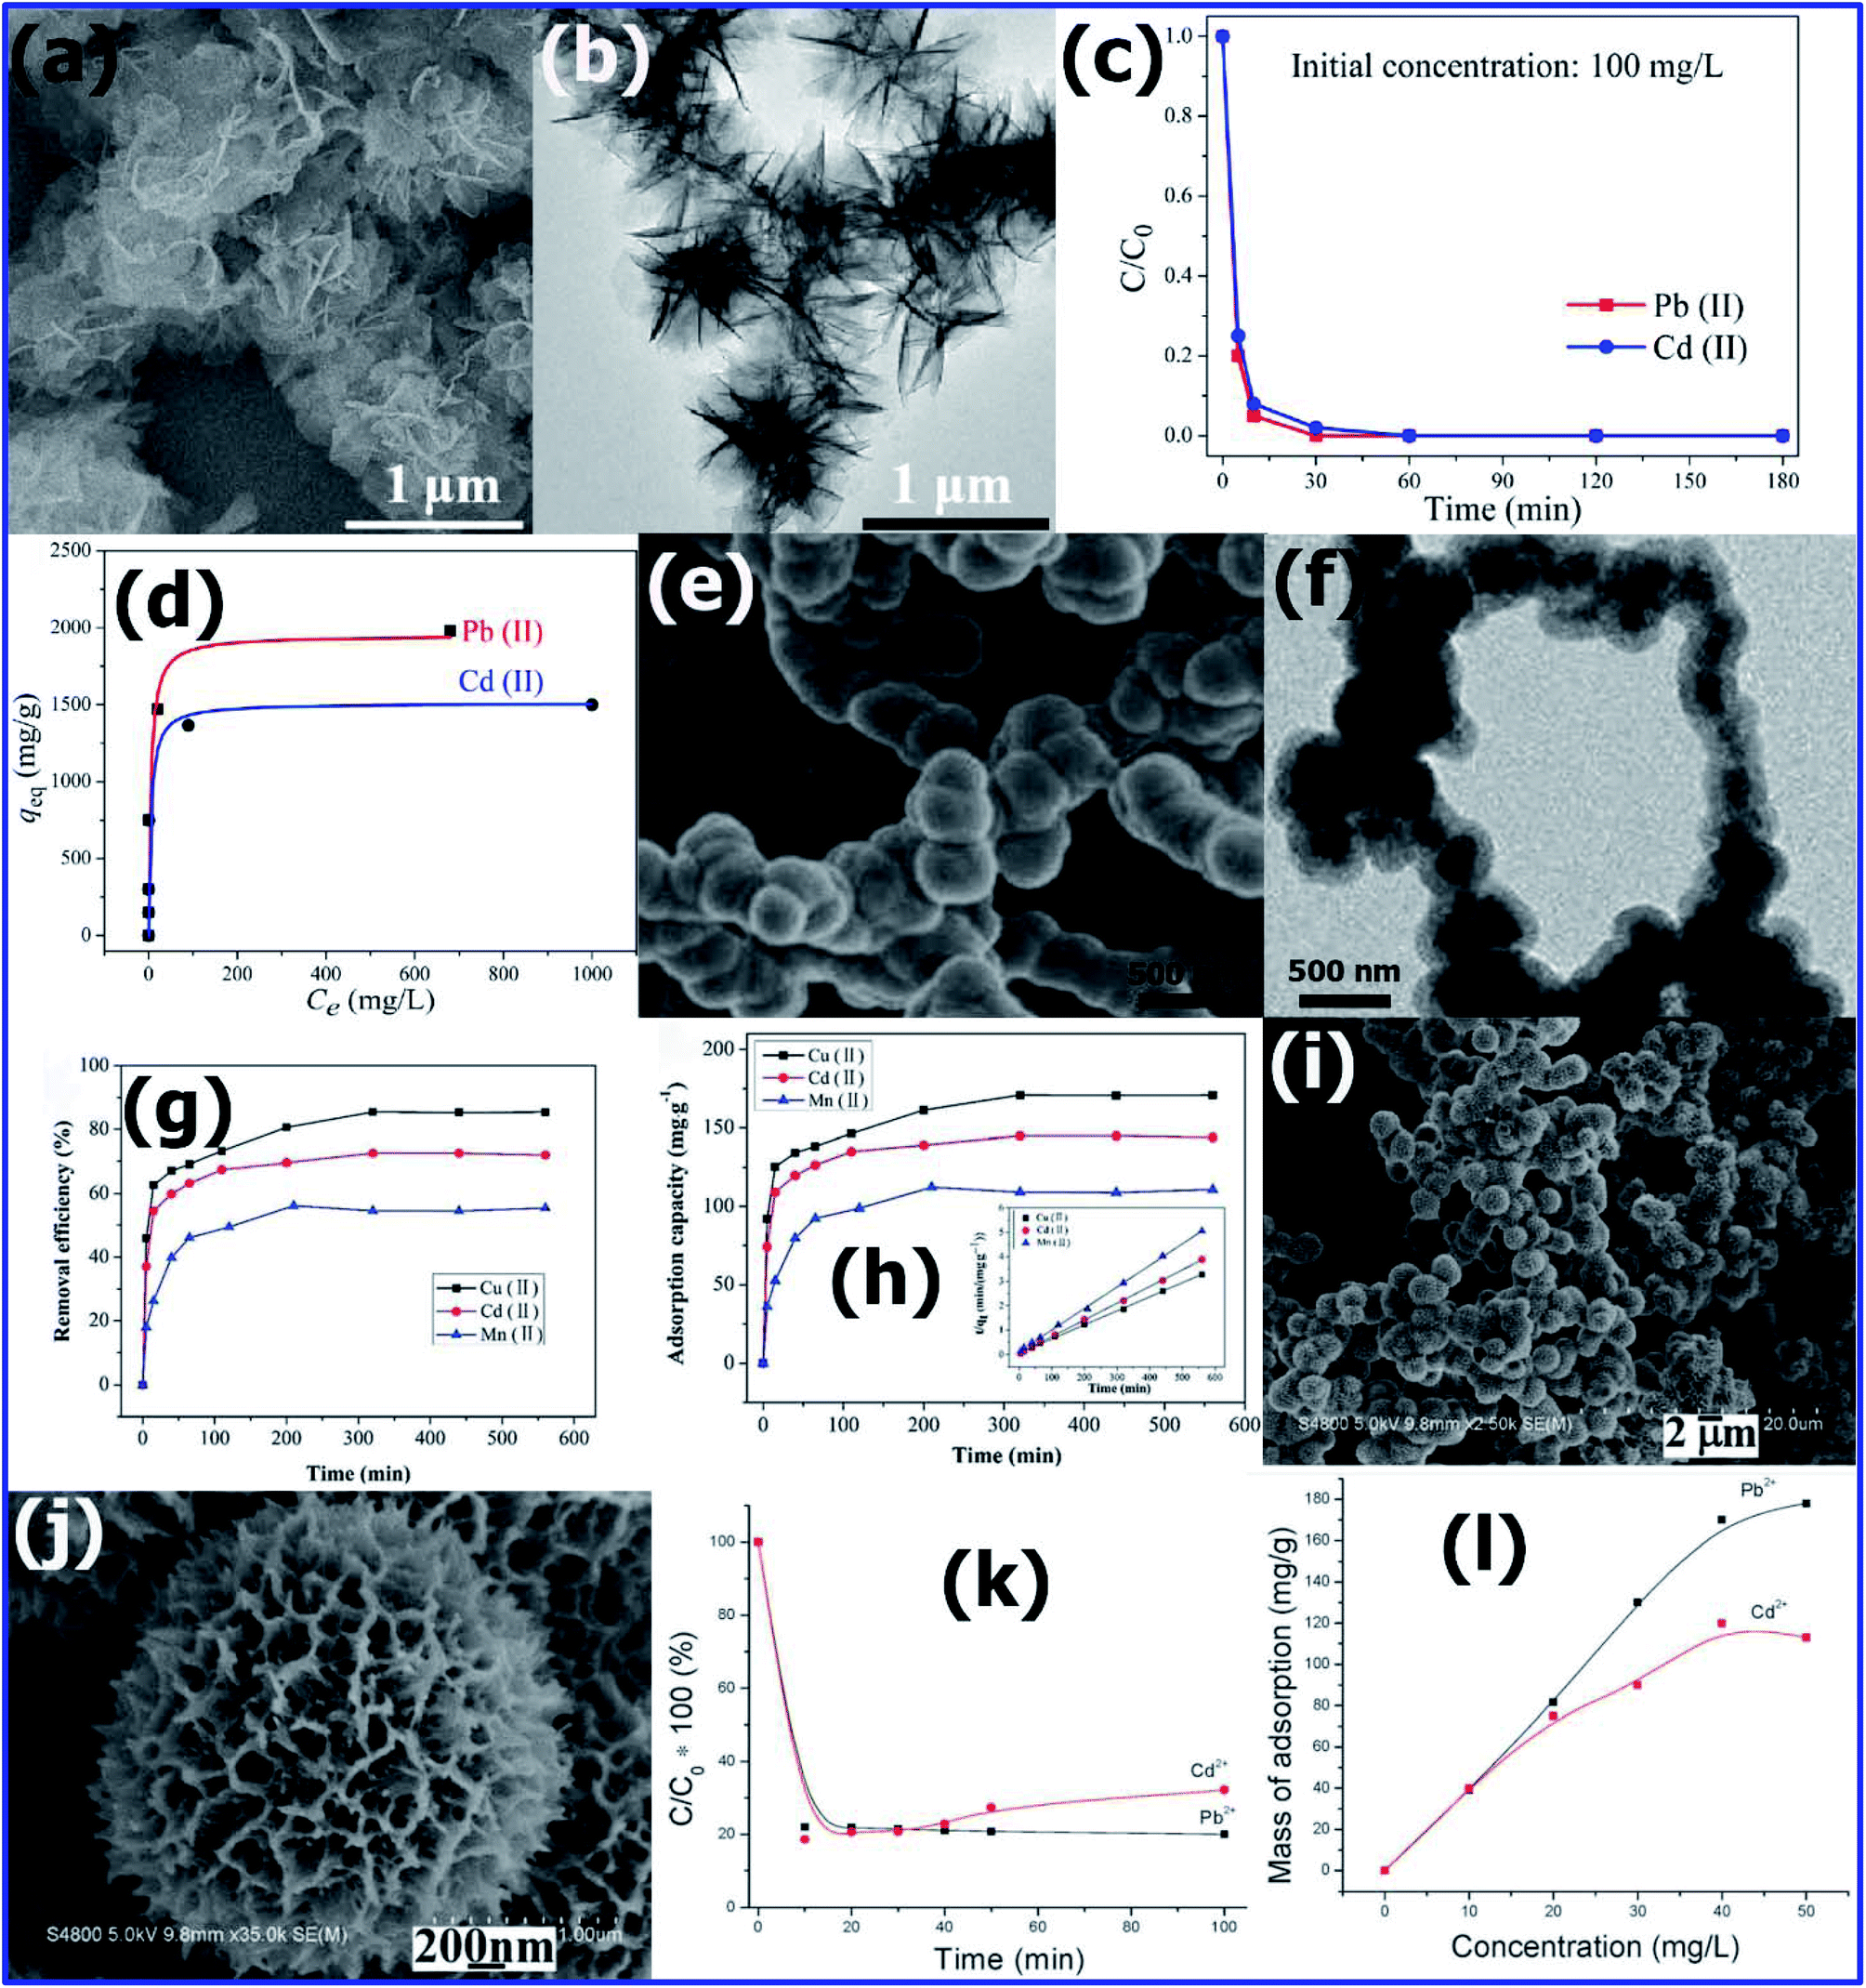 | ||
| Fig. 13 (a) Low-magnification TEM image and (b) high-magnification TEM image of flower-like MgO nanostructures. (c) Adsorption rates and (d) adsorption isotherms of Pb(II) and Cd(II) with flower-like MgO nanostructures as adsorbents. (Reprinted with permission from [ref. 110] Copyright © (2012) the American Chemical Society.) SEM images of (e) CoFe2O4@SiO2–NH2 and TEM images of (f) CoFe2O4@SiO2–NH2. Effect of contact time on the adsorption of heavy metal ions (Cu(II), Cd(II), and Mn(II)) by CoFe2O4@SiO2–NH2. (g) Removal efficiency and (h) adsorption capacity pseudo-second order kinetics plots. (Reprinted with permission from [ref. 143] Copyright © (2016) the Royal Society of Chemistry.) Electron microscopy images of the Ni–P microstructures prepared at 160 °C for 16 h: (i) low-magnification SEM image and (j) high-magnification SEM of the Ni–P microstructures. (k) Concentration change curves of Pb2+ and Cd2+ ions with adsorption time. (l) Adsorption isotherms of Pb2+ and Cd2+ ions. (Reprinted with permission from [ref. 147] Copyright © (2011) the Royal Society of Chemistry.) | ||
There have been several attempts to effectively adsorb Cd2+ using organic group-functionalised inorganic nanoadsorbents instead of the traditional metal oxide-based adsorbents. One such attempt was made by Chunrong Ren et al.,143 where they prepared an amino-functionalized CoFe2O4–SiO2 core–shell magnetic adsorbent, which was found to exhibit excellent magnetic and adsorption performances. The CoFe2O4 NPs prepared via the co-precipitation method were further coated with SiO2 and functionalised with amine groups using the procedure reported by the research groups of Qingbiao Yang,144 Min Wei,145 and Lili Yang.146 As shown in the SEM image (Fig. 13(e)), the CoFe2O4 NPs exist in the form of particle-aggregated chain-like nanostructures because of their magnetic properties. The size of the aggregated particles was determined using TEM, as shown in Fig. 13(f), to be between 10–20 nm. According to the TEM image, it can also be seen that the core–shell structure possessed a chain morphology with about 50 nm thin shell. The same morphology was retained even after amino functionalization.
About 20 mg of the amino-functionalized CoFe2O4–SiO2 core–shell adsorbent was used to study its adsorbing tendency for 80 ppm solutions of Cd2+, Cu2+, and Mn2+ ions, maintaining a pH of 6.5 and temperature 35 °C. Using a permanent magnet, the adsorbent was separated from the solution and the remaining metal ion concentration in the supernatant was evaluated by AAS. As shown in Fig. 13(g), the removal efficiency was very high in the first 50 min, and then it increased slowly from 50 to 200 min, and subsequently, it showed no change up to 540 min. The adsorption efficiency of the amino-functionalized CoFe2O4–SiO2 with respect to three metal ions is shown in Fig. 13(h), which was found to be 170.829, 144.948 and 110.803 mg g−1 for Cu2+, Cd2+ and Mn2+, respectively.
The large-scale use of nanoadsorbents depends on the efficiency of their recyclability. Therefore, the removal efficiency of the CoFe2O4@SiO2–NH2 NCs for the adsorption of Cu(II) after four times of recycling was studied. It was found that in the first cycle, the removal efficiency was 96.92%, and after four cycles, the adsorption efficiency for Cu(II) was around 85.41%. The decrease in their adsorption efficiency was not significant. Therefore, the CoFe2O4@SiO2–NH2 adsorbent can be used for at least four times with high adsorption efficiency. Furthermore, due to its magnetic nature and high desorption ability, this adsorbent can be recycled easily from wastewater using a strong magnet. Additionally, its structural features and magnetic property remained unaltered, confirming its stability even after four cycles of use, and hence it can be effectively used for the removal of various heavy metal ions.
There was one more attempt in using a metal phosphide nanoadsorbent for the removal of Cd2+ in water. Yonghong Ni et al.147 synthesized urchin-like, magnetic Ni–P microstructures via a solvothermal route. In a typical synthesis, NiCl2 and NaH2PO2 as reactant precursors were dissolved in water–DMF, a mixed solvent, and reacted at 160 °C for 16 h in the absence of any surfactant or template. As shown in Fig. 13(i), the FESEM image confirms the synthesis of homogeneous microspheres with an average diameter of ∼2 μm of Ni–P microstructures. The high-magnification SEM image shown in Fig. 13(j) also confirms the presence of the porous microspheres, which are constructed by nanoscale urchin-like structures. To study the adsorption efficiency, about 10 mg of urchin-like Ni–P adsorbent was dissolved in 50 mL solution containing 10 ppm Pb2+ metal ions (or Cd2+) and stirred with a magnetic pulsator for 10 min. After a specific time, the adsorbents were collected using a magnet and the metal ion concentration remaining in solution was analysed by ICP-AES. The adsorption efficiency of the Ni–P microstructures was studied for Cd2+ and Pb2+ ions under the same experimental conditions. It was found that 1 g of Ni–P microspheres could adsorb about 40.7 mg of Cd2+ (81.4%) in just 10 min. Fig. 13(k) presents the variation in the concentration of metal ions (Cd2+ and Pb2+) with contact time. The adsorption isotherms of Pb2+ and Cd2+ ions, as presented in Fig. 13(l), shows that the adsorbent Ni–P microspheres with a large surface area of 425 m2 g−1 adsorbed a large amount of Cd2+ and Pb2+ ions from their dilute solutions at a fast rate. Due to their magnetic nature, the Ni–P microspheres could be easily extracted from solution using a strong magnet, and reused several times.147
The various morphological architectures of inorganic nanoadsorbents studied for the adsorption of toxic Cd(II) ions is water are listed in Table 4. Among them, the MgO nanoflowers110 (surface area 72 m2 g−1) exhibit the maximum adsorption efficiency of 1500 mg g−1 for Cd2+ ions. Also, the amine-functionalised CoFe2O4@SiO2–NH2 core shell nanostructures exhibit the maximum adsorption capacity of 145 mg g−1 for Cd2+ ions.143
| Nanoadsorbent | Morphology | BET surface area (m2 g−1) | Max. removal capacity (mg g−1) | Ref. |
|---|---|---|---|---|
| MgO | Nanoflowers | 72 | 1500 | 110 |
| Ni–P | Urchin-like microstructure | 425 | 40.7 | 110 |
| Fe3O4-mesoporous magnesium silicate | Inter-crossed nanosheets | 263.4 | 223.2 | 148 |
| Fe3O4–SO3H | Nanoparticles coated shell structure | 18.32 | 108.93 | 149 |
| Chitosan/SiO2/Fe3O4 | Microspheres | 1.04 | 4.5 | 150 |
| Ni@Mg(OH)2 | Spherical core–shell nanostructures | 124.2 | 45.02 | 151 |
| CoFe2O4@SiO2–NH2 | Core–shell chain structure | — | 144.948 | 143 |
| FeMnxOy@FeOOH | Urchin-like | 142 | 79.06 | 93 |
| MgO@SiO2 | Nanoparticles | 427 | 35.86 | 152 |
| TiO2 | Nanoparticles | 185.5 | 15.32 | 153 |
| MnO2 | — | 100.5 | 143.31 | 154 |
| Al2O3 | — | 30.38 | 83.33 | 155 |
| Al2O3–Fe3O4 | Nanocomposite | 298 | 625 | 156 |
| Maghemite (γ-Fe2O3) | Nanotubes | 321.33 | 94.33 | 157 |
| Commercial (mesoporous) activated carbon | Rough and coarse with irregular crevices | 4273 | 27.3 | 122 |
| Activated carbon | Honeycomb or the circular holes | 305.8 | 11 | 158 |
| Polyethyleneimine-modified activated carbon | Irregular rough surface and the pores structure with spongy-like deposits | 113.3 | 45 | 158 |
 | ||
| Fig. 14 Schematic illustration of the adsorption mechanism of Cd(II) ions by the TiO2 nanoadsorbent (Reprinted with permission from ref. 159, Copyright © (2014) the Royal Society of Chemistry). | ||
4.5 Inorganic nano-architectures for the removal of Hg(II) ions
The main issue with magnetic adsorbents is that they tend to aggregate easily during the adsorption process.160 Thus, to avoid this issue, various research groups have prepared core–shell structures of nanosized magnetic adsorbents for the removal of Hg(II) in water.161,162Chaiti Ray et al.163 synthesized a porous CuS adsorbent using 4 mmol of thioacetamide (TAA) and 4 mmol of copper chloride (CuCl2·2H2O) as reactant precursors via the precipitation method. The FESEM images shown in Fig. 15(a) and (b) demonstrate the porous open end tubular CuS product, with a length of 20–30 μm and diameter of 1.5–2 μm. The high-magnification FESEM image in Fig. 15(c) shows that the CuS tube is made up of 600–700 nm-thick walls, conjointly stacked micro-flowers, and 15–25 nm-thin nano-flakes. The BET specific surface area and total pore volume of CuS were found to be 62.308 m2 g−1 and 0.5182 mL g−1, respectively. To study the adsorption kinetics, 10 mg of copper sulfide adsorbent was dissolved in 200 mL of Hg(II) or Pb(II) solution with a mM concentration, maintaining the pH of ∼2.8 and 4.7, respectively. The solution mixture was stirred to achieve maximum adsorption, and then after a pre-determined interval, a some of the reaction mixture was centrifuged, and the remaining Hg(II) ion complexed with diphenyl carbazide analyzed. By recording the absorbance of the complex at 521 nm using a UV-vis spectrophotometer, the concentration of remaining Hg(II) ions was estimated. Similarly, by forming a complex of Pb(II) ions with xylenol orange and measuring the absorbance of the complex at 579 nm, the residual Pb(II) ion concentration was estimated. The experimental data of the adsorption kinetics of Hg(II) metal ions, as presented in Fig. 15(d), was found to be in good agreement with the pseudo-second order equation. By studying the adsorption isotherms, as shown in Fig. 15(e), the adsorption mechanism of Hg(II) was found to follow monolayer adsorption (Langmuir model). The maximum adsorption efficiency of CuS was studied by varying the initial concentration of Hg(II) ions using 0.05 g L−1 of adsorbent (Fig. 15(f)). The maximum adsorption efficiency was found to be 3096 mg g−1 for Hg(II). Accordingly, the porous nature and ion exchange reaction were proposed to be responsible for the very high adsorption efficiency of CuS.163
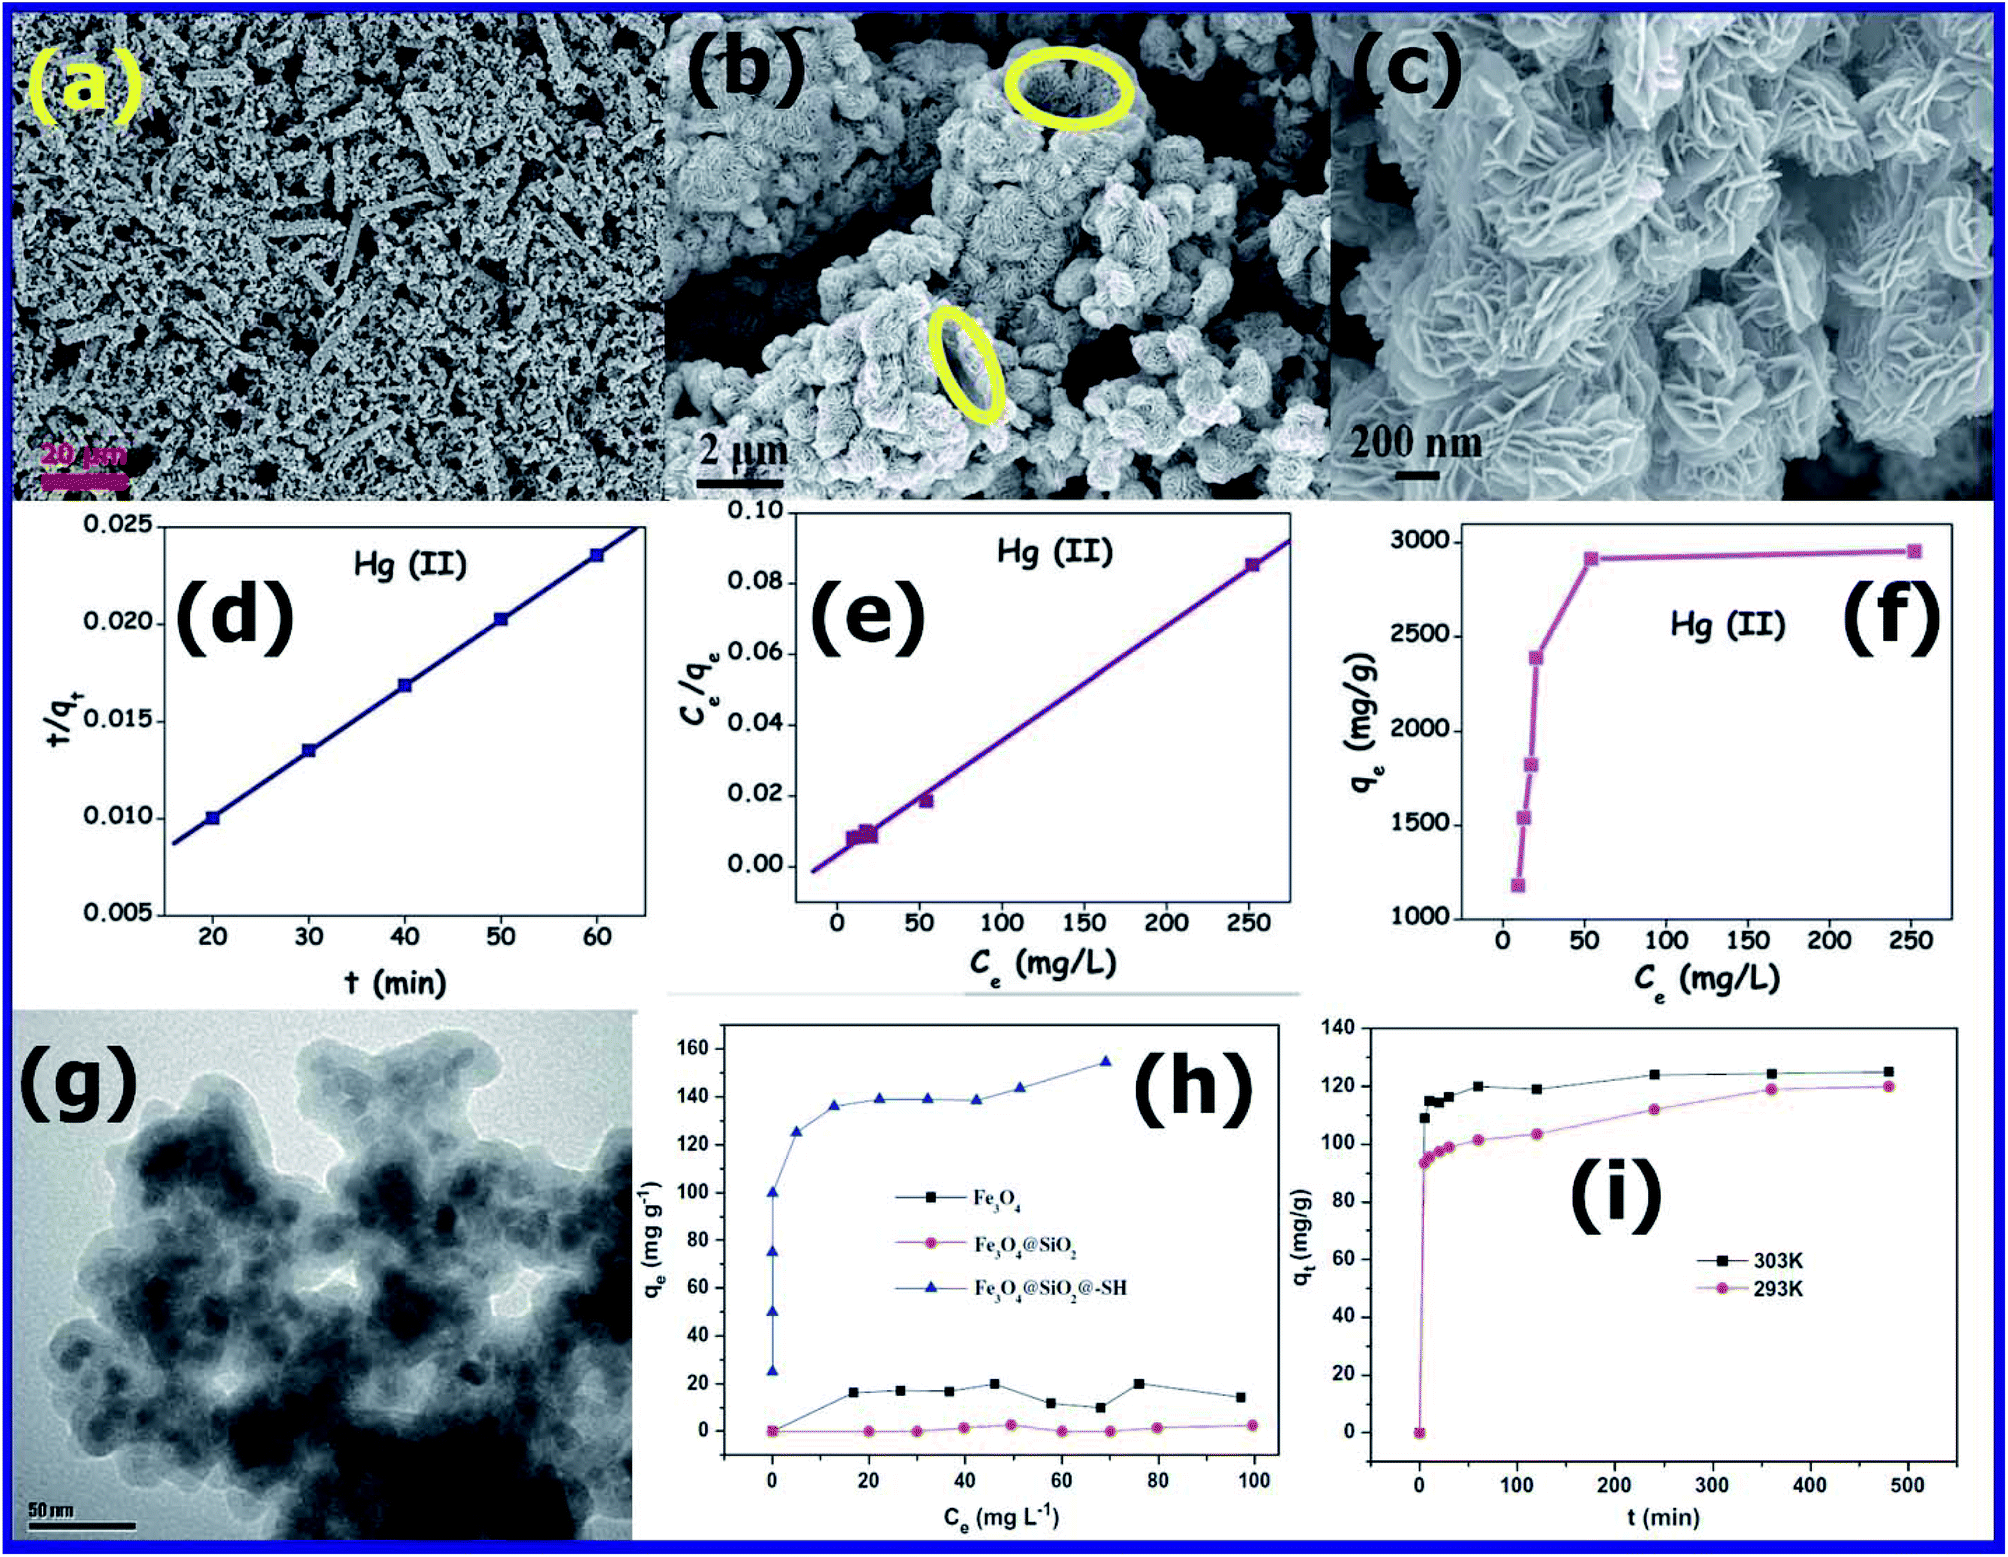 | ||
| Fig. 15 (a–c) FESEM images at different magnifications of the as-synthesized CuS product. (d) Pseudo-second-order kinetic plots, (e) Langmuir isotherm plots, and (f) adsorption isotherm plots of Hg(II) obtained using copper sulphide. (Reprinted with permission from [ref. 163] Copyright © (2015) the Royal Society of Chemistry.) (g) TEM image of Fe3O4@SiO2–SH. (h) Adsorption isotherms of mercury on Fe3O4, Fe3O4@SiO2 and Fe3O4@SiO2–SH. (i) Adsorption kinetics of mercury on Fe3O4@SiO2–SH. (Reprinted with permission from [ref. 164] Copyright © (2013) Elsevier B.V.) | ||
According to Pearson's hard soft acid–base theory (HSAB),165 it is very well understood that the Hg2+ ion has a strong affinity to form strong bonds with soft Lewis base groups, such as –CN, –RS, and –SH. Inspired by this, Shengxiao Zhang et al.164 prepared robust, stable, efficient, and super paramagnetic Fe3O4@SiO2–SH by covalently coating 3-mercapto propyl trimethoxy silane (3-MPTS) on silica-coated Fe3O4 nanoparticles (Fe3O4@SiO2). This novel mercapto-propyl-functionalized sorbent (Fe3O4@SiO2–SH) was successfully used for the removal of Hg2+ ions from solution. The TEM micrographs (Fig. 15(g)) of Fe3O4@SiO2–SH revealed that it consists of 10 nm nanoparticles with an irregular shape covered with a silica shell and thiol coating. The EDS spectrum of Fe3O4@SiO2–SH not only confirmed the presence of silica and Fe3O4, but also the very important peak of sulfur (2.64 wt%). The TEM and EDS results confirmed the successful coating of SiO2 and 3-MPTS on the Fe3O4 magnetic adsorbent. The adsorption of Hg2+ was studied using Fe3O4, Fe3O4@SiO2, and Fe3O4@SiO2–SH adsorbents and varying the initial concentration of Hg2+ from 5 ppm to 100 ppm. The adsorption experiments were performed by adding 50 mL metal ion solution to 100 mL polypropylene bottles. The concentration of metal ion was adjusted to 50 ppm with NaCl stock solution and the quantity of adsorbent used was 0.2 g L−1. The solution mixture was stirred for 4 h at 303 K to achieve the maximum adsorption. After stirring for 4 h, the bottle was kept on a magnet for 5 min to separate the adsorbent from the aqueous solution. Then the mercury concentration in the supernatant was determined using a flame atomic absorption spectrophotometer.164
The adsorption kinetics was studied by withdrawing a sample at the intervals of 5, 10, 20, 30, 60, 120, 240, 360, and 480 min. Further, by adding K+, Na+, and Ca2+ to the solution, the effects of coexisting cations on mercury adsorption was also investigated. According to Fig. 15(h), it was found that the adsorption efficiency of Fe3O4 and Fe3O4@SiO2 was much less compared to that of Fe3O4@SiO2–SH. The lower adsorption efficiency of Fe3O4 and Fe3O4@SiO2 can be ascribed to the lower affinity between the surface hydroxyl groups (hard Lewis base) and Hg2+ (soft acid). However, the high adsorption efficiency of Fe3O4@SiO2–SH can be ascribed to the strong bonding between the surface –SH group (soft base) and Hg2+ (soft acid). The adsorption results were in good agreement with the Langmuir model, which occurred as a monolayer. According to the Langmuir adsorption isotherm calculations, it was found that Fe3O4@SiO2–SH exhibited the maximum adsorption capacity (θ) for Hg2+ of about 148.8 mg g−1, which was found to be the best among the reported magnetic adsorbents such as Fe3O4/HA (97.7 mg g−1 at pH 6)166 and SH–HSM (140.1 mg g−1) sorbents.167
The effect of temperature on adsorption was also studied for 60 ppm of Hg2+ solution at pH 6.5. The adsorption rate of Hg2+ at two different temperatures of 293 and 303 K was recorded, as shown in Fig. 15(i). It was observed that for the adsorption process carried out at 303 K, the adsorption reached equilibrium in just 1 h, whereas for that carried out at 293 K, it was prolonged to 4 h. The high adsorption tendency at a higher temperature (303 K) can be due to the high mobility of Hg2+ ions towards surface bonding sites, and the adsorption was confirmed to be an endothermic reaction.
To explore the recyclability efficiency of the Fe3O4@SiO2–SH adsorbent, the adsorbed mercury was desorbed by a solution containing HCl and thiourea. After desorbing the adsorbed mercury, the sorbent was washed with pure water for further use. The adsorption capacity of Fe3O4@SiO2–SH in the first cycle was 130 mg g−1, which was found to decrease to 105 and 95 mg g−1 in the second and third cycles, respectively. Further, in the two subsequent cycles (fourth and fifth cycle), the adsorption capacity was found to be almost constant. The decrease in the adsorption efficiency in first two cycles was attributed to the decrease in the number of loosely held surface mercapto groups due to washing. However, due to the presence of strongly held mercapto groups to the silica surface, which remained firm during washing, the adsorption efficiency remained constant in the subsequent cycles.164
The various morphological architectures of inorganic nanoadsorbents studied for the adsorption of toxic Hg(II) ions in water are listed in Table 5. Among them, Fe3O4–SH168 and poly(1-vinylimidazole)-grafted Fe3O4@SiO2 nanoparticles169 were found to exhibit the maximum adsorption capacity of 344.82 and 346 mg g−1 for Hg(II) ions, respectively.
| Nano-adsorbent | Morphology/surface area | Max. removal capacity (mg g−1) | Ref. |
|---|---|---|---|
| Fe3O4@SiO2–SH | Nanoparticles | 132 | 170 |
| Thiolated CNT | Nanotubes | 105.2 | 171 |
| CuO | Nanoparticles | 28.2 | 172 |
| Sulfurized activated carbon | — | 58.9 | 173 |
| Activated carbon | — | 38.9 | 173 |
| Hydroxylapatite | — | 25.3 | 174 |
| Fe3O4–SH | Nanoparticles | 344.82 | 168 |
| poly(1-vinylimidazole)-grafted Fe3O4@SiO2 | Nanoparticles | 346 | 169 |
| Humic acid-coated Fe3O4 | Nanoparticles | 98 | 166 |
| Thiol-functionalized magnetite/graphene oxide hybrid | — | 290 | 175 |
| CoFe2O4-reduced graphene oxide | — | 158 | 176 |
| Naphthalimide-functionalized Fe3O4@SiO2 | Nanoparticles | 32 | 177 |
| Activated carbon from corn cob | Specific surface area of = 1054.2 m2 g−1 | 2.39 | 178 |
| Polyethylenimine-modified activated carbon derived from waste tires | Specific surface area of = 363 m2 g−1 | 16.39 | 179 |
| Pistachio wood waste-derived activated carbon | Well-developed pores like parallel and long channels | 201 | 180 |
| Specific surface area of = 1448 m2 g−1 | Specific surface area of = 1448 m2 g−1 | ||
| Bambusa vulgaris striata-derived activated carbon | Specific surface area of = 608 m2 g−1 | 248 | 181 |
| Bagasse pith | Specific surface area of = 537 m2 g−1 | 172 | 182 |
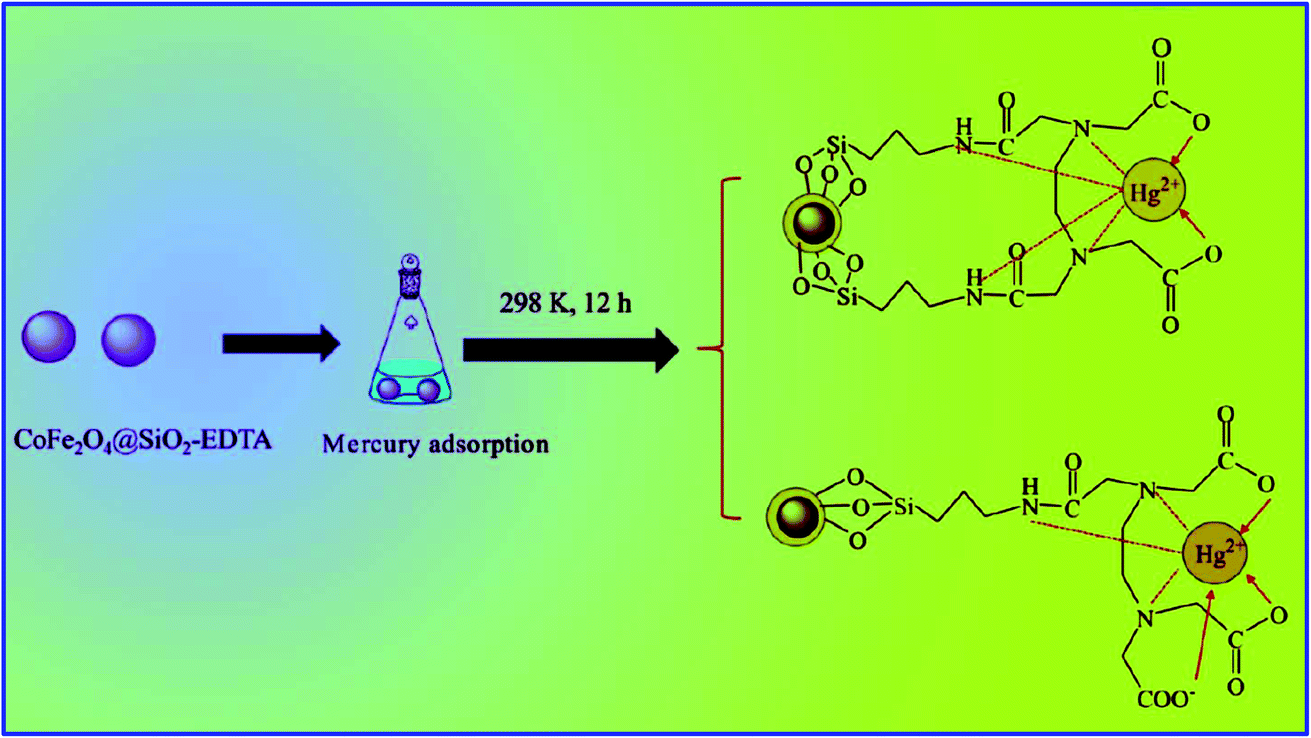 | ||
| Fig. 16 Schematic of the mechanism of the adsorption of Hg2+ by magnetic CoFe2O4@SiO2–EDTA adsorbent (ref. 183). | ||
5. Conclusion and future prospects
Herein, the severity of the toxicity and carcinogenicity of most commonly present hazardous toxic metal ions, such as arsenic (As3+), lead (Pb2+), chromium (Cr6+), cadmium (Cd2+), and mercury (Hg2+), were presented in detail. The mechanism of the toxicity and carcinogenicity of all these metal ions was systematically discussed. For removing these toxic metal ions, hierarchically structured inorganic nanoadsorbents having a high surface area developed by various research groups were carefully selected and their efficiencies were systematically explored. Among the various reported nanoadsorbents, the main focus was on promising nanoadsorbents for the removal of individual toxic metal ions such as α-Fe2O3 hollow nest-like spheres for As(V), MgO nanosheets for As(V), nZVI@Mg(OH)2 flower-like spheres for Pb(II), polymorphs of iron oxy hydroxides (α-FeOOH, β-FeOOH, γ-FeOOH, and δ-FeOOH) and CeO2 nanoadsorbents for Cr(VI), and MgO nanoflowers. Also, amine-functionalised CoFe2O4@SiO2–NH2 core shell nanostructures for Cd(II) and finally Fe3O4–SH and MPTS-grafted Fe3O4@SiO2@SH nanoparticles for Hg(II) ions together with other nanoadsorbents were highlighted.This review provided comprehensive information on oxide-based adsorbents possessing a high surface area with hierarchical architectures for water purification. However, the research for solving many issues related to heavy metal ions in water is still in its nascent stage, and therefore detailed investigations are required to establish the large-scale purification of water in real-life applications. It was observed that the MgO nanoadsorbent with different morphologies and different BET surface areas adsorbed different metal ions to different extents. The hierarchical MgO-400 nanosheets calcined at 400 °C with highest BET surface area of 194 m2 g−1 exhibited the maximum adsorption capacity of 545 mg g−1 for As(III) ions. MgO-flowers, with a BET surface area of 72 m2 g−1 exhibited the maximum adsorption capacity of 1980 mg g−1 for Pb(II) ions and 1500 mg g−1 for Cd(II) ions. This confirms that the adsorption tendency of nanoadsorbents does not just depend on their BET surface area, it depends on the hierarchy in their morphology and nature of active sites created on the surface of the adsorbent. Interestingly, it was found that the nanocomposites with a hierarchical morphology such as Fe3O4/Fe@ZnO nanospheres, Fe3O4/MnO2 flowers, MnO2/CNTs nanotubes, MoS2@Fe3O4 NP tiny particles, nZVI@Mg(OH)2 composite flower-like spheres, nZVI–zeolite composite chain-like structures and KMn8O16/α-Fe2O3 nanoboxes show potential as adsorbents for Pb(II) and Cr(VI) ions. Also, many researchers have attempted to study the influence of surface functionalisation on the adsorption tendency of magnetic nanoadsorbents. Functionalised nanosized magnetic particles such as humic acid-coated Fe3O4, thiol-functionalized magnetite/graphene oxide hybrid, naphthalimide-functionalized Fe3O4@SiO2, Fe3O4@SiO2–SH, and thiolated CNT have been reported to be potential nanoadsorbents for Hg(II) ions due to their easy removal and recovery using magnets.
In the future, researchers should focus on the development of low cost, eco-friendly, efficient nanoadsorbents with a high surface area and potential surface functional groups for the simultaneous removal of different metal ions and organic dyes present in wastewater. The nanoadsorbents should show a high adsorption efficiency over a wide range of pH and metal ion concentrations in the presence of multiple wastes such as toxic metal ions, organic dyes and bacterial pathogens. Furthermore, the nanoadsorbents should be able to produce on a large scale with low-cost, and recyclable. In addition to the adsorption method, different treatment technologies should be developed for the large-scale purification of water in order to solve the pure domestic water crisis worldwide.
Conflicts of interest
The author declare no conflict of interest.Acknowledgements
I would like to express my profound gratitude with greater respect to Sri Sadhguru: Yogi, Mystic, Visionary, Isha Foundation, India, [https://isha.sadhguru.org/in/en/sadhguru] for his powerful, life-transforming, inspirational and motivating talks and blessings, which always kept me motivated to complete this review single-handedly. I am also grateful to the Management RSST trust, Principal of RV College of Engineering, Bengaluru, India for their constant support and encouragement.References
- I. A. Rather, W. Y. Koh, W. K. Paek and J. Lim, Front. Pharmacol., 2017, 8, 1–18 CrossRef.
- M. Jena, C. Manjunatha, B. W. Shivaraj, G. Nagaraju, S. Ashoka and M. P. Sham Aan, Mater. Today Chem., 2019, 12, 187–199 CrossRef CAS.
- R. Das, C. D. Vecitis, A. Schulze, B. Cao, A. F. Ismail, X. Lu, J. Chen and S. Ramakrishna, Chem. Soc. Rev., 2017, 46, 6946–7020 RSC.
- L. A. Thompson and W. S. Darwish, J. Toxicol., 2019, 2345283 CAS.
- A. Gopinath, K. Krishna and C. Karthik, in Modern Age Waste Water Problems: Solutions Using Applied Nanotechnology, ed. M. Oves, M. O. Ansari, M. Zain Khan, M. Shahadat and I. M. I. Ismail, Springer International Publishing, Cham, 2020, pp. 309–328, DOI:10.1007/978-3-030-08283-3_15.
- C. Vidya, C. Manjunatha, M. N. Chandraprabha, R. Megha and M. A. L. Antony Raj, J. Environ. Chem. Eng., 2017, 5, 3172–3180 CrossRef CAS.
- M. M. Rahman, M. M. Hussain, M. N. Arshad and A. M. Asiri, RSC Adv., 2020, 10, 5316–5327 RSC.
- R. K. Gautam, S. K. Sharma, S. Mahiya and M. C. Chattopadhyaya, in Heavy Metals In Water: Presence, Removal and Safety, The Royal Society of Chemistry, 2015, pp. 1–24, 10.1039/9781782620174-00001.
- L. Järup, Br. Med. Bull., 2003, 68, 167–182 CrossRef.
- Z. Rahman and V. P. Singh, Environ. Monit. Assess., 2019, 191, 419 CrossRef.
- I. Zawierucha, C. Kozlowski and G. Malina, Environ. Sci.: Processes Impacts, 2016, 18, 429–444 RSC.
- P. Z. Ray and H. J. Shipley, RSC Adv., 2015, 5, 29885–29907 RSC.
- B. Kaur, R. Srivastava and B. Satpati, New J. Chem., 2015, 39, 5137–5149 RSC.
- A. T. Jan, M. Azam, K. Siddiqui, A. Ali, I. Choi and Q. M. Haq, Int. J. Mol. Sci., 2015, 16, 29592–29630 CrossRef CAS.
- M. Corradi and A. Mutti, in Metal Ions in Toxicology: Effects, Interactions, Interdependencies, The Royal Society of Chemistry, 2011, vol. 8, pp. 81–105 Search PubMed.
- R. A. Crane, D. J. Sapsford and A. Aderibigbe, in Resource Recovery from Wastes: Towards a Circular Economy, The Royal Society of Chemistry, 2020, pp. 266–286, 10.1039/9781788016353-00266.
- D. Bradshaw, S. El-Hankari and L. Lupica-Spagnolo, Chem. Soc. Rev., 2014, 43, 5431–5443 RSC.
- B. Fang, J. H. Kim, M.-S. Kim and J.-S. Yu, Acc. Chem. Res., 2013, 46, 1397–1406 CrossRef CAS.
- X.-Y. Yang, A. Léonard, A. Lemaire, G. Tian and B.-L. Su, Chem. Commun., 2011, 47, 2763–2786 RSC.
- L. Wang, C. Shi, L. Wang, L. Pan, X. Zhang and J.-J. Zou, Nanoscale, 2020, 12, 4790–4815 RSC.
- I. H. Chowdhury, A. H. Chowdhury, P. Bose, S. Mandal and M. K. Naskar, RSC Adv., 2016, 6, 6038–6047 RSC.
- G. J. P. Deblonde, T. D. Lohrey, D. D. An and R. J. Abergel, New J. Chem., 2018, 42, 7649–7658 RSC.
- W. He, K. Ai, X. Ren, S. Wang and L. Lu, J. Mater. Chem. A, 2017, 5, 19593–19606 RSC.
- L. A. Malik, A. Bashir, T. Manzoor and A. H. Pandith, RSC Adv., 2019, 9, 15976–15985 RSC.
- C. Ray, S. Sarkar, S. Dutta, A. Roy, R. Sahoo, Y. Negishi and T. Pal, RSC Adv., 2015, 5, 12446–12453 RSC.
- M. H. Omidi, M. H. Ahmadi Azqhandi and B. Ghalami-Choobar, New J. Chem., 2018, 42, 16307–16328 RSC.
- H. Wang, Y.-F. Yu, Q.-W. Chen and K. Cheng, Dalton Trans., 2011, 40, 559–563 RSC.
- P. Bhunia, G. Kim, C. Baik and H. Lee, Chem. Commun., 2012, 48, 9888–9890 RSC.
- D. Chakraborti, M. M. Rahman, A. Chatterjee, D. Das, B. Das, B. Nayak, A. Pal, U. K. Chowdhury, S. Ahmed and B. K. Biswas, J. Trace Elem. Med. Biol., 2016, 38, 33–45 CrossRef CAS.
- G. F. de Mattos, C. Costa, F. Savio, M. Alonso and G. Nicolson, Biophys. Rev., 2017, 9, 807–825 CrossRef.
- P. B. Tchounwou, J. A. Centeno and A. K. Patlolla, Mol. Cell. Biochem., 2004, 255, 47–55 CrossRef CAS.
- M. F. Naujokas, B. Anderson, H. Ahsan, H. V. Aposhian, J. H. Graziano, C. Thompson and W. A. Suk, Environ. Health Perspect., 2013, 121, 295–302 CrossRef CAS.
- A. Arita and M. Costa, Metallomics, 2009, 1, 222–228 RSC.
- H. Kahmepinh, Professor indicted on arsenic poisoning charges, http://www.ekathimerini.com/218447/article/ekathimerini/news/professor-indicted-on-arsenic-poisoning-charges, accessed 17 May, 2020 Search PubMed.
- R. Wilson, One Solution to the Arsenic Problem: A Return to Surface (Improved Dug) Wells, Harvard University, http://wilsonweb.physics.harvard.edu/arsenic/Arsenic%20Foundation.html, accessed 18 May, 2020 Search PubMed.
- C. Muanya, Lead poisoning associated with intellectual disabilities in children (Science & Technology), https://guardian.ng/features/lead-poisoning-associated-with-intellectual-disabilities-in-children/, accessed 18 May, 2020 Search PubMed.
- J. G. Vanessa Ngan, Chrome allergy, https://dermnetnz.org/topics/chrome-allergy, accessed 18 May, 2020 Search PubMed.
- T. Gray, Element coin. An example of the element Cadmium, https://periodictable.com/Items/082.28/index.html, accessed 18 May, 2020 Search PubMed.
- Common Chemical Exposures and Impacts on Human Health, https://sanjosefuncmed.com/common-chemical-exposures-and-impacts-on-human-health/, accessed 18 May, 2020 Search PubMed.
- D. Jockers, How to Detox Heavy Metals, https://drjockers.com/detox-heavy-metals, accessed 18 May, 2020 Search PubMed.
- X. Gao, R.-x. He, S.-g. Yan and L.-d. Wu, Journal of Arthroplasty, 2011, 26, 665.e13–665.e16 Search PubMed.
- L. C. Price, Mercury Poisoning Among Indonesian Mining Communities, https://pulitzercenter.org/reporting/mercury-poisoning-among-indonesian-mining-communities#slideshow-16, accessed 19 May, 2020 Search PubMed.
- S. M. Cohen, L. L. Arnold and J. S. Tsuji, Current Opinion in Toxicology, 2019, 14, 8–13 CrossRef.
- K. K. Sodhi, M. Kumar, P. K. Agrawal and D. K. Singh, Environ. Technol. Innov., 2019, 100462 CrossRef.
- M. Shri, P. K. Singh, M. Kidwai, N. Gautam, S. Dubey, G. Verma and D. Chakrabarty, Metallomics, 2019, 11, 519–532 RSC.
- W. A. Pott, S. A. Benjamin and R. S. Yang, in Reviews of environmental contamination and toxicology, Springer, 2001, pp. 165–214 Search PubMed.
- D. Ferrario, C. Croera, R. Brustio, A. Collotta, G. Bowe, M. Vahter and L. Gribaldo, Toxicology, 2008, 249, 102–108 CrossRef CAS.
- M. F. Hughes, Toxicol. Lett., 2002, 133, 1–16 CrossRef CAS.
- S. H. Mudd, J. T. Brosnan, M. E. Brosnan, R. L. Jacobs, S. P. Stabler, R. H. Allen, D. E. Vance and C. Wagner, Am. J. Clin. Nutr., 2007, 85, 19–25 CrossRef CAS.
- V. Rodrıguez, M. E. Jimenez-Capdeville and M. Giordano, Toxicol. Lett., 2003, 145, 1–18 CrossRef.
- T. Watanabe and S. Hirano, Arch. Toxicol., 2013, 87, 969–979 CrossRef CAS.
- M. Jaishankar, T. Tseten, N. Anbalagan, B. B. Mathew and K. N. Beeregowda, Interdiscip. Toxicol., 2014, 7, 60–71 Search PubMed.
- S. Wei, H. Zhang and S. Tao, Toxicol. Res., 2019, 8, 319–327 CrossRef CAS.
- F. Henkler, J. Brinkmann and A. Luch, Cancers, 2010, 2, 376–396 CrossRef CAS.
- T. Sanders, Y. Liu, V. Buchner and P. B. Tchounwou, Rev. Environ. Health, 2009, 24, 15–46 CAS.
- W. Jedrychowski, F. P. Perera, J. Jankowski, D. Mrozek-Budzyn, E. Mroz, E. Flak, S. Edwards, A. Skarupa and I. Lisowska-Miszczyk, Neuroepidemiology, 2009, 32, 270–278 Search PubMed.
- M. O. Min, L. T. Singer, H. L. Kirchner, S. Minnes, E. Short, Z. Hussain and S. Nelson, Neurotoxicol. Teratol., 2009, 31, 225–231 CrossRef CAS.
- R. G. Lucchini, S. Zoni, S. Guazzetti, E. Bontempi, S. Micheletti, K. Broberg, G. Parrinello and D. R. Smith, Environ. Res., 2012, 118, 65–71 CrossRef CAS.
- L. Shi, N. Wang, X. Hu, D. Yin, C. Wu, H. Liang, W. Cao and H. Cao, Environ. Toxicol. Pharmacol., 2020, 78, 103385 CrossRef CAS.
- P. B. Tchounwou, C. G. Yedjou, D. N. Foxx, A. B. Ishaque and E. Shen, Mol. Cell. Biochem., 2004, 255, 161–170 CrossRef CAS.
- H. Zhang, K. Wei, M. Zhang, R. Liu and Y. Chen, J. Photochem. Photobiol., B, 2014, 136, 46–53 CrossRef CAS.
- M. K. Galal, E. M. Elleithy, M. I. Abdrabou, N. A. Yasin and Y. M. Shaheen, NeuroToxicology, 2019, 72, 15–28 CrossRef CAS.
- K. E. Wetterhahn, J. W. Hamilton, J. Aiyar, K. M. Borges and R. Floyd, Biol. Trace Elem. Res., 1989, 21, 405 CrossRef CAS.
- J. Ye, X. Zhang, H. A. Young, Y. Mao and X. Shi, Carcinogenesis, 1995, 16, 2401–2405 CrossRef CAS.
- K. Yatera, Y. Morimoto, S. Ueno, S. Noguchi, T. Kawaguchi, F. Tanaka, H. Suzuki and T. Higashi, J. UOEH, 2018, 40, 157–172 CrossRef CAS.
- G. A. Lamas, A. Navas-Acien, D. B. Mark and K. L. Lee, J. Am. Coll. Cardiol., 2016, 67, 2411–2418 CrossRef.
- R. Lindenschmidt, L. Sendelbach, H. Witschi, D. Price, J. Fleming and J. Joshi, Toxicol. Appl. Pharmacol., 1986, 82, 344–350 CrossRef CAS.
- J. M. Castagnetto, S. W. Hennessy, V. A. Roberts, E. D. Getzoff, J. A. Tainer and M. E. Pique, Nucleic Acids Res., 2002, 30, 379–382 CrossRef CAS.
- E. Casalino, G. Calzaretti, C. Sblano and C. Landriscina, Toxicology, 2002, 179, 37–50 CrossRef CAS.
- T. W. Clarkson and L. Magos, Crit. Rev. Toxicol., 2006, 36, 609–662 CrossRef CAS.
- L. F. Oliveira, L. D. Rodrigues, G. M. Cardillo, M. B. Nejm, M. Guimarães-Marques, S. Z. Reyes-Garcia, K. Zuqui, D. V. Vassallo, A. C. Fiorini and C. A. Scorza, Environ. Sci. Pollut. Res., 2020, 27, 7559–7569 CrossRef CAS.
- F. Coppola, A. Bessa, B. Henriques, T. Russo, A. M. Soares, E. Figueira, P. A. Marques, G. Polese, A. Di Cosmo and E. Pereira, Comp. Biochem. Physiol., Part A: Mol. Integr. Physiol., 2020, 243, 110674 CrossRef CAS.
- M. Yoshida, C. Watanabe, M. Kishimoto, A. Yasutake, M. Satoh, M. Sawada and Y. Akama, Toxicol. Lett., 2006, 161, 210–218 CrossRef CAS.
- M. Aschner and J. L. Aschner, Neurosci. Biobehav. Rev., 1990, 14, 169–176 CrossRef CAS.
- J. Albrecht and E. Matyja, Metab. Brain Dis., 1996, 11, 175–184 CrossRef CAS.
- H. Steinbrenner, B. Speckmann and L.-O. Klotz, Arch. Biochem. Biophys., 2016, 595, 113–119 CrossRef CAS.
- R. Zefferino, C. Piccoli, N. Ricciardi, R. Scrima and N. Capitanio, Oxidative medicine and cellular longevity, 2017, vol. 2017 Search PubMed.
- J. R. H. Ross, in Contemporary Catalysis, ed. J. R. H. Ross, Elsevier, Amsterdam, 2019, pp. 39–68, DOI:10.1016/b978-0-444-63474-0.00002-3.
- J. B. Condon, in Surface Area and Porosity Determinations by Physisorption, ed. J. B. Condon, Elsevier, 2nd edn, 2020, pp. 1–57, DOI:10.1016/b978-0-12-818785-2.00001-5.
- M. Ahumada, C. Lazurko and E. I. Alarcon, in Photoactive Inorganic Nanoparticles, ed. J. P. Prieto and M. G. Béjar, Elsevier, 2019, DOI:10.1016/b978-0-12-814531-9.00001-4, pp. 1–19.
- S. Liu, in Bioprocess Engineering, ed. S. Liu, Elsevier, 3rd edn, 2020, pp. 291–350, DOI:10.1016/b978-0-12-821012-3.00008-7.
- S. S. Gupta and K. G. Bhattacharyya, Phys. Chem. Chem. Phys., 2012, 14, 6698–6723 RSC.
- J. Zhao and M.-C. He, Appl. Surf. Sci., 2014, 317, 718–723 CrossRef CAS.
- J. Wang, S. Xia and L. Yu, Appl. Surf. Sci., 2015, 339, 28–35 CrossRef CAS.
- L. Qin, L. Yan, J. Chen, T. Liu, H. Yu and B. Du, Ind. Eng. Chem. Res., 2016, 55, 7344–7354 CrossRef CAS.
- L. Wang, C. Shi, L. Pan, X. Zhang and J.-J. Zou, Nanoscale, 2020, 12, 4790–4815 RSC.
- S. De Gisi, G. Lofrano, M. Grassi and M. Notarnicola, Sustainable Mater. Technol., 2016, 9, 10–40 CrossRef CAS.
- G. K. Sarma, S. S. Gupta and K. G. Bhattacharyya, Environ. Sci. Pollut. Res., 2019, 26, 6245–6278 CrossRef CAS.
- S. Srivastava and S. J. S. Flora, in Handbook of Toxicology of Chemical Warfare Agents, ed. R. C. Gupta, Academic Press, Boston, 3rd edn, 2020, pp. 303–319, DOI:10.1016/b978-0-12-819090-6.00021-0.
- S. Yang, P. Huang, L. Peng, C. Cao, Y. Zhu, F. Wei, Y. Sun and W. Song, J. Mater. Chem. A, 2016, 4, 400–406 RSC.
- S. Purwajanti, L. Zhou, Y. Ahmad Nor, J. Zhang, H. Zhang, X. Huang and C. Yu, ACS Appl. Mater. Interfaces, 2015, 7, 21278–21286 CrossRef CAS.
- Z. Wei, R. Xing, X. Zhang, S. Liu, H. Yu and P. Li, ACS Appl. Mater. Interfaces, 2013, 5, 598–604 CrossRef CAS.
- L.-B. Zhong, Q. Liu, J.-Q. Zhu, Y.-S. Yang, J. Weng, P. Wu and Y.-M. Zheng, ACS Sustainable Chem. Eng., 2018, 6, 2991–3001 CrossRef CAS.
- H. Li, W. Li, Y. Zhang, T. Wang, B. Wang, W. Xu, L. Jiang, W. Song, C. Shu and C. Wang, J. Mater. Chem., 2011, 21, 7878–7881 RSC.
- G. Zelmanov and R. Semiat, Water Res., 2008, 42, 492–498 CrossRef CAS.
- C.-Y. Cao, J. Qu, W.-S. Yan, J.-F. Zhu, Z.-Y. Wu and W.-G. Song, Langmuir, 2012, 28, 4573–4579 CrossRef CAS.
- B. Wang, H. Wu, L. Yu, R. Xu, T. T. Lim and X. W. Lou, Adv. Mater., 2012, 24, 1111–1116 CrossRef CAS.
- L.-S. Zhong, J.-S. Hu, A.-M. Cao, Q. Liu, W.-G. Song and L.-J. Wan, Chem. Mater., 2007, 19, 1648–1655 CrossRef CAS.
- C.-Y. Cao, Z.-M. Cui, C.-Q. Chen, W.-G. Song and W. Cai, J. Phys. Chem. C, 2010, 114, 9865–9870 CrossRef CAS.
- Z. Zhao, J. Liu, F. Cui, H. Feng and L. Zhang, J. Mater. Chem., 2012, 22, 9052–9057 RSC.
- H.-J. Cui, J.-K. Cai, H. Zhao, B. Yuan, C.-L. Ai and M.-L. Fu, J. Hazard. Mater., 2014, 279, 26–31 CrossRef CAS.
- M. Kalaruban, P. Loganathan, T. V. Nguyen, T. Nur, M. A. H. Johir, T. H. Nguyen, M. V. Trinh and S. Vigneswaran, J. Environ. Manage., 2019, 239, 235–243 CrossRef CAS.
- R. Sawana, Y. Somasundar, V. S. Iyer and B. Baruwati, Appl. Water Sci., 2017, 7, 1223–1230 CrossRef CAS.
- Y. Yu, C. Zhang, L. Yang and J. P. Chen, Chem. Eng. J., 2017, 315, 630–638 CrossRef CAS.
- E. L. Morifi, A. E. Ofomaja and K. Pillay, J. Environ. Chem. Eng., 2020, 8, 103822 CrossRef CAS.
- X. Luo, Z. Huang, J. Lin, X. Li, J. Qiu, J. Liu and X. Mao, J. Cleaner Prod., 2020, 258, 120991 CrossRef CAS.
- Y. Guo, H. Guo, Y. Wang, L. Liu and W. Chen, RSC Adv., 2014, 4, 14048–14054 RSC.
- M. Liu, Y. Wang, L. Chen, Y. Zhang and Z. Lin, ACS Appl. Mater. Interfaces, 2015, 7, 7961–7969 CrossRef CAS.
- Q. Mo, J. Wei, K. Jiang, Z. Zhuang and Y. Yu, ACS Sustainable Chem. Eng., 2017, 5, 1476–1484 CrossRef CAS.
- C.-Y. Cao, J. Qu, F. Wei, H. Liu and W.-G. Song, ACS Appl. Mater. Interfaces, 2012, 4, 4283–4287 CrossRef CAS.
- S. A. Kim, S. Kamala-Kannan, K.-J. Lee, Y.-J. Park, P. J. Shea, W.-H. Lee, H.-M. Kim and B.-T. Oh, Chem. Eng. J., 2013, 217, 54–60 CrossRef CAS.
- M. Arshadi, M. Soleymanzadeh, J. Salvacion and F. SalimiVahid, J. Colloid Interface Sci., 2014, 426, 241–251 CrossRef CAS.
- X. Zhang, S. Lin, X.-Q. Lu and Z.-l. Chen, Chem. Eng. J., 2010, 163, 243–248 CrossRef CAS.
- M. Kan, X. Qian, T. Zhang, D. Yue and Y. Zhao, ACS Sustainable Chem. Eng., 2017, 5, 10940–10946 CrossRef CAS.
- H.-J. Cui, J.-W. Shi, B. Yuan and M.-L. Fu, J. Mater. Chem. A, 2013, 1, 5902–5907 RSC.
- N. N. Nassar, A. Hassan and P. Pereira-Almao, Energy Fuels, 2011, 25, 1017–1023 CrossRef CAS.
- J.-R. Fu, J. Zheng, W.-J. Fang, C. Chen, C. Cheng, R.-W. Yan, S.-G. Huang and C.-C. Wang, J. Alloys Compd., 2015, 650, 463–469 CrossRef CAS.
- E.-J. Kim, C.-S. Lee, Y.-Y. Chang and Y.-S. Chang, ACS Appl. Mater. Interfaces, 2013, 5, 9628–9634 CrossRef CAS.
- S.-B. Ma, K.-Y. Ahn, E.-S. Lee, K.-H. Oh and K.-B. Kim, Carbon, 2007, 45, 375–382 CrossRef CAS.
- S. Ravulapalli and R. Kunta, J. Environ. Chem. Eng., 2018, 6, 4298–4309 CrossRef CAS.
- M. Imamoglu and O. Tekir, Desalination, 2008, 228, 108–113 CrossRef CAS.
- E. Asuquo, A. Martin, P. Nzerem, F. Siperstein and X. Fan, J. Environ. Chem. Eng., 2017, 5, 679–698 CrossRef CAS.
- J. Nonkumwong, S. Ananta and L. Srisombat, RSC Adv., 2016, 6, 47382–47393 RSC.
- C. Yu, Z. Shao and H. Hou, Chem. Sci., 2017, 8, 7611–7619 RSC.
- S. Wu, J. Lu, Z. Ding, N. Li, F. Fu and B. Tang, RSC Adv., 2016, 6, 82118–82130 RSC.
- J. Yue, X. Jiang, Y. V. Kaneti and A. Yu, J. Colloid Interface Sci., 2012, 367, 204–212 CrossRef CAS.
- D. Maiti and P. S. Devi, Mater. Chem. Phys., 2015, 154, 144–151 CrossRef CAS.
- M. C. S. Faria, R. S. Rosemberg, C. A. Bomfeti, D. S. Monteiro, F. Barbosa, L. C. A. Oliveira, M. Rodriguez, M. C. Pereira and J. L. Rodrigues, Chem. Eng. J., 2014, 237, 47–54 CrossRef CAS.
- P. Chagas, A. C. Da Silva, E. C. Passamani, J. D. Ardisson, L. C. A. de Oliveira, J. D. Fabris, R. M. Paniago, D. S. Monteiro and M. C. Pereira, J. Nanopart. Res., 2013, 15(1544), 1–7 Search PubMed.
- A. S. Krishna Kumar, S.-J. Jiang and J. K. Warchoł, ACS Omega, 2017, 2, 6187–6200 CrossRef CAS.
- I. Ghiloufi, J. El Ghoul, A. Modwi and L. El Mir, Mater. Sci. Semicond. Process., 2016, 42, 102–106 CrossRef CAS.
- J. H. Min, M.-K. Woo, H. Y. Yoon, J. W. Jang, J. H. Wu, C.-S. Lim and Y. K. Kim, Anal. Biochem., 2014, 447, 114–118 CrossRef CAS.
- S. R. Chowdhury and E. K. Yanful, J. Environ. Manage., 2010, 91, 2238–2247 CrossRef CAS.
- Y. Mu, Z. Ai, L. Zhang and F. Song, ACS Appl. Mater. Interfaces, 2015, 7, 1997–2005 CrossRef CAS.
- A. Kumar and H. M. Jena, J. Environ. Chem. Eng., 2017, 5, 2032–2041 CrossRef CAS.
- Y. Abshirini, R. Foroutan and H. Esmaeili, Mater. Res. Express, 2019, 6, 045607 CrossRef.
- L. Niazi, A. Lashanizadegan and H. Sharififard, J. Cleaner Prod., 2018, 185, 554–561 CrossRef CAS.
- F. Ghorbani, S. Kamari, S. Zamani, S. Akbari and M. Salehi, Surf. Interfaces, 2020, 18, 100444 CrossRef.
- M. Fazlzadeh, R. Khosravi and A. Zarei, Ecological Engineering, 2017, 103, 180–190 CrossRef.
- Z. Hajizadeh, K. Valadi, R. Taheri-Ledari and A. Maleki, ChemistrySelect, 2020, 5, 2441–2448 CrossRef CAS.
- Y. Wang, R. Zhou, C. Wang, G. Zhou, C. Hua, Y. Cao and Z. Song, J. Alloys Compd., 2020, 817, 153286 CrossRef CAS.
- V. Litrenta Medeiros, L. G. de Araujo, D. Rubinho Ratero, A. Silva Paula, E. Ferreira Molina, C. Jaeger, J. T. Marumo and J. G. Nery, J. Environ. Chem. Eng., 2020, 8, 103922 CrossRef CAS.
- C. Ren, X. Ding, H. Fu, C. Meng, W. Li and H. Yang, RSC Adv., 2016, 6, 72479–72486 RSC.
- L. Sun, Y. Li, M. Sun, H. Wang, S. Xu, C. Zhang and Q. Yang, New J. Chem., 2011, 35, 2697–2704 RSC.
- M. Shao, F. Ning, J. Zhao, M. Wei, D. G. Evans and X. Duan, J. Am. Chem. Soc., 2012, 134, 1071–1077 CrossRef CAS.
- L. Yang, P. Zou, J. Cao, Y. Sun, D. Han, S. Yang, G. Chen, X. Kong and J. Yang, Superlattices Microstruct., 2014, 76, 205–212 CrossRef CAS.
- Y. Ni, K. Mi, C. Cheng, J. Xia, X. Ma and J. Hong, Chem. Commun., 2011, 47, 5891–5893 RSC.
- Z. Zhao, X. Zhang, H. Zhou, G. Liu, M. Kong and G. Wang, Microporous Mesoporous Mater., 2017, 242, 50–58 CrossRef CAS.
- K. Chen, J. He, Y. Li, X. Cai, K. Zhang, T. Liu, Y. Hu, D. Lin, L. Kong and J. Liu, J. Colloid Interface Sci., 2017, 494, 307–316 CrossRef CAS.
- Y. Ren, H. A. Abbood, F. He, H. Peng and K. Huang, Chem. Eng. J., 2013, 226, 300–311 CrossRef CAS.
- M. Zhang, W. Song, Q. Chen, B. Miao and W. He, ACS Appl. Mater. Interfaces, 2015, 7, 1533–1540 CrossRef CAS.
- F. Ciesielczyk, P. Bartczak and T. Jesionowski, Desalin. Water Treat., 2015, 55, 1271–1284 CAS.
- K. E. Engates and H. J. Shipley, Environ. Sci. Pollut. Res., 2011, 18, 386–395 CrossRef CAS.
- Q. Su, B. Pan, S. Wan, W. Zhang and L. Lv, J. Colloid Interface Sci., 2010, 349, 607–612 CrossRef CAS.
- A. Afkhami, M. Saber-Tehrani and H. Bagheri, J. Hazard. Mater., 2010, 181, 836–844 CrossRef CAS.
- M. M. A. El-Latif, A. M. Ibrahim, M. S. Showman and R. R. A. Hamide, Int. J. Nonferrous Metall., 2013, 2, 47–63 CrossRef.
- A. Roy and J. Bhattacharya, Sep. Purif. Technol., 2013, 115, 172–179 CrossRef CAS.
- X. Xie, H. Gao, X. Luo, T. Su, Y. Zhang and Z. Qin, J. Environ. Chem. Eng., 2019, 7, 103183 CrossRef.
- R. Zha, R. Nadimicherla and X. Guo, J. Mater. Chem. A, 2014, 2, 13932–13941 RSC.
- P. S. Subana, C. Manjunatha, M. Rao, B. Venkateswarlu, G. Nagaraju and R. Suresh, Surf. Interfaces, 2020, 100680 Search PubMed.
- M. Ashraf, I. Khan, M. Usman, A. Khan, S. S. Shah, A. Z. Khan, K. Saeed, M. Yaseen, M. F. Ehsan, M. N. Tahir and N. Ullah, Chem. Res. Toxicol., 2020, 33(6), 1292–1311 Search PubMed.
- A. Esrafili, M. Ghambarian, M. Tajik and M. Baharfar, Anal. Methods, 2020, 12, 2279–2286 RSC.
- C. Ray, S. Sarkar, S. Dutta, A. Roy, R. Sahoo, Y. Negishi and T. Pal, RSC Adv., 2015, 5, 12446–12453 RSC.
- Y. Zhang, Q. Xu, S. Zhang, J. Liu, J. Zhou, H. Xu, H. Xiao and J. Li, Chem. Eng. J., 2013, 226, 30–38 CrossRef.
- R. G. Pearson, J. Am. Chem. Soc., 1963, 85, 3533–3539 CrossRef CAS.
- J.-F. Liu, Z.-S. Zhao and G.-B. Jiang, Environ. Sci. Technol., 2008, 42, 6949–6954 CrossRef CAS.
- W. Shi, S. Tao, Y. Yu, Y. Wang and W. Ma, J. Mater. Chem., 2011, 21, 15567–15574 RSC.
- F. Oveisi, M. Nikazar, M. H. Razzaghi, M. A.-S. Mirrahimi and M. T. Jafarzadeh, Environmental Nanotechnology, Monitoring & Management, 2017, 7, 130–138 Search PubMed.
- C. Shan, Z. Ma, M. Tong and J. Ni, Water Res., 2015, 69, 252–260 CrossRef CAS.
- Z. Wang, J. Xu, Y. Hu, H. Zhao, J. Zhou, Y. Liu, Z. Lou and X. Xu, J. Taiwan Inst. Chem. Eng., 2016, 60, 394–402 CrossRef CAS.
- M. Hadavifar, N. Bahramifar, H. Younesi and Q. Li, Chem. Eng. J., 2014, 237, 217–228 CrossRef CAS.
- S. Sahinkaya, Process Saf. Environ. Prot., 2015, 93, 201–205 CrossRef CAS.
- N. Asasian, T. Kaghazchi, A. Faramarzi, A. Hakimi-Siboni, R. Asadi-Kesheh, M. Kavand and S.-A. Mohtashami, J. Taiwan Inst. Chem. Eng., 2014, 45, 1588–1596 CrossRef CAS.
- Y. Kim and Y. J. Lee, J. Colloid Interface Sci., 2014, 430, 193–199 CrossRef CAS.
- J. Bao, Y. Fu and Z. Bao, Nanoscale Res. Lett., 2013, 8, 1–6 CrossRef.
- Y. Zhang, L. Yan, W. Xu, X. Guo, L. Cui, L. Gao, Q. Wei and B. Du, J. Mol. Liq., 2014, 191, 177–182 CrossRef CAS.
- B. Zhu, J. Zhao, H. Yu, L. Yan, Q. Wei and B. Du, Chem. Eng. J., 2013, 219, 411–418 CrossRef CAS.
- Z. Liu, Y. Sun, X. Xu, X. Meng, J. Qu, Z. Wang, C. Liu and B. Qu, Bioresour. Technol., 2020, 306, 123154 CrossRef CAS.
- T. A. Saleh, A. Sarı and M. Tuzen, J. Environ. Chem. Eng., 2017, 5, 1079–1088 CrossRef CAS.
- S.-A. Sajjadi, A. Mohammadzadeh, H. N. Tran, I. Anastopoulos, G. L. Dotto, Z. R. Lopičić, S. Sivamani, A. Rahmani-Sani, A. Ivanets and A. Hosseini-Bandegharaei, J. Environ. Manage., 2018, 223, 1001–1009 CrossRef CAS.
- P. González and Y. Pliego-Cuervo, Chem. Eng. Res. Des., 2014, 92, 2715–2724 CrossRef.
- K. A. Krishnan and T. Anirudhan, J. Hazard. Mater., 2002, 92, 161–183 CrossRef.
- K. Xia, Y. Guo, Q. Shao, Q. Zan and R. Bai, Nanomaterials, 2019, 9, 1532 CrossRef CAS.
| This journal is © The Royal Society of Chemistry 2020 |