 Open Access Article
Enhancing the brightness and saturation of noniridescent structural colors by optimizing the grain size†
Ning
Sun
a,
Xianglei
Liu
 b,
Yan
Liu
 c,
Rui
Zhao
a,
Zhengzheng
Xu
a,
Shuangxin
Li
a,
Jianshe
Lian
 a,
Qing
Jiang
 a and
Guoyong
Wang
 *ab
*ab
aKey Laboratory of Automobile Materials, Department of Materials Science and Engineering, Jilin University, 5988 Renmin Street, Changchun, 130025, China
bNational Key Laboratory of Science and Technology on Helicopter Transmission, Nanjing University of Aeronautics and Astronautics, Nanjing, 210016, China
cKey Laboratory of Bionic Engineering (Ministry of Education), State Key Laboratory of Automotive Simulation and Control, Jilin University, 5988 Renmin Street, Changchun 130025, China
First published on 14th September 2020
Abstract
Using structural colors instead of pigment colors has many advantages, both environmentally and economically. However, the traditional process of eliminating structural iridescence often causes a decrease in color brightness and saturation. For a periodic optical structure having a refractive-index difference, it is necessary to pile up a certain number of layers to make the maximum reflectivity reach almost unity and obtain the minimal bandwidth. Therefore, the amorphization process inevitably leads to a decrease in the brightness and saturation of the structural color, as the short-range order domain is too small. In this paper, the concept of the polycrystallization process and corresponding method are introduced, by which a polycrystalline structure with an optimal grain size is built using silica nano-spheres. This structure guarantees the best brightness and saturation of the color at a low viewing angle, while eliminating the reflection of other colors at a high viewing angle. Subsequent graphene doping and superhydrophobic treatment enable the structural color to maintain its brilliant color for a long time even in an intensive harsh environment, such as on white substrates under high humidity conditions.
Introduction
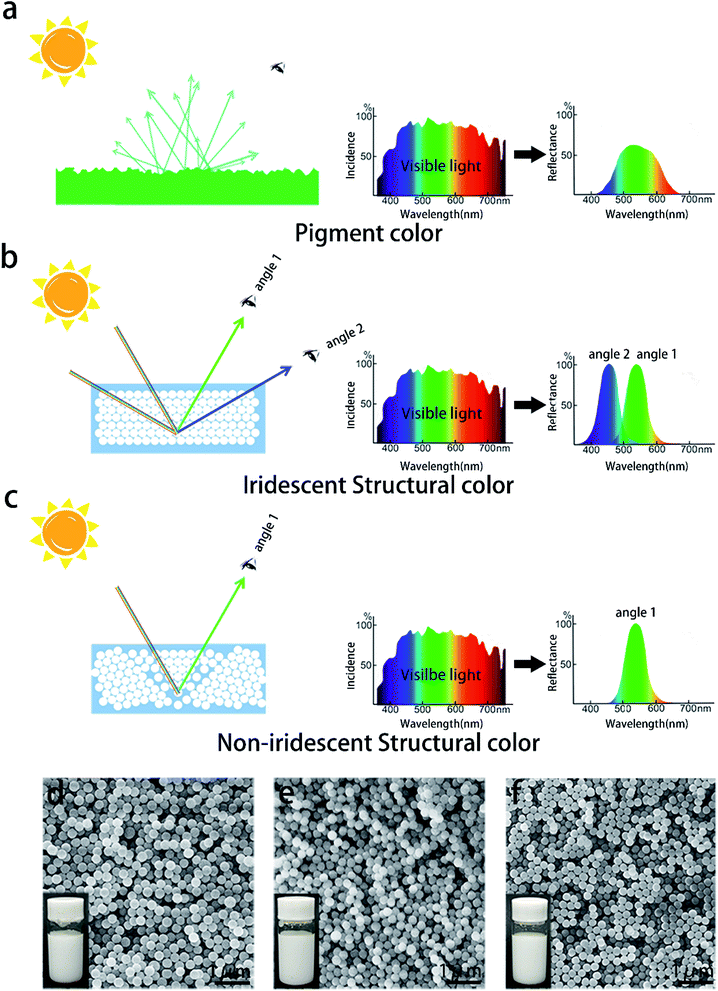
Currently, the color of an artificial product heavily depends on pigments. A pigment can selectively reflect or scatter sunlight with a particular wavelength while the rest of the sunlight is absorbed by it, as shown in Fig. 1a.1 The colors of most pigments generally have low brightness and unsatisfactory saturation due to the surface scattering and insufficient selectivity of light with a certain wavelength.2 Sometimes, people even have to endure the toxicity of certain pigments in order to obtain a suitable color.3,4 Sunlight can also be selectively reflected by a kind of material named photonic crystals (PCs), consisting of a dielectric microstructure with a periodic optical structure, as shown in Fig. 1b.2 Based on a pseudo- or complete photonic bandgap (PBG) by Bragg reflection of light, they can exhibit brilliant structural colors. A color of a particular wavelength in sunlight, which satisfies the Bragg–Snell equation, would be reflected entirely by the PBG.5–7 The mechanism of PCs determines that the color reflected from it has high brightness and saturation. Meanwhile, several kinds of colors will be observed in a suitable order with a change of perspective, as shown in Fig. 1b, called iridescent structural colors.8 Visible light contains all colors, and the selective reflection endows PCs with a specific color. The change in the hue associated with observation angles is a major issue in some color-related fields, such as textiles, paints, displays, and colorimetric sensors.9–16 Non-iridescent structural colors have been discovered in living organisms in nature such as in the feather barbs of the plum-throated cotinga and the eastern bluebird, where the PC structures are amorphous, and have short-range order and long-range disorder.6,17 By mimicking these structures, artificial PC structures with non-iridescent colors have been prepared.18–20 Unfortunately, the color brightness and saturation are also analogous, or even inferior to those of pigments.21 In order to enhance the saturation of colors, lots of materials including pigments have been added into the structure.22–27 However, these treatments will not only increase the complexity and cost of the process but also introduce unnecessary materials.It is known that the reason for iridescence is the anisotropy of long-range ordered photonic crystal structures, which results in different optical path differences at different viewing angles.28 If a long-range ordered structure is destroyed into a short-range ordered structure, iridescence is expected to be avoided. However, we suggest that the short-range order domain in a traditional amorphous structural color film is not ordered enough and too small to reflect all the photons of a particular color. The tiny domain of the short-range order leads to a noteworthy brightness and saturation attenuation of the desired color in many artificial amorphous PC structures with non-iridescent colors. Besides, there is a threshold of the layer number over which the bandwidth of the reflected light reaches a minimum and the maximum reflectivity reaches almost unity according to theoretical calculation.1,29,30 The preparation process of amorphous structures also determines that the synthetic surface will have a certain roughness.1 The scattering caused by roughness will further reduce the reflected light intensity.
An iridescent color at a high viewing angle always needs a larger domain with a periodic optical structure than a color at a low viewing angle (the normal direction of the substrate surface is 0°), as shown in Fig. 1b.31 If the periodic optical structure terminates timely, the PC can keep one color associated with a change in the angle of observation, that is, non-iridescent, as shown in Fig. 1c. A multi-domain structure can not only break the long-range order of a photonic crystal, but also have a high degree of order in the short range. Unlike a PC, a multi-domain structure has isotropy because of its long-range disorder. A long-range disordered structure can scatter visible light to any direction in space, so it can suppress iridescent colors. The high degree of order within a short range structure can improve the saturation and brightness of colors, caused by the Bragg diffraction of the crystalline ordered multiple domains. Here, we propose a strategy for obtaining a non-iridescent color with high quality brightness and saturation. In this strategy, the periodic packing of silica nano-spheres (SNSs) terminates at an appropriate location within a chaotic boundary, while the connecting domains with the same structure have a comparable area and rotational symmetry. This structure, which is very like the equiaxed grain structure in metallurgy, can eliminate iridescent colors without losing the brightness and saturation of the desired color. The key point of this method is to obtain homogeneous grains with a specific size. The grain size should be neither too large to produce iridescence nor too small to reduce the brightness and saturation. Herein, the packing of homogeneous SNSs was sophisticatedly controlled using solvent surface tension and evaporation time. A solvent with high surface tension and a low evaporation rate means a long relaxation duration for the fast packing of the spheres. This will lead to a large domain of orderly packed spheres, that is, large grains. Thus, water is used as a solvent in natural sedimentation synthesizing iridescent colors because of an ultra-high surface tension of 71.99 × 10⁻³ N m−1 and a relatively low evaporation rate, while ethanol is widely used as a solvent in spraying non-iridescent colors due to a low surface tension of 22.25 × 10⁻³ N m−1 and a relatively high evaporation rate.32–34 By adjusting the ratio of water and ethanol in the solvent, the packing rate and duration for the spheres are precisely controlled and then PCs with different grain sizes are synthesized. It is found that the color brightness and saturation increase with grain sizes, while further expanding the grain leads to the iridescent color. This research provides a one-step method to create structural colors with the highest saturation and brightness using one pure eco-friendly material, which will find further potential application in decorations, textiles, paints, displays, sensors, and so on.
Results and discussion
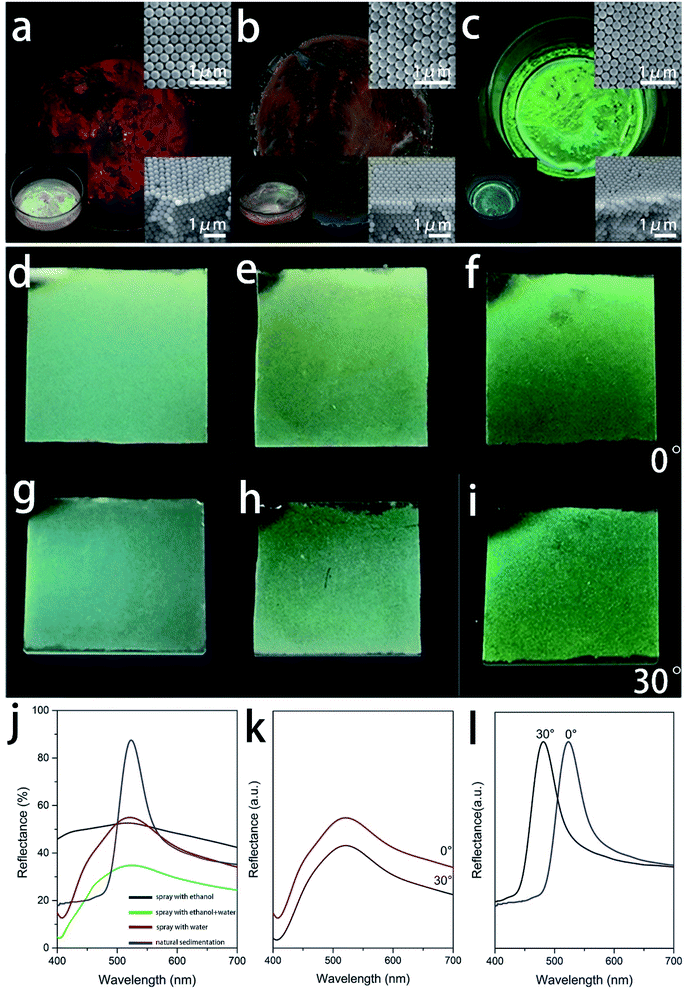
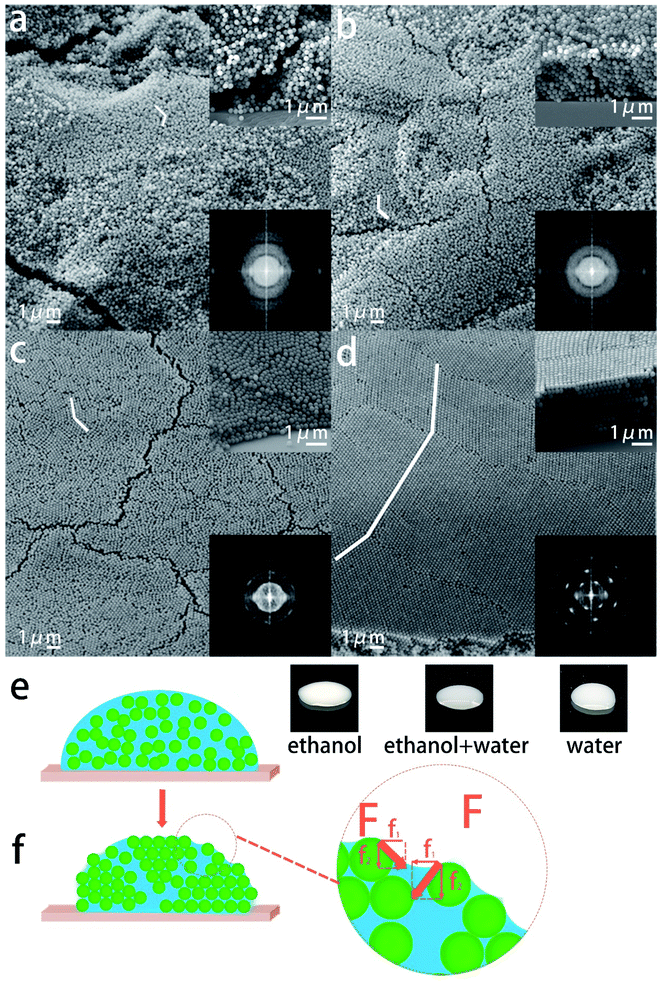
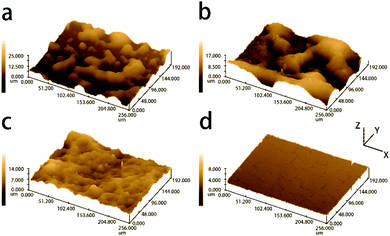
Five kinds of SNSs with different diameters (273 nm, 254 nm, 220 nm, 200 nm, and 184 nm) were synthesized in our lab, and they will be used for fabricating the colorful films. The structural information on SNSs is confirmed by XRD (Fig. S1†). There is an intense broad peak at 24° indicating that the SNSs are amorphous. The morphology of the SNSs was characterized by SEM and the corresponding images are shown in Fig. 1d–f. It is clear from the images that the diameter of each kind of sphere is uniform. We measured one hundred particles from the SEM images and the corresponding particle size distribution histograms are shown in Fig. S2 and S3.† The mono-dispersity is vital for the selective reflection of PCs. The inset in each image shows the corresponding sphere suspensions (2 wt% in water). They are milky-white, milky-white, which means that the randomly distributed spheres are colorless. These spheres are first used to assemble iridescent films by natural sedimentation to test their mono-dispersity. As shown in Fig. 2a–c, the films built using 273 nm, 254 nm and 220 nm SNSs exhibit red, orange, and green colors with high saturation, respectively, as observed vertically. This result is consistent with the calculation based on the Bragg–Snell equation. The color of each film dramatically changes as the observation angle changes, as shown in the left insets of Fig. 2a–c. The colors are blue-shifted to orange, yellow and blue, respectively, when the observation angle is 30°. This implies that the colloidal crystal films are iridescent because the mono-disperse spheres can be stacked into a regular crystal structure. The corresponding SEM observation also confirms this conclusion. The SEM images in the upper right corner of Fig. 2a–c show the surface morphology of the films and the SEM images in the bottom right corner show the corresponding cross-section morphology. As shown in the upper right insets, the spheres on the surface are arranged in a row touching one another. The second row of spheres is placed in a tight manner such that the spheres fit the depression of the first row. The third row is placed above the second row in a similar manner. The third-row spheres are aligned with those of the first row and each sphere is in contact with six other spheres. Therefore, the spheres on the top surface have typical hexagonal close packing. The cross-section morphology shows the stacking of these layers. The spheres of every other layer get exactly aligned. This pattern is well-known as the “ABAB” pattern. The spheres formed a hexagonal close-packed (hcp) structure. The close-packed planes of the spheres in the hcp structure are strictly parallel, and the plane spacing (223 nm, 207 nm, and 180 nm) is comparable to the visible wavelength range, as shown in the bottom right insets of Fig. 2a–c. Thus, the Bragg–Snell equation can be satisfied in these structures, and the films exhibit brilliant iridescent colors. The traditional spray coating method was applied on 220 nm SNSs to break long-range order and obtain non-iridescent structure color films. Three kinds of non-iridescent film samples sprayed with ethanol, ethanol–water, and water are denoted as F1 (Film 1), F2 and F3. As shown in Fig. 2d, film F1 prepared with ethanol is still green, but the color does not change with the angle. Compared with the corresponding green iridescent film, the light coming from the film in effect is the perceived whitishness. The observation of the optical photographs is consistent with the results of the reflection spectra. As shown in Fig. 2j, intense selective reflection of the green iridescent film contributes to the distinct reflection peak at 521 nm. Although film F1 also has a reflection peak at this position, it is so depressed. In other words, film F1 has low reflection selectivity, and other colors of light in the visible spectrum combined with green light are also partially reflected. These lights are compounded with green light, which causes the perceived whitishness of the film. It is obvious from Fig. 2h and i that as more water is added to the solution, the perceived whitishness phenomenon of the as-prepared film turns weak. The green color becomes more brilliant. And film F3 of this work which is sprayed totally with water solution shows the highest saturation which is almost close to the iridescent green color shown in Fig. 2c. Although the reflection peak is not as distinct as that of the iridescent film, it is much improved compared to that of film F1, as shown in Fig. 2j. The saturation performance of film F3 is compared with that of others in previous reports in Table S1.† The full width half maximum (FWHM) of the reflectance spectrum of film F3 is narrower than that of many samples with additives in former reports, which means that the saturation of film F3 is much higher.35 However, the peak position doesn't change with the angle as shown in Fig. 2k, while the peak position of the green iridescent film shifts to 480 nm when the angle is changed to 30° as shown in Fig. 2l.A structural color originates from a periodic structure. The structure evolution of the as-prepared films with an increasing water fraction in the solution was further characterized using SEM and corresponding two-dimensional (2D) fast Fourier transform (FFT). The SEM images in Fig. 3a–d (which are observed at an angle, while the vertical observations in Fig. S4†) show the surface morphology of the three non-iridescent films F1–F3 and the green iridescent film. All the non-iridescent film surfaces are generally rough, as shown in Fig. 3a–c. The green iridescent film surface is extremely flat, as shown in Fig. 3d. The roughnesses of the films are further characterized by confocal laser scanning microscopy, and the corresponding images are shown in Fig. 4. The roughnesses are 0.575 μm, 0.367 μm, 0.298 μm, and 0.142 μm, respectively. A high roughness will increase the light scattering, reduce the light reflectivity, and thus affect the brightness of the color. As shown in Fig. 2j, all the films with relatively high roughness have relatively low reflectivity. The spheres in film F1 are almost randomly distributed, and a small number of silica nanospheres are closely arranged to form a line of nanospheres. When the nanosphere lines arrange parallel to each other, a small ordered domain is formed, that is, the “grain” referred to herein. The area of the domain represents the size of the grain. Therefore, the greater the number of nanospheres on a straight line, the larger the grain size and the higher the degree of structural order. As shown in Fig. 3a, it is found that the longest line has only nine spheres, only four spheres per line on average. The mean stacking number of the hexagonal close-packed layer is about three. At the same time, the parallelism between each layer is not high. The degree of order is significantly improved in film F2. The longest line has ten spheres, and there are five spheres per line on average. The mean stacking number is six. The parallelism between rows in the domain is improved compared to that of F1. The arrangement of the spheres in film F3 is in fact quite orderly. The rows of spheres are very straight and parallel with each other in a small domain (the longest: 16 spheres, average: 11 spheres). However, the rows of spheres in the neighboring domains have a certain misalignment. The stacking structure of film F3 is very close to that of the green iridescent film, except that the domain area of the iridescent film is much larger (the longest: 43 spheres, average: 35 spheres). Except for some defects such as vacancies and half-planes the edge of which terminate within the crystal, almost all the sphere planes go across the entire domain in the green iridescent film. By combining the SEM image (Fig. 3a–d) with the optical image (Fig. 2d–f) above, we can see that the non-iridescent color becomes better and better as the mean domain size increases from 4 nanospheres to 11 nanospheres. However, the film with an average domain size of 35 nanospheres shows iridescence. Thus, according to our experiment, the optimal domain size should be between 11 nanospheres and 35 nanospheres for 220 nm diameter silicon spheres. This structural transition from disorder to order appears more clearly in the 2D-FFT images, which is powerful in analyzing spatial information mathematically in the bottom right insets.36,37 As shown in the inset of Fig. 3a, the 2D-FFT image shows the typical diffuse halo rings which indicate the amorphous state of the structure. The halo rings in the inset of Fig. 3b become narrow. This change indicates that the decrease of inter-sphere spacing and/or free volume was induced by the water fraction in the solution. The sharp ring in the inset of Fig. 3c indicates that many domains including periodically packed spheres are inside the analyzed area. The spots in the inset of Fig. 3d indicate that fewer of this kind of domain are inside the analyzed area than Fig. 3c because the domains become even larger.
The number of stacking defects in the structure determines the order degree of the spheres. The ultrahigh density of stacking defects leads to an amorphous structure. The highest density of the spheres without stacking defects leads to the perfect periodic arrangement. The spheres in this work are made of silica and they are easily wetted using both ethanol and water. Their ethanol/ethanol–water/water suspension states are shown in Fig. 3e. They are randomly distributed totally inside the liquid surrounded by the liquid surface. After the suspension droplets are sprayed on the substrate, the liquid begins to evaporate. The size of the drop shrinks. The surface tension of the liquid droplet pushes the spheres closer and closer. Because of the wettability of the sphere, the liquid forms a concave meniscus between any neighboring spheres, as shown in the enlarged inset in Fig. 3f. This meniscus makes the surface tension of the liquid have two effects on the spheres. Firstly, it pushes the spheres tight to bottom spheres and infiltrates any stacking vacancy inside the structure. Secondly, if there are any stacking vacancies between any neighboring spheres, the surface tension would pull both spheres together and infiltrate the vacancies. Therefore, the nanospheres are mainly self-assembled by using surface tension as the driving force in the solvent. When the solvent completely evaporated, the nanospheres cannot continue to move and self-assemble. The greater the surface tension of the solvent, the slower the solvent evaporates, so the driving force can exist longer time. Therefore, solvents with large surface tension can provide a longer self-assembly time for nanospheres. In this case, the nanospheres have enough time to move to the position where the energy of the entire system is the lowest and a highly ordered structure will be obtained. In contrast, when the self-assembly time is short, the solvent completely evaporates and the driving force disappears before the nanospheres move to the suitable position. Then the nanospheres can only be in a random state and disordered structures will be obtained. Water has an ultrahigh surface tension (71.99 × 10⁻³ N m−1) and thus a relatively low evaporation rate, while ethanol has relatively low surface tension and, therefore, a high evaporation rate. The water fraction in the ethanol–water solution can be used to control the relaxation rate and duration of the spheres, and then the final order degree of the structure. The timely interruption of the periodic structure is vital to prevent iridescent colors. However, if the domain of the periodic structure is too small, the reflectivity and the selectivity will decrease. That is to say, the brightness and saturation of the structural color will decrease. The refractive index of silica is 1.58, while that of air is 1. According to the calculation in the literature, at least thirteen layers of the spheres are necessary to make the maximum reflectivity reach almost unity, and at least nine layers are needed to obtain the maximum selectivity.1 Based on these theoretical results, we can calculate the critical size of grains (the length of ordered domains) to avoid iridescent structural colors (Fig. S5†). This essential physical background makes the strategy feasible and vital by which the size of the domain of short-range order is precisely controlled by regulating the strength of the solution surface tension and the evaporation rate to obtain a non-iridescent structure color with the highest brightness and saturation.
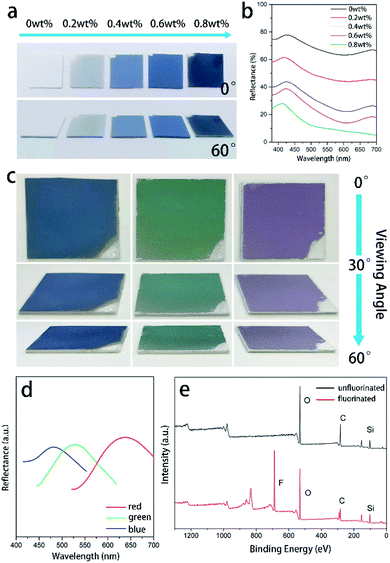
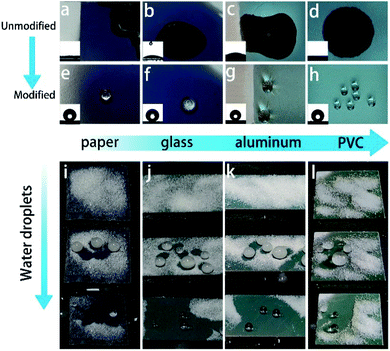
To absorb incoherently scattered light from white substrates and make our strategy valid for white substrates, a certain amount of graphene was added in the solution. It is very active in absorbing the incoherently scattered light and meanwhile the ultra-thin structure guarantees that the addition doesn't disturb the structure (Fig. S6 and S7†). A series of blue-violet colored colloidal polycrystalline array coatings composed of mono-disperse 184 nm SNSs with varying contents of graphene nanosheets on white PVC substrates were fabricated (Fig. 5a). The addition of graphene nanosheets could finely tune the structural color brightness and saturation of the films. The film shows a whitish structural color without graphene while the color saturation is significantly improved with 0.4 wt% graphene addition. Then, more graphene introduction further enhances the saturation of the structural color films. However, as the content of graphene nanosheets increases, the spectral brightness gradually decreases. As can be seen in Fig. 5a, 0.6 wt% graphene nanosheets is the optimal content. The reflectance spectra of the colloidal polycrystalline array films doped with 0.6 wt% graphene demonstrated a much intense peak as shown in Fig. 5b. In a humid environment, water will infiltrate the vacancy of the structure instead of air because the spheres are hydrophilic. Due to the refractive-index difference between them, this substitution will cause the disappearance of the structural color. In order to make sure that the color can be preserved in such harsh environments, the films were fluoridized by spraying the 1H,1H,2H,2H-perfluorooctyltriethoxysilane–ethanol solution directly on it. The fluorination treatment doesn't affect the appearance of the structural colors (Fig. S8†), as proved by the optical photographs in Fig. 5c and the corresponding reflectance spectra in Fig. 5d. The treatment is effective in fluorinating the film. As proved by the XPS spectral comparison in Fig. 5e, a distinct F-peak appears after fluorination. Besides, FT-IR analysis was further performed (Fig. S9†). The new peaks at 1150 cm−1, 1200 cm−1 after fluorination proved that the film surface was successfully fluorinated. In addition, the fluorination treatment doesn't affect the structure of the structural color films (Fig. S10†). However, this treatment is beneficial in making the film water-proof. As shown in Fig. 6a–h, the films without fluorination promptly lose their color as they are in contact with water droplets. In comparison, the films with fluoridation treatment preserve their color as they are in contact with water droplets. In addition, the water droplets can completely bounce off the surface without destroying the color (Fig. S11†). The superhydrophobicity endows them with the ability to inhibit substitution of air by water. The treatment also provides them with self-cleaning ability. As shown in Fig. 6i–l, all the substrates covered with the superhydrophobic film can get rid of sand powder quickly. The water droplets emerge the dust and take it away as they slide down from the surfaces.
Experimental
Preparation of uniform SNSs
SNSs were synthesized based on the Stöber method.38 Taking 220 nm SNSs as an example, the preparation method will be illustrated as follows. Firstly, 73 ml of ethanol, 8 ml of ammonia (25%) (Beijing Chemical Works) and 3 ml of distilled water (distilled using a USF-ELGA water purifier) were respectively added into a 250 ml beaker at room temperature. Then the mixture was heated in a water-bath under vigorous stirring. 6 ml of tetraethyl orthosilicate (TEOS) (Beijing Chemical Works) was added once the mixture reached 60 °C. The solution was stirred with a stirrer blade under a sealed atmosphere for 2 h and then uniform SNSs were obtained. SNSs were harvested by centrifugation at 6000 rpm for 15 min and washed with ethanol several times. Finally, they were dried in a refrigerator (4 °C) for future use. The diameter of SNSs can be tuned easily by changing the volume of ethanol. SNSs of five diameters for blue-violet (184 nm), blue (200 nm), green (220 nm), orange (254 nm) and red (273 nm) films were prepared with ethanol volumes of 83 ml, 78 ml, 73 ml, 67 ml, and 63 ml, respectively.Preparation of structural color films
The iridescent structural color films were prepared by a natural sedimentation method.39 Firstly, a colloidal suspension of SNSs was diluted to 2 wt% with deionized water and was subjected to ultrasonic treatment for 30 min. The suspension was cast into a cover of a 50 ml centrifuge tube or Petri dish with a diameter of 6 cm and then it was placed in an oven at 60 °C until the solvent evaporated completely. Different color films consisted of SNSs of different diameters and were organized into close-packed arrangements with a long-range order. In contrast, the non-iridescent structural color films were prepared by spray coating with the colloidal suspension. After ultrasonic treatment for 30 min, the 10 wt% colloidal suspension of SNSs was loaded into an airbrush with a nozzle size of 0.2 mm. The distance between the airbrush and substrates was 30 cm and the pressure was 0.7 MPa. The solvents for N1 to N3 were ethanol, ethanol![[thin space (1/6-em)]](https://www.rsc.org/images/entities/char_2009.gif) :
:![[thin space (1/6-em)]](https://www.rsc.org/images/entities/char_2009.gif) water 1
water 1![[thin space (1/6-em)]](https://www.rsc.org/images/entities/char_2009.gif) :
:![[thin space (1/6-em)]](https://www.rsc.org/images/entities/char_2009.gif) 1 (weight ratio) and water, respectively. To obtain brilliant structural color films on white substrates, 0.6 wt% (graphene/SNSs) graphene nanosheets were added into the colloidal suspension before spraying to absorb the incoherently scattered light. Super-hydrophobic films were fabricated by spray coating with a solution of ethanol and 1H,1H,2H,2H-perfluorooctyltriethoxysilane (Shanghai CanSpecsci Scientific Instruments Co. Ltd.) (1H,1H,2H,2H-perfluorooctyltriethoxysilane
1 (weight ratio) and water, respectively. To obtain brilliant structural color films on white substrates, 0.6 wt% (graphene/SNSs) graphene nanosheets were added into the colloidal suspension before spraying to absorb the incoherently scattered light. Super-hydrophobic films were fabricated by spray coating with a solution of ethanol and 1H,1H,2H,2H-perfluorooctyltriethoxysilane (Shanghai CanSpecsci Scientific Instruments Co. Ltd.) (1H,1H,2H,2H-perfluorooctyltriethoxysilane![[thin space (1/6-em)]](https://www.rsc.org/images/entities/char_2009.gif) :
:![[thin space (1/6-em)]](https://www.rsc.org/images/entities/char_2009.gif) ethanol, 1
ethanol, 1![[thin space (1/6-em)]](https://www.rsc.org/images/entities/char_2009.gif) :
:![[thin space (1/6-em)]](https://www.rsc.org/images/entities/char_2009.gif) 100 volume ratio) on the surfaces of structural color films prepared in the previous step.
100 volume ratio) on the surfaces of structural color films prepared in the previous step.
Characterization
The optical photos of the structural color films were taken by using a digital camera (Canon EOS 600D) under diffusive light illumination. Scanning electron microscopy (SEM) images were obtained by field emission scanning electron microscopy (FESEM; JSM-6700F). The angle-resolved reflectance spectra of the structural color films were recorded by using a UV-Vis optic fiber spectrometer (Ocean Optics Inc., USB2000+) via a 600 μm broadband optical fiber (Ocean Optics Inc., P600-2-UV/VIS). A xenon lamp was used as a light source with a wavelength from 200 nm to 850 nm. The corresponding substrates for the structured films were used as the reference. The surface roughness of the structural color films was characterized by laser confocal microscopy (Olympus Corporation., OLS3000). X-ray photoelectron spectroscopy (XPS) experiments were performed on an ESCALab MK II electron spectrometer (Vacuum Generators) with unmonochromatic 240 W Al Kα X-rays. Water contact angles (CAs) were measured via a CCD camera on a contact angle meter (OCA 20 data physics, Germany) at room temperature.Conclusions
The movement of the spheres inside the solution is controlled by the surface tension of the solvent and the movement duration is related to the evaporation rate. Thus, the orderliness of the SNS packing can be well controlled by the solvent ingredients. The solvent with high surface tension will lead to a more ordered packing of the spheres, while the solvent with low surface tension will lead to more defects inside the structure. By adjusting the solution ingredients and fractions, a polycrystalline structure of the silica nano-spheres is packed. The grain is equiaxed. And the grain size is optimized to intensively reflect the color at a low viewing angle and eliminate the reflection of the color at a high viewing angle. Thus, the structural color from this structure has unicity, brightness, and high saturation. By combining graphene doping and superhydrophobic treatment, these structural color films can be fabricated on many kinds of substrates, such as PVC, papers, glass and aluminum sheets, and maintained under high humidity conditions. This research will expand the potential application areas of structural colors such as decorations, textiles, paints, sensors, full-color displays and so on.Conflicts of interest
There are no conflicts to declare.Acknowledgements
This work was supported by the National Key Research and Development Program of China (2018YFA0702303), the National Key Laboratory of Science and Technology on Helicopter Transmission (Nanjing University of Aeronautics and astronautics) (Grant No. HTL-O-19G10), the Key Program for International S&T Cooperation Projects of China (2016YFE0132900), the Jilin Province Science and Technology Development Project (No. 20180101071JC), and the Program for JLU Science and Technology Innovative Research Team (JLUSTIRT, 2017TD-09). Yan Liu is grateful for the research grants (No. 51761135110).References
- S. Kinoshita, S. Yoshioka and J. Miyazaki, Rep. Prog. Phys., 2008, 71, 076401 CrossRef.
- Y. Zhao, Z. Xie, H. Gu, C. Zhu and Z. Gu, Chem. Soc. Rev., 2012, 41, 3297–3317 RSC.
- I. Lundberg, Scand. J. Work, Environ. Health, 1986, 12, 108–113 CrossRef CAS.
- D. Yang, W. Luo, Y. Huang and S. Huang, ACS Omega, 2019, 4, 528–534 CrossRef CAS.
- A. G. Dumanli and T. Savin, Chem. Soc. Rev., 2016, 45, 6698–6724 RSC.
- L. Shi, Y. Zhang, B. Dong, T. Zhan, X. Liu and J. Zi, Adv. Mater., 2013, 25, 5314–5320 CrossRef CAS.
- F. F. Fu, Z. Y. Chen, Z. Zhao, H. Wang, L. R. Shang, Z. Z. Gu and Y. J. Zhao, Proc. Natl. Acad. Sci. U. S. A., 2017, 114, 5900–5905 CrossRef CAS.
- J. Sun, B. Bhushan and J. Tong, RSC Adv., 2013, 3, 14862–14889 RSC.
- Q. Zeng, C. Ding, Q. S. Li, W. Yuan, Y. Peng, J. C. Hu and K. Q. Zhang, RSC Adv., 2017, 7, 8443–8452 RSC.
- W. Yuan, N. Zhou, L. Shi and K. Q. Zhang, ACS Appl. Mater. Interfaces, 2015, 7, 14064–14071 CrossRef CAS.
- Y. Takeoka, S. Yoshioka, A. Takano, S. Arai, K. Nueangnoraj, H. Nishihara, M. Teshima, Y. Ohtsuka and T. Seki, Angew. Chem., Int. Ed. Engl., 2013, 52, 7261–7265 CrossRef CAS.
- J. G. Park, S. H. Kim, S. Magkiriadou, T. M. Choi, Y. S. Kim and V. N. Manoharan, Angew. Chem., Int. Ed. Engl., 2014, 53, 2899–2903 CrossRef CAS.
- V. Flauraud, M. Reyes, R. Paniagua-Dominguez, A. I. Kuznetsov and J. Brugger, ACS Photonics, 2017, 4, 1913–1919 CrossRef CAS.
- A. C. Arsenault, D. P. Puzzo, I. Manners and G. A. Ozin, Nat. Photonics, 2007, 1, 468–472 CrossRef CAS.
- W. Luo, H. Ma, F. Mou, M. Zhu, J. Yan and J. Guan, Adv. Mater., 2014, 26, 1058–1064 CrossRef CAS.
- Z. Wang, M. Xue, H. Zhang, Z. Meng, K. J. Shea, L. Qiu, T. Ji and T. Xie, RSC Adv., 2018, 8, 9963–9969 RSC.
- E. R. Dufresne, H. Noh, V. Saranathan, S. G. J. Mochrie, H. Cao and R. O. Prum, Soft Matter, 2009, 5, 1792–1795 RSC.
- Y. Takeoka, M. Iwata, T. Seki, K. Nueangnoraj, H. Nishihara and S. Yoshioka, Langmuir, 2018, 34, 4282–4288 CrossRef CAS.
- D. Ge, L. Yang, G. Wu and S. Yang, J. Mater. Chem. C, 2014, 2, 4395 RSC.
- M. Xiao, Z. Hu, Z. Wang, Y. Li, A. D. Tormo, N. Le Thomas, B. Wang, N. C. Gianneschi, M. D. Shawkey and A. Dhinojwala, Sci. Adv., 2017, 3, e1701151 CrossRef.
- Y. Takeoka, Chem. Commun., 2018, 54, 4905–4914 RSC.
- D. T. Ge, X. M. Yang, Z. Chen, L. L. Yang, G. X. Wu, Y. Xia and S. Yang, Nanoscale, 2017, 9, 17357–17363 RSC.
- Y. Zhang, B. Dong, A. Chen, X. Liu, L. Shi and J. Zi, Adv. Mater., 2015, 27, 4719–4724 CrossRef CAS.
- P. M. Liu, J. L. Chen, Z. X. Zhang, Z. Y. Xie, X. Du and Z. Z. Gu, Nanoscale, 2018, 10, 3673–3679 RSC.
- M. Kohri, K. Yanagimoto, A. Kawamura, K. Hamada, Y. Imai, T. Watanabe, T. Ono, T. Taniguchi and K. Kishikawa, ACS Appl. Mater. Interfaces, 2018, 10, 7640–7648 CrossRef CAS.
- Y. Zhang, P. Han, H. Zhou, N. Wu, Y. Wei, X. Yao, J. Zhou and Y. Song, Adv. Funct. Mater., 2018, 28, 1802585 CrossRef.
- G. Yavuz, H. P. Felgueiras, A. I. Ribeiro, N. Seventekin, A. Zille and A. P. Souto, ACS Appl. Mater. Interfaces, 2018, 10, 23285–23294 CrossRef CAS.
- Y. Takeoka, S. Yoshioka, A. Takano, S. Arai, K. Nueangnoraj, H. Nishihara, M. Teshima, Y. Ohtsuka and T. Seki, Angew. Chem., Int. Ed. Engl., 2013, 52, 7261–7265 CrossRef CAS.
- M. F. Land, Prog. Biophys. Mol. Biol., 1972, 24, 75–106 CrossRef CAS.
- S. Kinoshita and S. Yoshioka, ChemPhysChem, 2005, 6, 1442–1459 CrossRef CAS.
- P. Liu, L. Bai, J. Yang, H. Gu, Q. Zhong, Z. Xie and Z. Gu, Nanoscale Adv., 2019, 1, 1672–1685 RSC.
- N. B. Vargaftik, B. N. Volkov and L. D. Voljak, J. Phys. Chem. Ref. Data, 1983, 12, 817–820 CrossRef CAS.
- F. A. M. M. Gonçalves, A. R. Trindade, C. S. M. F. Costa, J. C. S. Bernardo, I. Johnson, I. M. A. Fonseca and A. G. M. Ferreira, J. Chem. Thermodyn., 2010, 42, 1039 CrossRef.
- S. Bernardo, I. Johnson, I. M. A. Fonseca and A. G. M. Ferreira, J. Chem. Thermodyn., 2010, 42, 1039–1049 CrossRef.
- G. Chen, B. Yi, Y. Huang, Q. Liang and H. Shen, Dyes Pigm., 2019, 161, 464–469 CrossRef CAS.
- C. E. Ayres, B. S. Jha, H. Meredith, J. R. Bowman, G. L. Bowlin, S. C. Henderson and D. G. Simpson, J. Biomater. Sci., Polym. Ed., 2008, 19, 603–621 CrossRef CAS.
- R. H. Torres and R. O. Prum, Integr. Comp. Biol., 2003, 43, 591–602 CrossRef.
- W. Gao, M. Rigout and H. Owens, J. Nanopart. Res., 2016, 18, 387 CrossRef.
- G. Liu, J. Shao, Y. Zhang, Y. Wu, C. Wang, Q. Fan and L. Zhou, J. Text. Inst., 2015, 106, 1293–1305 CrossRef CAS.
Footnote |
| † Electronic supplementary information (ESI) available. See DOI: 10.1039/d0na00609b |
| This journal is © The Royal Society of Chemistry 2020 |

