
 Open Access Article
 This Open Access Article is licensed under a Creative Commons Attribution-Non Commercial 3.0 Unported Licence
The correlation between phase transition and photoluminescence properties of CsPbX3 (X = Cl, Br, I) perovskite nanocrystals†
Jun
Yi
ab,
Xueying
Ge
a,
Exian
Liu
ab,
Tong
Cai
 c,
Chujun
Zhao
b,
Shuangchun
Wen
b,
Hugo
Sanabria
a,
Ou
Chen
c,
Apparao M.
Rao
*a and
Jianbo
Gao
*a
c,
Chujun
Zhao
b,
Shuangchun
Wen
b,
Hugo
Sanabria
a,
Ou
Chen
c,
Apparao M.
Rao
*a and
Jianbo
Gao
*a
aDepartment of Physics and Astronomy, Clemson Nanomaterials Institute, Clemson University, Clemson, SC 29634, USA. E-mail: arao@clemson.edu; jianbogao.nano@gmail.com
bKey Laboratory for Micro/Nano Optoelectronic Devices of Ministry of Education, Hunan Provincial Key Laboratory of Low-Dimensional Structural Physics and Devices, School of Physics and Electronics, Hunan University, Changsha 410082, China
cDepartment of Chemistry, Brown University, Providence, RI 02912, USA
First published on 6th July 2020
Abstract
We report a correlation between the structural phase transition of CsPbX3 (X = Cl, Br, I) nanocrystals (NCs) and their temperature-dependent steady-state photoluminescence (PL) and time-resolved PL (TRPL). In contrast to CsPbBr3 and CsPbI3 NCs which exhibited a continuous blue-shift in their band gap with increasing temperature, the CsPbCl3 exhibited a blue shift until ∼193 K, followed by a red shift until room temperature. We attribute this change from a blue to a red shift to a structural phase transition in CsPbCl3, which also manifested in the temperature dependent TRPL. This pronounced phase transition in CsPbCl3 NCs is probably due to the condensation of its vibrational modes at low temperature, and the presence of the weak quantum confinement effect. Notably, the exciton recombination lifetimes showed a similar reverse trend due to the phase transition in CsPbCl3, which has not been reported previously.
A phase transition is one of the most fundamental physical phenomena in solid-state physics as it could also influence the electrical, optical, magnetic, mechanical, and chemical properties of the materials. It is particularly important for emerging perovskite semiconductors, which have attracted much attention due to their superior electronic and optical properties. Bulk perovskite semiconductors are used in myriad applications such as light-emitted diodes (LED),1 photovoltaics,2–4 X-ray detectors, lasers, and other optoelectronic devices5,6 because of their highly mobile free charge carriers,7–9 high absorption coefficients,10,11 low exciton binding energies,12,13 and long charge-carrier diffusion lengths.14 Not surprisingly, the perovskite nanocrystals (NCs) are also attracting much attention because of their unique tunable optical properties, which stem from their size, structure, shape, and tunable compositions.15–17 Notably, perovskite NCs offer more stable phases, which are not achievable in the bulk materials. For instance, cubic phase α-CsPbI3 NC-based solar cells exhibit more than 15% power conversion efficiency under ambient conditions and are stable for more than 100 hours, while the bulk CsPbI3 is an unstable semiconductor under ambient conditions.18 Traditionally, phase transitions are widely characterized using X-ray diffraction (XRD) to provide detailed information of the lattice structure, which in turn could depend on temperature, pressure, light, electric field, etc. For instance, in bulk and nanocrystalline perovskite materials, temperature-dependent XRD has been used to investigate the phase transitions;19,20 however, there are only a few reports that correlate the phase transition with optical properties, which is of important for their applications in optoelectronics.
In this report, we investigate the temperature-dependent PL of all-inorganic perovskite CsPbX3 (X = Cl, Br, and I) NCs using steady-state PL and time-resolved PL (TRPL) spectroscopies to correlate their phase transition with their emission properties. We found that the band gap energies and lifetimes increase continuously with the temperature in CsPbBr3 and CsPbI3 NCs; however, CsPbCl3 NCs exhibited a blue shift until their phase transition temperature of ∼193 K, followed by a red-shift until room temperature. Also, the lifetimes of CsPbCl3 NCs decreased up to their phase transition temperature, above which they showed an increasing trend.
All-inorganic perovskite CsPbX3 NCs were synthesized using a hot-injection method (see Experimental section).21 The cubic lattice framework of CsPbX3 consists of the corner-sharing PbX6 octahedra with Cs+ embedded in the interstitial voids (Fig. 1a). The room temperature PL and absorption spectra of CsPbX3 NC dispersions in hexane are shown in Fig. 1b, and the energy difference between the excitonic absorption peak and PL peak (or Stokes shift, which stems from the exciton relaxation processes) is evident.22 From detailed transmission electron microscopy (TEM) analyses, the average NC size was found to be ∼7.2, ∼9.1, and ∼14.9 nm for CsPbCl3, CsPbBr3, and CsPbI3, respectively (Fig. 1c–e). Fig. 1f shows the high-resolution TEM image of CsPbI3 NCs. The Bohr radii of CsPbCl3, CsPbBr3, and CsPbI3 are known to be ∼5, ∼7, and ∼12 nm,23 respectively, and the NCs exhibit weak quantum confinement since the ratio of NC size to the respective Bohr radius is ∼1.24 to ∼1.44. It is well-known that organo-lead halide perovskites have three phases which include the high temperature cubic phase (>315 K), room temperature tetragonal phase (160–330 K) and low temperature orthorhombic phase (<160 K). The room temperature XRD patterns of the CsPbX3 (X = Cl, Br, I) NCs used in this study are shown as insets in Fig. 1c–e. The CsPbI3 NCs exhibit the cubic phase24 with peaks at 2θ = 14.2, 20.2, 28.6, 35.3, and 41.0° corresponding to diffractions from the (100), (110), (200), (211) and (220) planes, and a shift in the diffraction peaks towards a higher angle (2θ) as X changes from I to Cl is ascribed to the lattice contraction caused by the shrinking size of the halide ion from I− to Cl−.23 The XRD data confirmed the formation of CsPbX3 quantum dots with the space group Pm![[3 with combining macron]](https://www.rsc.org/images/entities/char_0033_0304.gif) m.25
m.25
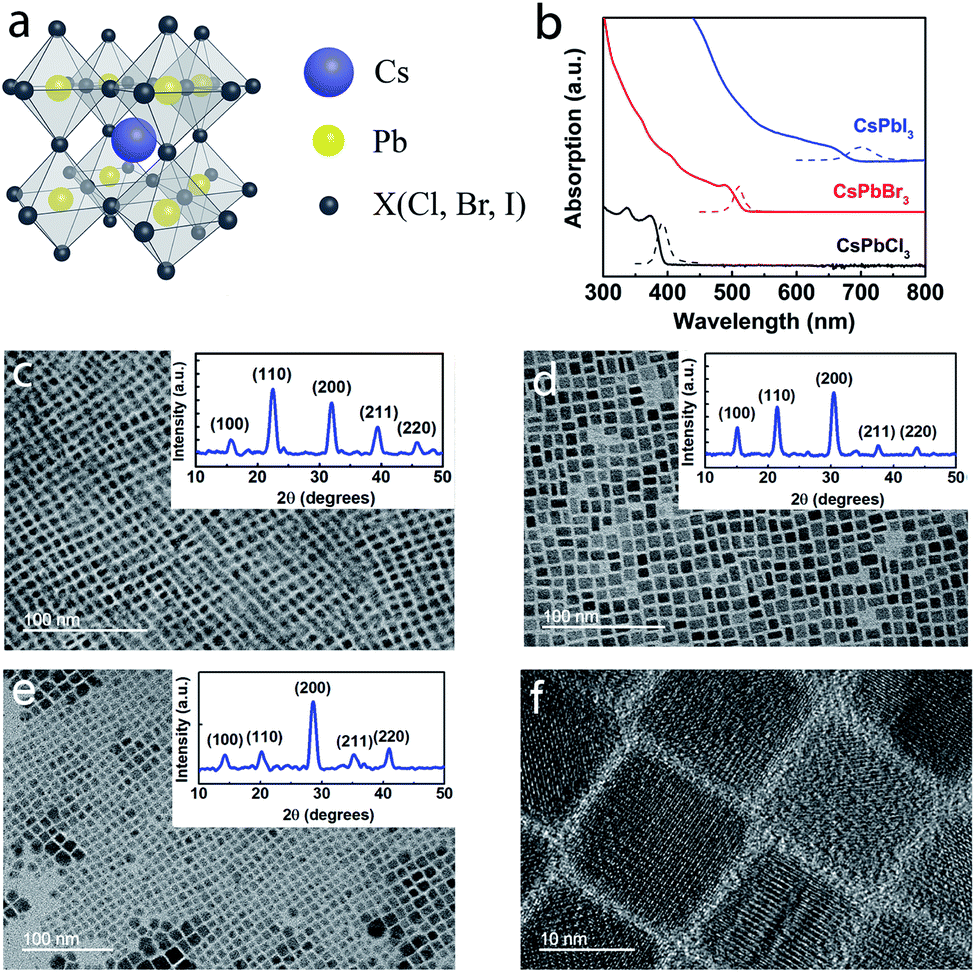 | ||
| Fig. 1 Structural characterization of CsPbX3 nanocrystals (NCs). (a) A schematic crystal structure of a cubic CsPbX3 perovskite. (b) Room temperature absorption (solid) and PL spectra (dashed) of CsPbX3 NCs in a hexane solution. TEM images of (c) CsPbCl3, (d) CsPbBr3, and (e) CsPbI3 NCs. (f) High-resolution TEM image of CsPbI3 NCs. The insets in panels (c–e) are the corresponding room temperature XRD patterns. | ||
For the temperature-dependent studies, thin film samples of CsPbX3 NCs were prepared by drop-casting the respective dispersions on quartz slides, and their temperature-dependent PL data were acquired (Fig. 2a–c). The excitation energies (wavelengths) used in this study for CsPbCl3, CsPbBr3, and CsPbI3 NCs were 4.13 eV (300 nm), 3.54 eV (350 nm), and 2.48 eV (500 nm), respectively. It is evident that the PL intensity decreases in all three panels (a–c) with increasing temperature, which is due to the presence of increased non-radiative processes at high temperature. Furthermore, the PL emission peaks of CsPbBr3 and CsPbI3 NCs exhibit a blue shift with increasing temperature, which is in contrast to the temperature-dependent shift in the PL emission peak of CsPbCl3 NCs (dashed arrows in Fig. 1a–c). As expected, a thermal broadening of the full-width-at-half-maximum (FWHM) intensity is also observed with increasing temperature in Fig. 2d–f. Using different excitation energies, examples of low temperature 2D PL contour maps of CsPbBr3 NCs are shown in Fig. S1 (see the ESI†) to demonstrate that the shift is independent of excitation energy.
 | ||
| Fig. 2 Steady-state PL characteristics of CsPbX3 NCs. Steady-state PL spectra of (a) CsPbCl3, (b) CsPbBr3, and (c) CsPbI3 NCs in the temperature range of 80 K–300 K. Temperature-dependent full-width-at-half-maximum (FWHM) intensities and the emission peak energies of (d) CsPbCl3, (e) CsPbBr3, and (f) CsPbI3 NCs. Blue and red dashed arrows in (a–c) show the blue and red shift of emission peak energy with the increasing temperature. The red traces in (d–f) represent least square fits to the temperature dependent FWHM data and the black traces serve as a guide to the eye. | ||
The temperature-dependent band gap of perovskites reveals an unusual trend compared to traditional semiconductors. The band gaps of CsPbBr3 and CsPbI3 exhibited a blue shift with increasing temperature, which is in contrast to that predicted by the Varshni's empirical model in which electron–phonon coupling usually dominates and leads to a red shift of the band gap with increasing temperature.26 A blue shift in the band gap energy can arise from an interplay of contributions from the lattice thermal expansion and electron–phonon coupling.27,28 The lattice thermal expansion has been reported to dominate and decrease the interaction between the orbitals in the valence band maximum (s orbital of Cs and p orbital of X), which leads to a decrease in the valence bandwidth and an increase in the band gap.27,29 Similar to CsPbBr3 and CsPbI3, the band gap of CsPbCl3 exhibited a blue shift in the 80–180 K temperature range. However, it showed a red shift in the temperature range from 200–300 K, which implies that the electron-phonon coupling dominates in CsPbCl3 at higher temperatures. This change from a blue to a red shift is attributed to the low temperature phase transition ∼193 K in CsPbCl3 which is unique to CsPbCl3, and absent in CsPbBr3 and CsPbI3. At ∼193 K, CsPbCl3 deviated from its centrosymmetric structure, which was confirmed by electron paramagnetic resonance, X-ray diffraction, photoacoustic and Raman spectroscopies.30–33 The low-temperature Raman spectroscopy of CsPbCl3 revealed a unique change in the behavior of its vibration modes. The Raman modes located at 76 cm−1, 95 cm−1, 123 cm−1 and <50 cm−1 start to disappear as the temperature increases above 193 K, which has been referred to as the condensation of these vibration modes in CsPbCl3 at 193 K.34 When the temperature decreases below 193 K, the structural phase of CsPbCl3 changes from orthorhombic to monoclinic,30 which was reported in CsPbCl3 bulk materials.30–34 However, this phase transition is not exhibited by CsPbCl3 quantum dots because of the strong quantum confinement condition,35 but is exhibited by CsPbCl3 NCs used in this study due to their weak quantum confinement condition.
To gain a deeper understanding of the mechanism, the temperature-dependent band gap and spectral broadening of PL for CsPbX3 NCs are shown in Fig. 2d–f. The broadening with temperature is mainly due to the electron–phonon coupling which includes electron–acoustic phonon and electron–longitudinal optical (LO) phonon coupling.29 In most semiconductors, the electron–LO phonon interaction dominates at temperatures above 80 K, thus neglecting the electron–acoustic phonon coupling; the broadening of PL linewidth can be express as36
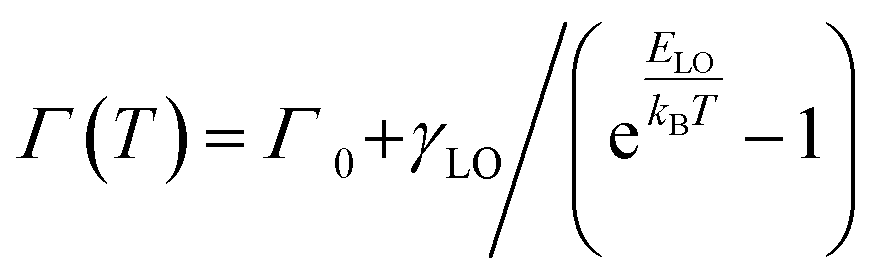 | (1) |
| Sample | Γ 0 (meV) | γ LO (meV) | E LO (meV) |
|---|---|---|---|
| CsPbCl3 | 56.5 ± 0.82 | 176.2 ± 22.75 | 38.0 ± 2.69 |
| CsPbBr3 | 25.4 ± 0.38 | 160.4 ± 9.27 | 36.1 ± 1.18 |
| CsPbI3 | 57.8 ± 1.11 | 139.1 ± 23.18 | 33.8 ± 3.33 |
As mentioned, we attribute the unusual red shift with decreasing temperature and a common blue shift with increasing temperature to the phase transition in CsPbCl3 NCs. This is also consistent with the temperature-dependent TRPL results as shown in Fig. 3, which can be manifested by the exciton decay dynamics. In general, TRPL data is analyzed in terms of single (I = I0 + A1![[thin space (1/6-em)]](https://www.rsc.org/images/entities/char_2009.gif) exp(−t/t1)) or bi-exponential (I = I0 + A1exp(−t/t1) + A2exp(−t/t2)) decay processes, where I0 represents the offset of normalized PL intensity, and (A1, t1) and, (A2, t2) are the relative weights and lifetimes, respectively. In the case of CsPbCl3, it exhibited a unique trend: in the 80–180 K (200–300 K) range, its lifetimes decrease (increase) with increasing temperature, and the phase transition temperature of 180 K is consistent with that induced from the steady-state PL. In contrast, in the case of CsPbBr3 (single exponential process) and CsPbI3 (bi-exponential process, see Table S1 in ESI†), their lifetimes increase with increasing temperature, which is consistent with the recently reported trends due to exciton fission.35 Its increasing trend in the 200–300 K range was similar to that of CsPbBr3 and CsPbI3. From 180 to 300 K, the structural phase of CsPbCl3 is orthorhombic, which is the same as the structural phase of CsPbBr3 and CsPbI3, hence the lifetime of CsPbCl3 shows the same increasing trend as the lifetime of CsPbBr3 and CsPbI3. However, for temperatures below 193 K, the structural phase of CsPbCl3 changes from orthorhombic to monoclinic, leading to a reverse trend in the temperature-dependent lifetime. This novel finding clearly suggests that the excitonic recombination lifetime is intimately coupled with the structural phase transition. Such phase transition induced trend reversal in the temperature-dependent band gap and lifetimes reveals the correlation between phase transition, electronic structure, and exciton dynamics, which can provide significant guidance for phase transition-related electronic and optical properties of the perovskite.
exp(−t/t1)) or bi-exponential (I = I0 + A1exp(−t/t1) + A2exp(−t/t2)) decay processes, where I0 represents the offset of normalized PL intensity, and (A1, t1) and, (A2, t2) are the relative weights and lifetimes, respectively. In the case of CsPbCl3, it exhibited a unique trend: in the 80–180 K (200–300 K) range, its lifetimes decrease (increase) with increasing temperature, and the phase transition temperature of 180 K is consistent with that induced from the steady-state PL. In contrast, in the case of CsPbBr3 (single exponential process) and CsPbI3 (bi-exponential process, see Table S1 in ESI†), their lifetimes increase with increasing temperature, which is consistent with the recently reported trends due to exciton fission.35 Its increasing trend in the 200–300 K range was similar to that of CsPbBr3 and CsPbI3. From 180 to 300 K, the structural phase of CsPbCl3 is orthorhombic, which is the same as the structural phase of CsPbBr3 and CsPbI3, hence the lifetime of CsPbCl3 shows the same increasing trend as the lifetime of CsPbBr3 and CsPbI3. However, for temperatures below 193 K, the structural phase of CsPbCl3 changes from orthorhombic to monoclinic, leading to a reverse trend in the temperature-dependent lifetime. This novel finding clearly suggests that the excitonic recombination lifetime is intimately coupled with the structural phase transition. Such phase transition induced trend reversal in the temperature-dependent band gap and lifetimes reveals the correlation between phase transition, electronic structure, and exciton dynamics, which can provide significant guidance for phase transition-related electronic and optical properties of the perovskite.
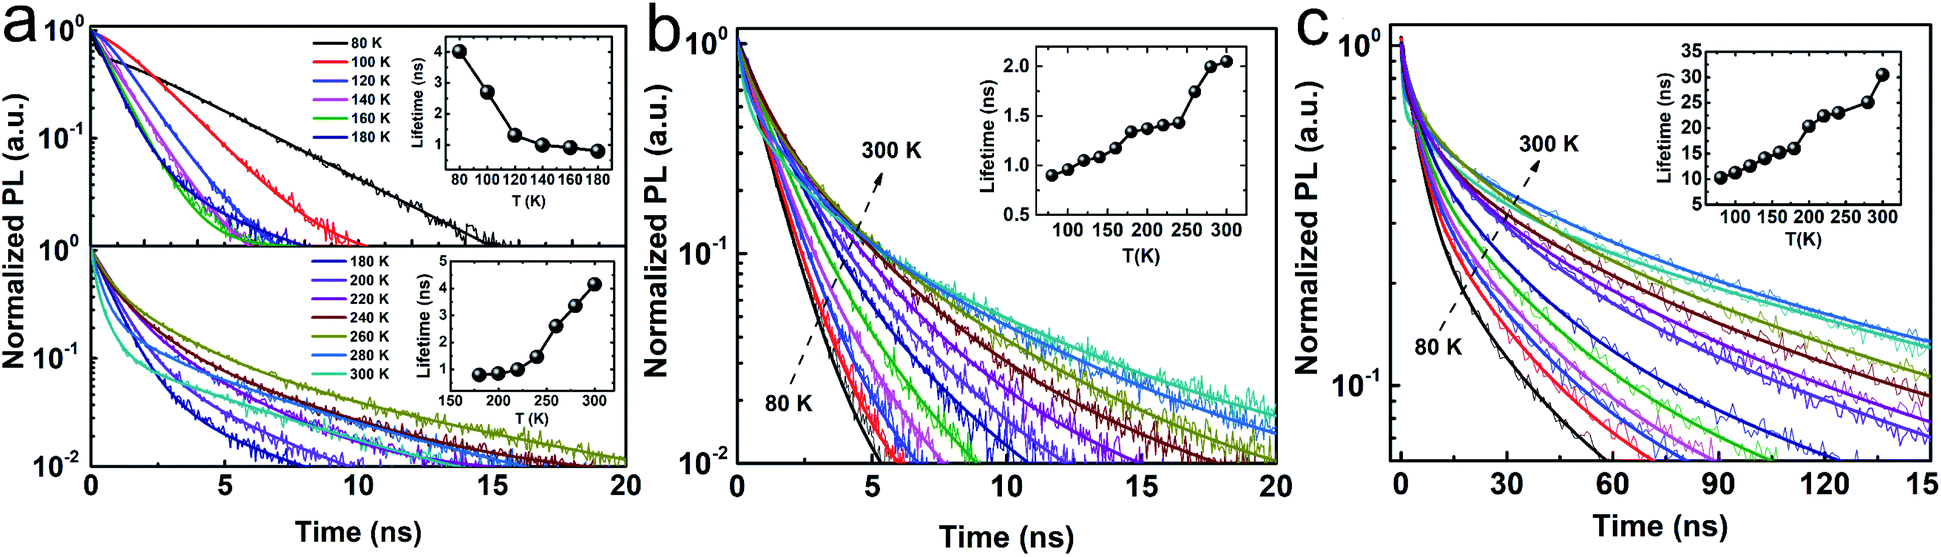 | ||
| Fig. 3 TRPL characteristics of CsPbX3 NCs. Normalized TRPL data of (a) CsPbCl3, (b) CsPbBr3, and (c) CsPbI3 NCs in the temperature range from 80–300 K. Each colored trace in the figure represents TRPL data that were collected at a specific temperature (legends shown in panel (a)). The solid traces are fits to the data, and the insets show the corresponding lifetimes. For clarity, two sub-panels are shown in panel (a). | ||
Conclusions
In summary, we investigated the temperature-dependent PL and TRPL of CsPbX3 NCs in the 80 to 300 K temperature range, which revealed a correlation between phase transition, electronic structure, and exciton dynamics. In particular, the low temperature phase transition of CsPbCl3 at ∼193 K resulted in a reverse temperature dependence of band gap that red-shifted with increasing temperature until 300 K. Furthermore, the exciton recombination lifetimes showed the similar reverse trend due to the phase transition, which has not been reported previously. Overall, this study presents comprehensive temperature-dependent spectroscopic signatures of all-inorganic perovskites CsPbX3 NCs, which provide a deeper insight into the effect of phase-transition on the low temperature photo-physics of perovskite materials.Experimental
Synthesis and characterization
Temperature dependent steady-state PL and TRPL spectra
The temperature dependent PL experiments were performed using a modular spectrofluorometer system (HORIBA Nanolog) which consisted of a Xenon lamp (HORIBA FL-1039), an excitation monochromator, a sample-compartment module, an emission spectrometer and a CCD detector (HORIBA Symphony II). The TRPL spectra were measured by using a spectrofluorometer (HORIBA FluoroLog FL3-22) equipped with a picosecond photon detection module (TBX-05) and a 375 nm laser source (NanoLED N-375L) controlled by using a single photon counting controller (FluoroHub). The dispersions of CsPbX3 QDs were drop-casted onto quartz substrates and then placed inside an optical cryostat (JANIS, ST-100 equipped with a Turbolab 350) which was illuminated by using the Xenon lamp and laser. The temperature of the cryostat was controlled by using a temperature controller (Lake Shore, Model 325).Conflicts of interest
The authors declare no conflict of interest.Acknowledgements
The support provided by the China Scholarship Council (CSC) during a visit of Jun Yi to Clemson is acknowledged. We also wish to thank Russell Reynolds, Barrett Barker, and Michael Denz at Clemson University for their instrumental and technical support. A. M. Rao acknowledges financial support for this project through the R. A. Bowen Professorship at Clemson University.Notes and references
- M. L. Lai, F. Deschler, H. J. Snaith, T. Bein, D. Credgington, Z.-K. Tan, F. Hanusch, A. Sadhanala, R. S. Moghaddam, R. Higler, M. Price, P. Docampo, R. H. Friend and L. M. Pazos, Nat. Nanotechnol., 2014, 9, 687–692 CrossRef PubMed.
- R. Humphry-Baker, M. K. Nazeeruddin, J. Burschka, P. Gao, N. Pellet, M. Grätzel and S.-J. Moon, Nature, 2013, 499, 316–319 CrossRef PubMed.
- M. A. Green, A. Ho-Baillie and H. J. Snaith, Nat. Photonics, 2014, 8, 506–514 CrossRef CAS.
- N. J. Jeon, J. H. Noh, W. S. Yang, Y. C. Kim, S. Ryu, J. Seo and S. Il Seok, Nature, 2015, 517, 476–480 CrossRef CAS PubMed.
- G. Xing, N. Mathews, S. S. Lim, N. Yantara, X. Liu, D. Sabba, M. Grätzel, S. Mhaisalkar and T. C. Sum, Nat. Mater., 2014, 13, 476–480 CrossRef CAS PubMed.
- W. Hu, R. Wu, S. Yang, P. Fan, J. Yang and A. Pan, J. Phys. D. Appl. Phys., 2017, 50, 375101 CrossRef.
- Q. Lin, A. Armin, R. C. R. Nagiri, P. L. Burn and P. Meredith, Nat. Photonics, 2014, 9, 106 CrossRef.
- E. Edri, S. Kirmayer, S. Mukhopadhyay, K. Gartsman, G. Hodes and D. Cahen, Nat. Commun., 2014, 5, 3461 CrossRef PubMed.
- J. S. Manser and P. V. Kamat, Nat. Photonics, 2014, 8, 737–743 CrossRef CAS.
- J. Even, L. Pedesseau, J.-M. M. Jancu and C. Katan, J. Phys. Chem. Lett., 2013, 4, 2999–3005 CrossRef CAS.
- M. Maqbool, G. Rehman, L. Ali, M. Shafiq, R. Iqbal, R. Ahmad, T. Khan, S. Jalali-Asadabadi, M. Maqbool and I. Ahmad, J. Alloys Compd., 2017, 705, 828–839 CrossRef.
- T. Hakamata, K. Shimamura, F. Shimojo, R. K. Kalia, A. Nakano and P. Vashishta, Sci. Rep., 2016, 6, 19599 CrossRef CAS PubMed.
- S. D. Stranks and H. J. Snaith, Nat. Nanotechnol., 2015, 10, 391–402 CrossRef CAS PubMed.
- S. D. Stranks, G. E. Eperon, G. Grancini, C. Menelaou, M. J. P. Alcocer, T. Leijtens, L. M. Herz, A. Petrozza and H. J. Snaith, Science, 2013, 342, 341–344 CrossRef CAS PubMed.
- Z. Shi, S. Li, Y. Li, H. Ji, X. Li, D. Wu, T. Xu, Y. Chen, Y. Tian, Y. Zhang, C. Shan and G. Du, ACS Nano, 2018, 12, 1462–1472 CrossRef CAS PubMed.
- Z. Shi, Y. Li, Y. Zhang, Y. Chen, X. Li, D. Wu, T. Xu, C. Shan and G. Du, Nano Lett., 2017, 17, 313–321 CrossRef CAS PubMed.
- Z.-F. Shi, Y. Li, S. Li, H.-F. Ji, L.-Z. Lei, D. Wu, T.-T. Xu, J.-M. Xu, Y.-T. Tian and X.-J. Li, J. Mater. Chem. C, 2017, 5, 8699–8706 RSC.
- D. T. Moore, J. M. Luther, T. Chakrabarti, J. A. Christians, A. R. Marshall, E. M. Sanehira, A. Swarnkar and B. D. Chernomordik, Science, 2016, 354, 92–95 CrossRef PubMed.
- M. S. Kirschner, B. T. Diroll, P. Guo, S. M. Harvey, W. Helweh, N. C. Flanders, A. Brumberg, N. E. Watkins, A. A. Leonard, A. M. Evans, M. R. Wasielewski, W. R. Dichtel, X. Zhang, L. X. Chen and R. D. Schaller, Nat. Commun., 2019, 10, 504 CrossRef CAS PubMed.
- C. Chen, X. Hu, W. Lu, S. Chang, L. Shi, L. Li, H. Zhong and J.-B. Han, J. Phys. D. Appl. Phys., 2018, 51, 45105 CrossRef.
- M. Imran, V. Caligiuri, M. Wang, L. Goldoni, M. Prato, R. Krahne, L. De Trizio and L. Manna, J. Am. Chem. Soc., 2018, 140, 2656–2664 CrossRef CAS PubMed.
- A. Dey, P. Rathod and D. Kabra, Adv. Opt. Mater., 2018, 6, 1–9 CAS.
- S. Yakunin, M. I. Bodnarchuk, M. V. Kovalenko, A. Walsh, F. Krieg, R. Caputo, C. H. Hendon, L. Protesescu and R. X. Yang, Nano Lett., 2015, 15, 3692–3696 CrossRef PubMed.
- G. E. Eperon, G. M. Paternò, R. J. Sutton, A. Zampetti, A. A. Haghighirad, F. Cacialli and H. J. Snaith, J. Mater. Chem. A, 2015, 3, 19688–19695 RSC.
- H. Zhou, S. Yuan, X. Wang, T. Xu, X. Wang, H. Li, W. Zheng, P. Fan, Y. Li, L. Sun and A. Pan, ACS Nano, 2016, 11, 1189 CrossRef PubMed.
- V. YP, Physica, 1967, 34, 149 CrossRef.
- C. Yu, Z. Chen, J. Wang, W. Pfenninger, N. Vockic, J. T. Kenney and K. Shum, J. Appl. Phys., 2011, 110, 063526 CrossRef.
- L. Huang and W. R. L. Lambrecht, Phys. Rev. B: Condens. Matter Mater. Phys., 2013, 88, 165203 CrossRef.
- A. Shinde, R. Gahlaut and S. Mahamuni, J. Phys. Chem. C, 2017, 121, 14872–14878 CrossRef CAS.
- S. Hirotsu, J. Phys. Soc. Japan, 1971, 31, 552–560 CrossRef CAS.
- M. I. Cohen, K. F. Young, T. T. Chang and W. S. Brower, J. Appl. Phys., 1971, 42, 5267–5272 CrossRef CAS.
- J. A. Cape, R. L. White and R. S. Feigelson, J. Appl. Phys., 1969, 40, 5001–5005 CrossRef CAS.
- M. Hidaka, Y. Okamoto and Y. Zikumaru, Phys. Status Solidi, 1983, 263, 263–269 CrossRef.
- C. Carabatos-Nédelec, M. Oussaïd and K. Nitsch, J. Raman Spectrosc., 2003, 34, 388–393 CrossRef.
- B. T. Diroll, H. Zhou and R. D. Schaller, Adv. Funct. Mater., 2018, 28, 1800945 CrossRef.
- S. Rudin, T. L. Reinecke and B. Segall, Phys. Rev. B: Condens. Matter Mater. Phys., 1990, 42, 11218–11231 CrossRef CAS PubMed.
- A. D. Wright, C. Verdi, R. L. Milot, G. E. Eperon, M. A. Pérez-Osorio, H. J. Snaith, F. Giustino, M. B. Johnston and L. M. Herz, Nat. Commun., 2016, 7, 11755 CrossRef PubMed.
- R. Saran, A. Heuer-Jungemann, A. G. Kanaras and R. J. Curry, Adv. Opt. Mater., 2017, 5, 1–9 Search PubMed.
Footnote |
| † Electronic supplementary information (ESI) available. See DOI: 10.1039/d0na00545b |
| This journal is © The Royal Society of Chemistry 2020 |