 Open Access Article
Co-Modification of commercial TiO2 anode by combining a solid electrolyte with pitch-derived carbon to boost cyclability and rate capabilities†
Ling-Yun
Kong
a,
Jing
An
a,
Shu-Xian
Kang
a,
Meng
Huang
a,
Huan
Yang
a,
Hui-Ling
Zhu
b,
Yong-Xin
Qi
a,
Xue
Bai
b,
Ning
Lun
*a and
Yu-Jun
Bai
 *a
*a
aKey Laboratory of Liquid-Solid Structural Evolution & Processing of Materials, Ministry of Education, Shandong University, Jinan 250061, PR China. E-mail: byj97@sdu.edu.cn; lunning66@sdu.edu.cn; Fax: +86 531 88392315; Tel: +86 531 88392315
bSchool of Materials Science and Engineering, Shandong University of Science and Technology, Qingdao, 266590, PR China
First published on 15th April 2020
Abstract
The bad electrochemical performance circumscribes the application of commercial TiO2 (c-TiO2) anodes in Li-ion batteries. Carbon coating could ameliorate the electronic conductivity of TiO2, but the ionic conductivity is still inferior. Herein, a co-modification method was proposed by combining the solid electrolyte of lithium magnesium silicate (LMS) with pitch-derived carbon to concurrently meliorate the electronic and ionic conductivities of c-TiO2. The homogeneous mixtures were heated at 750 °C, and the co-modified product with suitable amounts of LMS and carbon demonstrates cycling capacities of 256.8, 220.4, 195.9, 176.4, and 152.0 mA h g−1 with multiplying current density from 100 to 1600 mA g−1. Even after 1000 cycles at 500 mA g−1, the maintained reversible capacity was 244.8 mA h g−1. The superior rate performance and cyclability correlate closely with the uniform thin N-doped carbon layers on the surface of c-TiO2 particles to favor the electrical conduction, and with the ion channels in LMS as well as the cation exchangeability of LMS to facilitate the Li+ transfer between the electrolyte, carbon layers, and TiO2 particles. The marginal amount of fluoride in LMS also contributes to the excellent cycling stability of the co-modified c-TiO2.
1. Introduction
The lithium-ion battery (LIB) as an energy storage system exhibits both high energy density and high safety. Nevertheless, the commercial LIBs with graphite anode cannot completely meet the requirements of the advanced energy storage systems owing to the poor rate capability and cyclability. Therefore, it is essential to explore suitable anode materials for large LIBs, especially when used in electric vehicles, grids, etc.Among the varieties of anode materials, TiO2 has been deemed to be one of the candidates on account of its outstanding cyclic reversibility with an inappreciable volume expansion (ca. 4%), high rate capability, and safety, especially the advantages for commercial TiO2 (c-TiO2) lie in the abundance, low cost, and environmental benignancy. However, the main drawbacks are the poor electronic conductivity and low Li-ion mobility as a result of the large band-gap and high energy barrier for Li-ion diffusion.1 Several strategies have been adopted to tackle these issues. Carbon coating is an effective method to enhance storage capacity and electrochemical kinetics.2–4 Among the carbon precursors, pitch as a typical soft carbon (SC) source could be readily pyrolyzed into carbon with a high graphitization degree, and the electrode materials coated with SC reveal enhanced conductivity.5–7 Additionally, the low softening temperature of the coal tar pitch makes it easy to create a carbon coating on metal oxides.8 However, the anatase TiO2 anode coated with the SC derived from pitch revealed a capacity retention (CR) of only 48.7% after 1000 cycles at a current rate of 0.5 A g−1,9 possibly because of the poor rate performance resulting from the sluggish Li-ion diffusion in the carbon materials.10–12
In contrast to the excellent electronic conductivity, the Li-ion diffusion of carbon materials is inferior, and hence, the Li+ conductivity of the carbon-coated TiO2 anode is poor. Nevertheless, solid Li-ion conductors facilitate Li+ diffusion. For example, the Ti-based oxide anodes modified by Li1.3Al0.3Ti1.7(PO4)3,13 Li2SiO3,14 Li2ZrO3,15 and LiNaAl22O34 (ref. 16) exhibited both outstanding rate capabilities and remarkable cycling stability. Despite the good ionic conductivity, the electron conductivity of these conductors is poor. If a hybrid material containing both carbon and an appropriate amount of solid electrolyte is employed to concurrently modify the c-TiO2, it is expected to achieve an optimized electrochemical performance, just like what happened for the LiFePO4 co-modified by LaPO4 and carbon.17
Lithium magnesium silicate (LMS) with good absorbability and cation exchangeability demonstrates Li-ion transport rate over 95% in a composited electrolyte and an electrical conductivity of 2 × 10⁻⁴ S cm−1 at ambient temperature.18,19 Furthermore, LMS is apt to coat on the surface of oxides in the sol state. The Ti-based oxide anodes of Li4Ti5O12 (ref. 20) and Li2ZnTi3O8 (ref. 21) modified by LMS demonstrated greatly enhanced performance.
In view of the above analysis, in this work, c-TiO2 was co-modified by combining the solid electrolyte of LMS with the pitch-derived carbon to concurrently ameliorate the electronic and ionic conductivities of c-TiO2 so as to optimize the electrochemical performance. The modification mechanism is discussed by virtue of diverse characterization methods.
2. Experimental section
2.1 Preparation of materials
c-TiO2 was purchased from Panzhihua TaiDu Chemical Industry Co. Ltd. The ingredients of LMS was provided by the manufacturer: 55–57 wt% SiO2, 23.5–25.0 wt% MgO, 2.8–3.8 wt% Na2O, 1.2–1.5 wt% Li2O, 5–5.8 wt% F. N-Methyl-2-pyrrolidone (NMP) and poly(vinylidene fluoride) (PVDF), bought from Sinopharm Chemical Reagent Co. Ltd, were of analytical grade. The electrolyte (LiPF6 dissolved in ethyl carbonate and dimethyl carbonate in a volume ratio of 1![[thin space (1/6-em)]](https://www.rsc.org/images/entities/char_2009.gif) :
:![[thin space (1/6-em)]](https://www.rsc.org/images/entities/char_2009.gif) 1) was purchased from Shenzhen Biyuan Electronics.
1) was purchased from Shenzhen Biyuan Electronics.
The co-modification process of c-TiO2 by LMS and coal tar pitch is as follows. LMS was dissolved in 15 mL deionized water at 60 °C via magnetic stirring for 20.0 min, and then 3.5 g c-TiO2 was added into the solution and stirred for another 10.0 min; next, 0.48 g coal tar pitch and 15 mL ethyl alcohol were dispersed in the suspension under magnetic stirring and stirred for 60.0 min. After thoroughly drying at 105 °C in air for 12 h, the mixture was heated in a tube furnace at 750 °C for 5 h in N2 atmosphere. According to the LMS content in the mixture, the as-sintered products were labelled as TiO2/C (0 wt% LMS), LMS1 (0.5 wt% LMS), LMS2 (1.5 wt% LMS), and LMS3 (2.4 wt% LMS).
Detailed characterization methods and electrochemical tests are supplied in the ESI.†
3. Results and discussion
3.1 Structure analysis
The microstructures of the as-prepared samples were inspected by transmission electron microscopy (TEM) (Fig. 1). After sintering at 750 °C for 5 h, the grain size of the co-modified TiO2 was about 10–20 nm (Fig. 1a). The lattice spacing of 0.35 nm (Fig. 1b) was consistent with that of the (101) plane of anatase TiO2, corroborating the identical anatase structure of the co-modified TiO2. Carbon coating with one or two graphene layers was distinguished around the c-TiO2 crystallites (Fig. 1b, d, and S1†), which linked the nanoparticles to form aggregates with a reticular structure, favorable to improve the electronic conductivity both in individual nanoparticles and among the nanoparticles. However, the coating in LMS1, LMS2, and LMS3 was somewhat different from that in TiO2/C in terms of graphitization degree because the presence of LMS within carbon suppresses the graphitization to a certain degree.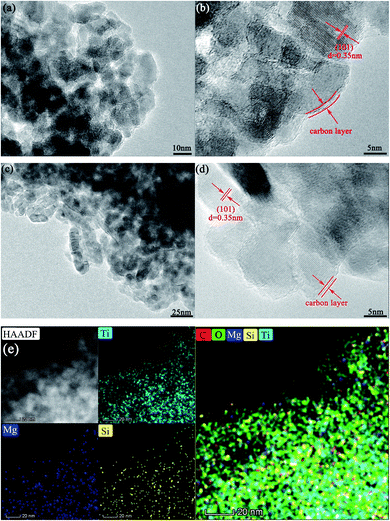 | ||
| Fig. 1 The TEM images of TiO2/C (a and b) and LMS2 (c and d). (e) The HAADF-STEM image of LMS2 and EDS mappings: Ti map, Mg map, Si map, and mixed color map of C, O, Mg, Si, and Ti. | ||
Little LMS was detected by TEM because of the low additive content, poor crystallization degree, and instability under the irradiation of high-energy electron beams20 (Fig. 1c and S1†). To determine the presence of LMS, the microstructure of LMS3 with the highest LMS content was scrutinized, and some layered structures were detected to distribute between the TiO2 grains or on the surface of TiO2 particles (Fig. S1†). Though the irradiation of high-energy electron beams results in the amorphization of LMS, the metastable structure was favorable for Li-ion transfer at low temperatures. Upon combining the HAADF-STEM examination and EDS mapping of LMS2 in Fig. 1e, the distribution of Si and Mg gives further evidence for LMS around the c-TiO2 crystallites. More microstructures are supplied in Fig. S1 of ESI.†
In the X-ray diffraction (XRD) patterns of the co-modified TiO2 sintered at 750 °C for 5 h (Fig. 2a), the diffraction peaks pertain well to those of the anatase TiO2 (JPCDS no. 21-1272). The average grain sizes calculated by the Scherrer equation (D = Kλ/β![[thin space (1/6-em)]](https://www.rsc.org/images/entities/char_2009.gif) cos
cos![[thin space (1/6-em)]](https://www.rsc.org/images/entities/char_2009.gif) θ with K-constant, λ-wavelength of X-rays, β-full width at half maximum, and θ-Bragg angle) based on the (101) plane were about 37.5, 17.8, 17.3, 17.2, and 17.7 nm for TiO2, TiO2/C, LMS1, LMS2, and LMS3, respectively. Evidently, the grain growth of TiO2 was hindered by coating carbon due to the prevention of atom diffusion and particle agglomeration. The smaller crystallite size could shorten the Li-ion diffusion distance during charging and discharging. From the enlarged (101) peaks (Fig. 2b), the analogous left shift of the diffraction angle for both the co-modified TiO2 and TiO2/C denotes the presence of similar element-doping in TiO2, as demonstrated by the X-ray photoelectron spectroscopy (XPS) analysis.
θ with K-constant, λ-wavelength of X-rays, β-full width at half maximum, and θ-Bragg angle) based on the (101) plane were about 37.5, 17.8, 17.3, 17.2, and 17.7 nm for TiO2, TiO2/C, LMS1, LMS2, and LMS3, respectively. Evidently, the grain growth of TiO2 was hindered by coating carbon due to the prevention of atom diffusion and particle agglomeration. The smaller crystallite size could shorten the Li-ion diffusion distance during charging and discharging. From the enlarged (101) peaks (Fig. 2b), the analogous left shift of the diffraction angle for both the co-modified TiO2 and TiO2/C denotes the presence of similar element-doping in TiO2, as demonstrated by the X-ray photoelectron spectroscopy (XPS) analysis.
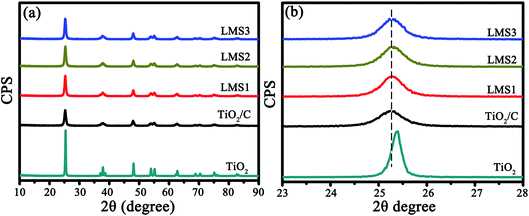 | ||
| Fig. 2 The XRD patterns of TiO2, TiO2/C, LMS1, LMS2, and LMS3 (a) as well as the magnified patterns for the (101) plane of TiO2 (b). | ||
3.2 XPS
The interaction of c-TiO2 with LMS and the carbon derived from coal tar pitch was further assessed by XPS. Taking LMS2 as an example, the elements Li, Si, Mg, N, F, Ti, and O were present in the survey spectrum (Fig. 3a), where the N element originates from the nitrogenous organic molecules in coal tar pitch (such as pyrrole)22 and the F element from LMS. The slightly asymmetric C 1s spectrum could be fitted into four peaks (Fig. 3b), i.e., the characteristic C–C bonds at 284.8 eV, C![[double bond, length as m-dash]](https://www.rsc.org/images/entities/char_e001.gif) N bonds at 285.8 eV, C–O bonds at 286.8 eV, and C–F bonds at 289.0 eV. The deconvoluted F 1s spectrum (Fig. 3g) includes four components, namely C–F, Li–F, Mg–F, and Na–F at around 688.3, 686.7, 685.25, and 684.3 eV, respectively. Both the N and F-doped carbon coating will produce a positive effect on the electrochemical performance.23–26 The deconvolution of the Ti 2p spectrum (Fig. 3c) yields three peaks, i.e. peaks corresponding to Ti 2p3/2 at around 459.4 eV and Ti 2p1/2 at around 464.2 eV, and an extra peak at around 460.3 eV that stemmed from the N–Ti–O linkage, which is responsible for the augmented lattice parameters of TiO2 in the XRD patterns.27–29 The N 1s spectrum could be deconvoluted into Ti–N, pyridinic-N, pyrrolic-N, and graphitic-N at around 396.2, 398.2, 400.1, and 401.6 eV, respectively30 (Fig. 3h), demonstrating N-doping in both carbon and TiO2. Besides the Si 2p spectrum with a peak at around 103.6 eV (Fig. 3f), the fitted Li 1s spectrum contains two peaks of Li–F (55.7 eV) and Li–O (55.5 eV) (Fig. 3d) and the fitted Mg 2p spectrum consists of three peaks of Mg–F (50.9 eV), Mg–O in LMS (51.2 eV), and MgO (50.3 eV) (Fig. 3e). Apparently, the XPS spectra of LMS2 reveals the presence of Li–O, Mg–O, and Si–O bonds with their binding energies close to those in LMS (Fig. 3), providing further evidence for LMS and the composition. The N-doped TiO2 coated with the N- and F-doped carbon contributes to enhancing the electron conduction, and the marginal amount of fluoride was found to be favorable to boost the cycling stability of the anode materials.31
N bonds at 285.8 eV, C–O bonds at 286.8 eV, and C–F bonds at 289.0 eV. The deconvoluted F 1s spectrum (Fig. 3g) includes four components, namely C–F, Li–F, Mg–F, and Na–F at around 688.3, 686.7, 685.25, and 684.3 eV, respectively. Both the N and F-doped carbon coating will produce a positive effect on the electrochemical performance.23–26 The deconvolution of the Ti 2p spectrum (Fig. 3c) yields three peaks, i.e. peaks corresponding to Ti 2p3/2 at around 459.4 eV and Ti 2p1/2 at around 464.2 eV, and an extra peak at around 460.3 eV that stemmed from the N–Ti–O linkage, which is responsible for the augmented lattice parameters of TiO2 in the XRD patterns.27–29 The N 1s spectrum could be deconvoluted into Ti–N, pyridinic-N, pyrrolic-N, and graphitic-N at around 396.2, 398.2, 400.1, and 401.6 eV, respectively30 (Fig. 3h), demonstrating N-doping in both carbon and TiO2. Besides the Si 2p spectrum with a peak at around 103.6 eV (Fig. 3f), the fitted Li 1s spectrum contains two peaks of Li–F (55.7 eV) and Li–O (55.5 eV) (Fig. 3d) and the fitted Mg 2p spectrum consists of three peaks of Mg–F (50.9 eV), Mg–O in LMS (51.2 eV), and MgO (50.3 eV) (Fig. 3e). Apparently, the XPS spectra of LMS2 reveals the presence of Li–O, Mg–O, and Si–O bonds with their binding energies close to those in LMS (Fig. 3), providing further evidence for LMS and the composition. The N-doped TiO2 coated with the N- and F-doped carbon contributes to enhancing the electron conduction, and the marginal amount of fluoride was found to be favorable to boost the cycling stability of the anode materials.31
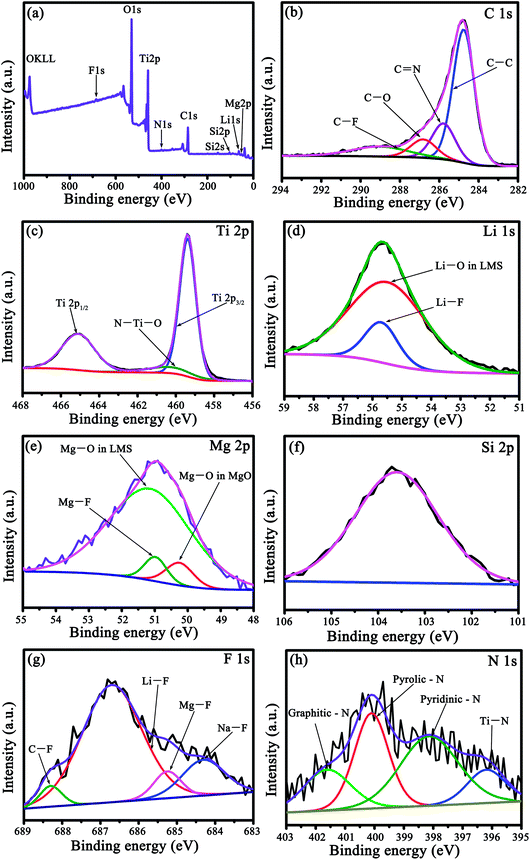 | ||
| Fig. 3 The XPS spectra of LMS2. (a) The Survey spectrum, (b) C 1s, (c) Ti 2p, (d) Li 1s, (e) Mg 2p, (f) Si 2p, (g) F 1s, and (h) N 1s. | ||
3.3 Thermogravimetric analysis (TGA) and Raman spectroscopy (RS)
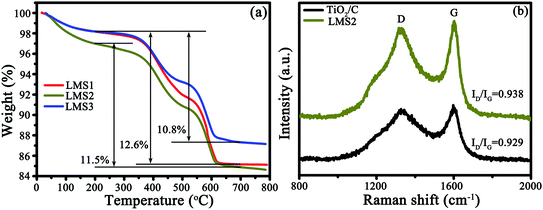
The presence of carbon and its content were identified by TGA and RS, as exemplified by TiO2/C and LMS2 (Fig. 4). The mass loss in the temperature ranges of 25–200, 200–500 and 500–620 °C represents the evaporation of moisture absorbed, the oxidation of amorphous carbon and graphitic carbon, respectively32,33 (Fig. 4a). The mass ratio for the amorphous to graphitic carbon was ca. 1![[thin space (1/6-em)]](https://www.rsc.org/images/entities/char_2009.gif) :
:![[thin space (1/6-em)]](https://www.rsc.org/images/entities/char_2009.gif) 1. The carbon content was 12.6, 11.5, and 12.6 wt% for LMS1, LSM2, and LMS3, respectively. In analogy, the carbon content in TiO2/C was 12.8 wt% (Fig. S2†).
1. The carbon content was 12.6, 11.5, and 12.6 wt% for LMS1, LSM2, and LMS3, respectively. In analogy, the carbon content in TiO2/C was 12.8 wt% (Fig. S2†).
In the Raman spectra (Fig. 4b), two characteristic bands at ca. 1360 (D-band) and 1590 cm−1 (G-band) further confirm the presence of carbon. The average intensity ratio of the two bands (ID/IG) was 0.935, 0.969, 0.975, and 0.967 for TiO2/C, LMS1, LMS2, and LMS3 (Fig. 4b and S3†), respectively, signifying that the addition of LMS slightly hindered the graphitization of the pitch-derived carbon, consistent with the TEM observation.
3.4 Electrochemical performance
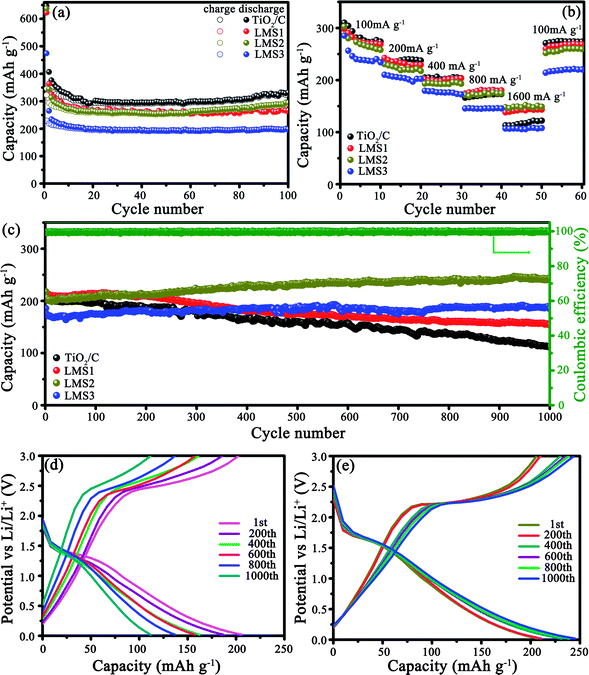
The electrochemical properties of the co-modified TiO2 and TiO2/C were evaluated by galvanostatically discharging/charging at 100 mA g−1 (Fig. 5a). The initial discharge/charge capacities for TiO2/C, LMS1, LMS2, and LMS3 were 646.6/346.3, 622.3/323.8, 637.4/322.5, and 474.5/229.2 mA h g−1, respectively, and the irreversible capacity stems from the creation of the SEI films and some other irreversible electrochemical reactions with the electrolyte.34 After 100 cycles, TiO2/C displayed a discharge capacity of 328.7 mA h g−1, which is higher than those of LMS1 (265.2 mA h g−1) and LMS2 (290.5 mA h g−1). Especially, LMS3 with the highest LMS content exhibited the lowest discharge capacity of 196.9 mA h g−1 after 100 cycles. Thus, the addition of LMS influences the performance greatly. Moreover, despite the slight capacity decay in the initial several cycles, the coulombic efficiency approaches nearly 100% thereafter, manifesting the superior reversibility of the co-modified TiO2 and TiO2/C.Rate capabilities were evaluated by altering the discharge/charge rate (Fig. 5b), and the mean discharge capacities and CR are collected in Table 1. Apparently, the CR of LMS1, LMS2, and LMS3 were higher than that of TiO2/C at the corresponding current rate. Especially, the capacity of LMS2 fades slowly with an increase in the current rate, attaining the highest CR at each current rate and the highest capacity at 1600 mA g−1, thereby revealing the best rate performance among the samples. In contrast, TiO2/C and LMS3 demonstrate poor high-rate performance due to the absence of LMS and excess LMS, respectively.
| Sample | Capacity/CR with altering the current rate | ||||
|---|---|---|---|---|---|
| 100 | 200 | 400 | 800 | 1600 | |
| TiO2/C | 285.4/100 | 238.2/83.5 | 204.1/71.5 | 170.6/59.8 | 117.5/41.2 |
| LSM1 | 277.1/100 | 233.1/84.1 | 201.0/72.5 | 179.1/64.6 | 142.0/51.2 |
| LSM2 | 256.8/100 | 220.4/85.8 | 195.9/76.3 | 176.4/68.7 | 152.0/59.2 |
| LSM3 | 234.0/100 | 204.7/86.3 | 176.0/75.2 | 145.8/62.3 | 108.4/46.3 |
The cycling stability was identified at 500 mA g−1 after the rate performance evaluation (Fig. 5c–e). After undergoing 1000 cycles, LMS1 and LMS3 exhibited reversible capacities of 154.3 and 187.1 mA h g−1 with the CR of 71.4% and 100%, respectively. For TiO2/C, the initial discharge capacity of 204.3 mA h g−1 fades continuously to 111.7 mA h g−1 with the CR of only 54.7%. In particular, LMS2 reveals the most preferable cyclability, achieving a discharge capacity of 244.8 mA h g−1 after 1000 cycles with a coulombic efficiency of nearly 100%. The superior reversibility and cycling stability of the co-modified TiO2 to TiO2/C demonstrate the important role of LMS for the performance of TiO2, and the appropriate LMS content brings about the optimal performance.
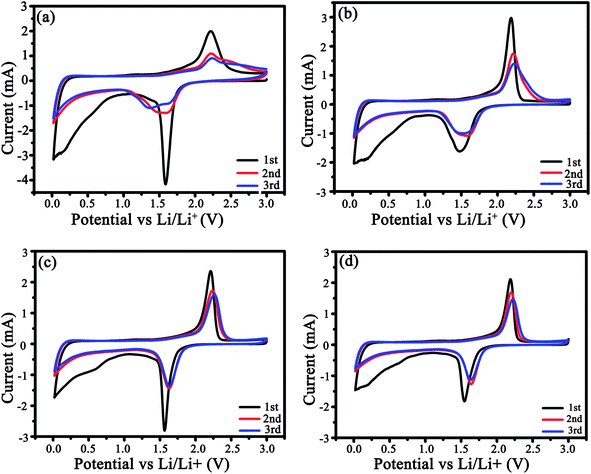
The CV profiles were measured for three cycles (Fig. 6). In the 1st cycle (Fig. 6a and b), a couple of redox peaks around 1.5/2.25 V attribute to Li+ intercalation/deintercalation in anatase TiO2, i.e., TiO2 + xLi+ + xe ↔LixTiO2 (0 ≤ x ≤ 0.5),35,36 and a weak cathodic peak at ca. 0.58 V correlates with the creation of the SEI films. From Fig. 6 and S4,† it is clear that the as-modified TiO2 could store a considerable amount of Li ions below 1.0 V due to the pseudocapacitive interfacial storage effect37,38 and Li+ intercalation in carbon.39,40 In the 3rd cycle, the potential difference between the redox peaks were 0.7, 0.63, and 0.59 V for LMS1, LMS2, and LMS3, respectively, which is distinctly smaller than that for TiO2/C (0.87 V), thereby denoting the alleviated polarization in the presence of LMS.41 Similar results are also reflected by the discharge–charge curves of TiO2/C and LMS2 in Fig. 6d and e. On the contrary, both the cathodic and anodic peaks for TiO2/C reveal poor coincidence and larger hysteresis (Fig. 6a), implying the inferior electrochemical kinetics of the samples with LMS.
The Li+ diffusion coefficient (DLi+) was computed by virtue of the CV data based on eqn (1).42,43
| Ip = 2.69 × 10⁵n3/2AD1/2ν1/2ΔC0 | (1) |
The DLi+ values computed by eqn (1) are tabulated in Table 2. Compared to the DLi+ for TiO2/C, the appropriate addition of LMS brings about more than three times increase in the DLi+ value because of the interaction between LMS and the electrolyte. Especially, LMS2 exhibits the largest DLi+ value. However, the DLi+ value does not increase constantly with the increasing LMS content, just like what occurred in other modified electrode materials,14,20,21 because excess LMS will lead to a decrease in the electrical conductivity, thereby resulting in the mismatch between the electronic and ionic conductivities. Therefore, only the proper mass ratio of LMS/TiO2 (say 0.015) could achieve a good match between Li+ diffusion and electrical conduction, contributing to the utmost optimization of the electrochemical property.
| Sample | I p/mA | D Li+/cm2 s−1 |
|---|---|---|
| TiO2/C | 0.906 | 2.82 × 10⁻¹¹ |
| LMS1 | 1.398 | 6.71 × 10⁻¹¹ |
| LMS2 | 1.600 | 8.80 × 10⁻¹¹ |
| LMS3 | 1.467 | 7.39 × 10⁻¹¹ |
The electrochemical kinetics of the co-modified c-TiO2 was further surveyed by EIS after three CV cycles (Fig. 7). In the Nyquist plots (Fig. 7a), the consistency of the fitting results with the experimental ones implies the rationality of the equivalent circuit in the inset. The impedance values of the modified TiO2 that stemmed from the equivalent circuit are collected in Table 3, where RS is the ohmic resistance from the electrolyte, RLMS is the resistance from LMS, RSEI is the resistance from the SEI films, Rct is the charge transfer resistance, and Zw is the Warburg impedance. The RSEI, RLMS, and Rct values increase gradually with the increasing LMS content due to the poor electrical conductivity of LMS. In other words, LMS functions partially as the SEI films.
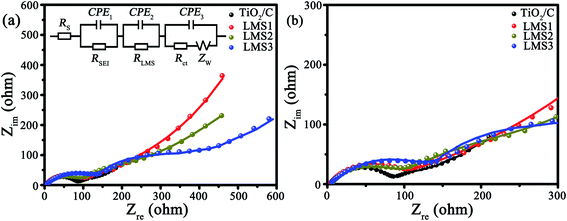 | ||
| Fig. 7 (a) EIS as well as the corresponding equivalent circuit, and (b) the enlarged EIS at high frequency. | ||
| Sample | R S/Ω | R SEI/Ω | R LMS/Ω | R ct/Ω | R T/Ω |
|---|---|---|---|---|---|
| TiO2/C | 2.0 | 42.9 | — | 53.1 | 98.0 |
| LSM1 | 3.2 | 54.5 | 189.5 | 92.3 | 339.5 |
| LSM2 | 3.1 | 75.3 | 267.2 | 102.0 | 447.6 |
| LSM3 | 2.2 | 74.3 | 292.7 | 103.2 | 472.4 |
3.5 Discussion
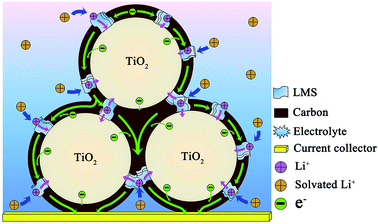
According to the literature,9 when c-TiO2 was modified by the SC derived from pitch, the performance could be greatly improved compared to the pristine c-TiO2. However, the capacity still faded with cycling at 500 mA g−1, i.e. the cycling stability was unsatisfactory. Jointly adopting pitch and LMS as the modifiers brings about the distinct enhancement in the rate performance and cycling stability, where the uniform carbon layers with high graphitization degree derived from pitch favor the electron transfer among the c-TiO2 particles (Fig. 1 and S1†), and LMS promotes the Li-ion migration in the carbon coating and c-TiO2 (Table 2). In spite of the inferior electronic conductivity of LMS as the solid electrolyte, its high ionic conductivity contributes to the Li-ion transfer,14,17,20,21,44 especially making up for the deficiency of low Li-ion diffusion in the carbon materials. Only when the electronic conductivity matched well with the ionic conductivity, the electrochemical performance could be optimized as large as possible. This is the reason that LMS2 exhibits optimal performance among the samples. In addition, the N-doping in TiO2 as well as the N- and F co-doping makes a contribution to the electrochemical performance.4,10,23–29,45 Combining the performance with the structure, microstructure, and composition, the co-modification mechanism could be briefly reflected by the illustration in Fig. 8. The N-doped carbon layers linking into a reticular structure promote the electron transfer both in the individual c-TiO2 nanoparticles and among the nanoparticles, while LMS between the TiO2 grains or on the surface of TiO2 nanoparticles contributes to the Li-ion exchange not only between the electrolyte and TiO2 nanoparticles but also among the nanoparticles.The electrochemical performance of LMS2 was compared with that of the other carbon-coated TiO2 reported in the literature, and is summarized in Table S1 of ESI.† Apparently, LMS2 presents much better electrochemical performances. As stated above, the excellent electrochemical performance of the carbon and LMS co-modified c-TiO2 is related to the following aspects. (1) The coal tar pitch with excellent flow ductility could adhere uniformly on the surface of TiO2 particles during heating and readily form uniform thin N-doped carbon layers during further carbonization at 750 °C to effectively ameliorate the electronic conductivity of c-TiO2. (2) The ion channels in LMS and the cation exchangeability of LMS promote the Li+ transfer between the electrolyte, carbon layers, and TiO2 particles. (3) LMS could behave as stable SEI films to prolong the cycle life of LIBs. (4) The marginal amount of fluorides in LMS was also responsible for the excellent cycling stability of the co-modified c-TiO2.46–49
4. Conclusions
In conclusion, the co-modification of c-TiO2 by combining the solid electrolyte of LMS and pitch-derived carbon brings about the optimal performance. Besides the formation of the uniform thin N-doped carbon layers on the surface of TiO2 particles to improve the electronic conductivity, the ion channels in LMS and the cation exchangeability of LMS facilitate the Li+ transfer between the electrolyte, carbon layers, and TiO2 particles, thus realizing the simultaneous enhancement in the electrical conduction and Li-ion diffusion. Accordingly, the co-modified c-TiO2 demonstrates excellent rate capabilities and cyclability. Therefore, the simple fabrication route and cheap modifiers, namely LMS and pitch, endow the co-modified c-TiO2 with promising applications in advanced LIBs, especially for electric vehicles.Conflicts of interest
There are no conflicts to declare.Acknowledgements
This work was supported by project ZR2019MEM029 of Shandong Provincial Natural Science Foundation, PR China, and National Natural Science Foundation of China (51902189).References
- Y. Yang, X. Ji, M. Jing, H. Hou, Y. Zhu, L. Fang, X. Yang, Q. Chen and C. E. Banks, J. Mater. Chem. A, 2015, 3, 5648–5655 RSC.
- J. Chen, Y. Li, J. Mu, Y. Zhang, Z. Yu, K. Han and L. Zhang, J. Alloys Compd., 2018, 742, 828–834 CrossRef CAS.
- N. Takezawa, H. Kobayashi, M. Senna, T. Matsumoto, K. Saeki, J. Shi and N. Suzuki, J. Phys. Chem. Solids, 2019, 125, 1–7 CrossRef CAS.
- M. Luo, X. Yu, W. Zhao, R. Xu, Y. Liu and H. Shen, ACS Appl. Mater. Interfaces, 2018, 10, 35060–35068 CrossRef CAS PubMed.
- X.-Y. Zhao, X. Bai, W. Yang, D. Shen, H. Yang, N. Lun, Y.-X. Qi and Y.-J. Bai, New J. Chem., 2016, 40, 9986–9992 RSC.
- K.-T. Kim, C.-Y. Yu, C. S. Yoon, S.-J. Kim, Y.-K. Sun and S.-T. Myung, Nano Energy, 2015, 12, 725–734 CrossRef CAS.
- K.-T. Kim, G. Ali, K. Y. Chung, C. S. Yoon, H. Yashiro, Y.-K. Sun, J. Lu, K. Amine and S.-T. Myung, Nano Lett., 2014, 14, 416–422 CrossRef CAS PubMed.
- K. Wang, D. Ju, G. Xu, Y. Wang, S. Chen, J. Zhang, Y. Wu and W. Zhou, Int. J. Hydrogen Energy, 2019, 44, 25199–25206 CrossRef CAS.
- L.-Y. Wang, X. Bai, Y. Wu, N. Lun, Y.-X. Qi and Y.-J. Bai, Electrochim. Acta, 2016, 212, 155–161 CrossRef CAS.
- X. Li, X. Zhu, Y. Zhu, Z. Yuan, L. Si and Y. Qian, Carbon, 2014, 69, 515–524 CrossRef CAS.
- C. Ma, X. Shao and D. Cao, J. Mater. Chem., 2012, 22, 8911–8915 RSC.
- J. Zhang, Z. Yang, J. Qiu and H.-W. Lee, J. Mater. Chem. A, 2016, 4, 5802–5809 RSC.
- J.-P. Han, B. Zhang, L.-Y. Wang, H.-L. Zhu, Y.-X. Qi, L.-W. Yin, H. Li, N. Lun and Y.-J. Bai, ACS Sustainable Chem. Eng., 2018, 6, 7273–7282 CrossRef CAS.
- X. Bai, T. Li, Z. Dang, Y.-X. Qi, N. Lun and Y.-J. Bai, ACS Appl. Mater. Interfaces, 2017, 9, 1426–1436 CrossRef CAS PubMed.
- J.-P. Han, B. Zhang, L.-Y. Wang, Y.-X. Qi, H.-L. Zhu, G.-X. Lu, L.-W. Yin, H. Li, N. Lun and Y.-J. Bai, ACS Appl. Mater. Interfaces, 2018, 10, 24910–24919 CrossRef CAS.
- B. Zhang, J.-P. Han, L.-Y. Wang, N. Lun, H.-L. Zhu, L.-W. Yin, H. Li, Y.-X. Qi and Y.-J. Bai, Appl. Surf. Sci., 2018, 447, 279–286 CrossRef CAS.
- Z. Ma, Y. Peng, G. Wang, Y. Fan, J. Song, T. Liu, X. Qin and G. Shao, Electrochim. Acta, 2015, 156, 77–85 CrossRef CAS.
- M. Riley, P. S. Fedkiw and S. A. Khan, J. Electrochem. Soc., 2002, 149, A667–A674 CrossRef CAS.
- R. G. Singhal, M. D. Capracotta, J. D. Martin, S. A. Khan and P. S. Fedkiw, J. Power Sources, 2004, 128, 247–255 CrossRef CAS.
- X. Bai, B. Zhang, G.-Z. Jiang, J.-P. Han, N. Lun, Y.-X. Qi, J. Qiu, G.-X. Lu, Z. Qian and Y.-J. Bai, Electrochim. Acta, 2019, 295, 891–899 CrossRef CAS.
- H. Yang, N. Lun, Y.-X. Qi, H.-L. Zhu, J.-R. Liu, J.-K. Feng, L.-l. Zhao and Y.-J. Bai, Electrochim. Acta, 2019, 315, 24–32 CrossRef CAS.
- J. Alcaniz-Monge, D. Cazorla-Amoros and A. Linares-Solano, Fuel, 2001, 80, 41–48 CrossRef CAS.
- D. Qu, X. Feng, X. Wei, L. Guo, H. Cai, H. Tang and Z. Xie, Appl. Surf. Sci., 2017, 413, 344–350 CrossRef CAS.
- L. Guo, H. He, Y. Ren, C. Wang and M. Li, Chem. Eng. J., 2018, 335, 32–40 CrossRef CAS.
- K. Meng, Q. Liu, Y. Huang and Y. Wang, J. Mater. Chem. A, 2015, 3, 6873–6877 RSC.
- J. Zhang, L. Qu, G. Shi, J. Liu, J. Chen and L. Dai, Angew. Chem., Int. Ed., 2016, 55, 2230–2234 CrossRef CAS.
- J. Yang, Z. Ju, Y. Jiang, Z. Xing, B. Xi, J. Feng and S. Xiong, Adv. Mater., 2018, 30, 1700104 CrossRef PubMed.
- Y. Xing, S. Wang, B. Fang, G. Song, D. P. Wilkinson and S. Zhang, J. Power Sources, 2018, 385, 10–17 CrossRef CAS.
- Y. Wu, X. Liu, Z. Yang, L. Gu and Y. Yu, Small, 2016, 12, 3522–3529 CrossRef CAS PubMed.
- S. Akula and A. Sahu, J. Electrochem. Soc., 2019, 166, F93–F101 CrossRef CAS.
- Y. Ma, B. Ding, G. Ji and J. Y. Lee, ACS Nano, 2013, 7, 10870–10878 CrossRef CAS.
- U. Lafont, L. Simonin, M. Gaberscek and E. Kelder, J. Power Sources, 2007, 174, 1104–1108 CrossRef CAS.
- Y. Zhang, C. Wang, H. Hou, G. Zou and X. Ji, Adv. Electron. Mater., 2016, 1600173 Search PubMed.
- D. Zhou, W.-L. Song, X. Li and L.-Z. Fan, Electrochim. Acta, 2016, 207, 9–15 CrossRef CAS.
- G. Nuspl, K. Yoshizawa and T. Yamabe, J. Mater. Chem., 1997, 7, 2529–2536 RSC.
- Y. Xiao, X. Wang, Y. Xia, Y. Yao, E. Metwalli, Q. Zhang, R. Liu, B. Qiu, M. Rasool and Z. Liu, ACS Appl. Mater. Interfaces, 2014, 6, 18461–18468 CrossRef CAS PubMed.
- Y. Liang, N. Li, F. Li, Z. Xu, Y. Hu, M. Jing, K. Teng, X. Yan and J. Shi, Electrochim. Acta, 2019, 279, 1063–1070 CrossRef.
- H. Wei, E. F. Rodriguez, A. F. Hollenkamp, A. I. Bhatt, D. Chen and R. A. Caruso, Adv. Funct. Mater., 2017, 27, 1703270 CrossRef.
- Y. F. Yuan, F. Chen, S. M. Yin, L. N. Wang, M. Zhu, J. L. Yang, Y. C. Wu and S. Y. Guo, J. Power Sources, 2019, 420, 38–45 CrossRef CAS.
- P. Zhang, J. Qiu, Z. Zheng, G. Liu, M. Ling, W. Martens, H. Wang, H. Zhao and S. Zhang, Electrochim. Acta, 2013, 104, 41–47 CrossRef CAS.
- P. Wei, Y. Liu, Y. Su, L. Miao, Y. Huang, Y. Liu, Y. Qiu, Y. Li, X. Zhang and Y. Xu, ACS Appl. Mater. Interfaces, 2018, 11, 3116–3124 CrossRef PubMed.
- L.-l. Wang, P.-h. Ma, K. Zhang, C.-h. Gao and C.-y. Yan, J. Salt Lake Res., 2009, 17, 52–55 Search PubMed.
- Y. Cui, X. Zhao and R. Guo, Electrochim. Acta, 2010, 55, 922–926 CrossRef CAS.
- C. Wang, Y. Gong, B. Liu, K. Fu, Y. Yao, E. Hitz, Y. Li, J. Dai, S. Xu and W. Luo, Nano Lett., 2016, 17, 565–571 CrossRef PubMed.
- M. Ren, H. Xu, F. Li, W. Liu, C. Gao, L. Su, G. Li and J. Hei, J. Power Sources, 2017, 353, 237–244 CrossRef CAS.
- M. Xia, Y.-r. Li, Y.-f. Wu, H.-b. Zhang, J.-k. Yang, N. Zhou, Z. Zhou and X. Xiong, Appl. Surf. Sci., 2019, 480, 410–418 CrossRef CAS.
- Y. Yang, Z. Wang, G. Yan, H. Guo, J. Wang, X. Li, Y. Zhou and R. Zhou, Ceram. Int., 2017, 43, 8590–8595 CrossRef CAS.
- S. Choudhury and L. A. Archer, Adv. Electron. Mater., 2016, 2, 1500246 CrossRef.
- M. Haruta, Y. Kijima, R. Hioki, T. Doi and M. Inaba, Nanoscale, 2018, 10, 17257–17264 RSC.
Footnote |
| † Electronic supplementary information (ESI) available. See DOI: 10.1039/d0na00192a |
| This journal is © The Royal Society of Chemistry 2020 |

