 Open Access Article
Creative Commons Attribution 3.0 Unported Licence
Excellent catalysis of Mn3O4 nanoparticles on the hydrogen storage properties of MgH2: an experimental and theoretical study†
Liuting
Zhang‡
 a,
Ze
Sun‡
a,
Zhendong
Yao‡
c,
Lei
Yang
a,
Nianhua
Yan
a,
Xiong
Lu
a,
Beibei
Xiao
a,
Xinqiao
Zhu
a,
Ze
Sun‡
a,
Zhendong
Yao‡
c,
Lei
Yang
a,
Nianhua
Yan
a,
Xiong
Lu
a,
Beibei
Xiao
a,
Xinqiao
Zhu
 *b and
Lixin
Chen
 *c
*c
aSchool of Energy and Power, Jiangsu University of Science and Technology, Zhenjiang 212003, China
bInstitute of Nuclear Physics and Chemistry, China Academy of Engineering Physics, Mianyang, 621999, China. E-mail: zhuxinqiao@zju.edu.cn; Tel: +86 17738406685
cState Key Laboratory of Silicon Materials, Department of Materials Science and Engineering, Zhejiang University, Hangzhou 310027, China. E-mail: lxchen@zju.edu.cn
First published on 9th March 2020
Abstract
Recently, transition metal oxides have been evidenced to be superior catalysts for improving the hydrogen desorption/absorption performance of MgH2. In this paper, Mn3O4 nanoparticles with a uniform size of around 10 nm were synthesized by a facile chemical method and then introduced to modify the hydrogen storage properties of MgH2. With the addition of 10 wt% Mn3O4 nanoparticles, the MgH2–Mn3O4 composite started to release hydrogen at 200 °C and approximately 6.8 wt% H2 could be released within 8 min at 300 °C. For absorption, the completely dehydrogenated sample took up 5.0 wt% H2 within 10 min under 3 MPa hydrogen even at 100 °C. Compared with pristine MgH2, the activation energy value of absorption for the MgH2 + 10 wt% Mn3O4 composite decreased from 72.5 ± 2.7 to 34.4 ± 0.9 kJ mol−1. The catalytic mechanism of Mn3O4 was also explored and discussed with solid evidence from X-ray diffraction (XRD), Transmission Electron Microscope (TEM) and Energy Dispersive X-ray Spectroscopy (EDS) studies. Density functional theory calculations revealed that the Mg–H bonds were elongated and weakened with the doping of Mn3O4. In addition, a cycling test showed that the hydrogen storage capacity and reaction kinetics of MgH2–Mn3O4 could be favourably preserved in 20 cycles, indicative of promising applications as a solid-state hydrogen storage material in a future hydrogen society.
1. Introduction
Faced with a global energy crisis and environmental issues, the world is crying out for sustainable clean energy sources.1–3 Hydrogen, which can generate electricity via fuel cells with nearly no emission of pollutants, is regarded as one of the most promising substitutes for fossil fuels.4–6 In order to store and transfer hydrogen conveniently, efficiently and safely, hydrogen storage materials with a moderate operating temperature, low cost, good dynamics and high hydrogen storage density are urgently required.7 Among numerous materials, magnesium hydride (MgH2) with high mass hydrogen storage capacity (7.76 wt%), good reversibility, low cost and other outstanding performances (LIB anode) has attracted intense attention worldwide.8–11 Nevertheless, two challenges (stable thermodynamics and poor kinetics) still need to be conquered before the large scale application of MgH2.12–14 In the past few decades, extensive research has been conducted to overcome these challenges through diverse methods, such as catalyst doping,15–20 alloying21–24 and nanotechnology.25–27According to previous reports, transition metals (TMs) and their compounds showed a quite effective influence on improving the hydrogen storage properties of MgH2.28–31 For example, Liu et al.32 synthesized a Co@CNT nanocatalyst by carbonizing zeolitic imidazolate framework-67 and doped it into MgH2. The experimental results showed that the onset temperature of MgH2 decreased to 267.8 °C with the addition of Co@CNTs and the dehydrogenation capacity of MgH2–Co@CNTs could reach 6.89 wt% at 300 °C within 15 min. For absorption, the MgH2–Co@CNTs could absorb 6.15 wt% H2 at 250 °C within 2 min. Cheng et al.33 found that Pd30Ni70/CMK-3 could significantly improve the de/re-hydrogenation performance of MgH2 at low temperature. About 6 wt% hydrogen could be released below 290 °C and 4 wt% hydrogen could be absorbed at 70 °C under a hydrogen pressure of 3 MPa within 18![[thin space (1/6-em)]](https://www.rsc.org/images/entities/char_2009.gif) 000 s. Besides pure metal, metal oxides, which can be easily synthesized, are preferred by scientists to improve the hydrogen storage performance of MgH2.34–38 Chen et al.39 found that a MgH2–Co/TiO2 composite started to desorb hydrogen at about 190 °C with a low apparent activation energy of 77 kJ mol−1. In addition, the dehydrogenated sample could absorb about 4.24 and 1.0 wt% hydrogen within 10 min at 100 and 50 °C, respectively. Bhatnagar et al.40 demonstrated that MgH2 catalyzed by Fe3O4@GS offers improved hydrogen storage behaviour. The MgH2–Fe3O4@GS had an onset desorption temperature of about 262 °C and the dehydrogenated sample could absorb 6.20 wt% hydrogen in 2.5 min under 15 atm H2 pressure at 290 °C. Mustafa et al.41 discovered that a MgH2-5 wt% CeO2 sample released about 3.6 wt% hydrogen in 30 min at 320 °C and the dehydrogenated sample could absorb approximately 3.95 wt% hydrogen within 5 min at 320 °C.
000 s. Besides pure metal, metal oxides, which can be easily synthesized, are preferred by scientists to improve the hydrogen storage performance of MgH2.34–38 Chen et al.39 found that a MgH2–Co/TiO2 composite started to desorb hydrogen at about 190 °C with a low apparent activation energy of 77 kJ mol−1. In addition, the dehydrogenated sample could absorb about 4.24 and 1.0 wt% hydrogen within 10 min at 100 and 50 °C, respectively. Bhatnagar et al.40 demonstrated that MgH2 catalyzed by Fe3O4@GS offers improved hydrogen storage behaviour. The MgH2–Fe3O4@GS had an onset desorption temperature of about 262 °C and the dehydrogenated sample could absorb 6.20 wt% hydrogen in 2.5 min under 15 atm H2 pressure at 290 °C. Mustafa et al.41 discovered that a MgH2-5 wt% CeO2 sample released about 3.6 wt% hydrogen in 30 min at 320 °C and the dehydrogenated sample could absorb approximately 3.95 wt% hydrogen within 5 min at 320 °C.
Apparently, both transition metals and their oxides can remarkably improve the hydrogen storage properties of MgH2. In our recent study,42 ZrMn2 was found to strikingly improve the hydrogen storage properties of MgH2; however, research on the catalytic effect of Mn based compounds on MgH2 has rarely been reported in the literature. In this work, Mn3O4 nanoparticles were successfully synthesized via a simple chemical method and adopted to enhance the comprehensive hydrogen storage properties of MgH2. To our knowledge, no studies have been conducted on doping Mn3O4 as a catalyst into MgH2. Further, the significantly improved hydrogenation and dehydrogenation performance of MgH2 catalyzed by Mn3O4 was systematically studied and the catalytic mechanism was also explored and discussed in detail.
2. Experimental
2.1 Sample preparation
All the chemical reagents were of analytical grade. The nano-Mn3O4 powder was prepared by decomposition of Mn(Ac)2·4H2O in diethylene glycol (DEG). Firstly, 2.45 g Mn(Ac)2·4H2O was dissolved into 100 ml DEG at a temperature of 80 °C. After this, the solution was heated to 160 °C in an oil bath pot and then kept for 8 h. After cooling to room temperature, the suspension was centrifuged and washed with deionized water and ethanol to remove the residual organic solvent. Finally, Mn3O4 nanoparticles (nano-Mn3O4) can be obtained after vacuum-drying at 70 °C for 10 hours.MgH2 was prepared in our laboratory. The magnesium (purity 99.99%) used was purchased from Sinopharm Chemical Reagent. Mg powder was first hydrogenated at 380 °C and under a hydrogen pressure of 65 bar for 2 h. Then the sample was ball-milled at 450 rpm for 5 h and MgH2 was synthesized by repeating the above hydrogenation treatment. The nano-Mn3O4 powder and MgH2 with mass ratios of 5![[thin space (1/6-em)]](https://www.rsc.org/images/entities/char_2009.gif) :
:![[thin space (1/6-em)]](https://www.rsc.org/images/entities/char_2009.gif) 95, 10
95, 10![[thin space (1/6-em)]](https://www.rsc.org/images/entities/char_2009.gif) :
:![[thin space (1/6-em)]](https://www.rsc.org/images/entities/char_2009.gif) 90 and 15
90 and 15![[thin space (1/6-em)]](https://www.rsc.org/images/entities/char_2009.gif) :
:![[thin space (1/6-em)]](https://www.rsc.org/images/entities/char_2009.gif) 85 were mixed by ball milling. Ball milling of the above samples was performed on a QM-3SP4 planetary ball mill (Nanjing) at 400 rpm for 2 h under 1 bar of Ar (the ball to material ratio is 40
85 were mixed by ball milling. Ball milling of the above samples was performed on a QM-3SP4 planetary ball mill (Nanjing) at 400 rpm for 2 h under 1 bar of Ar (the ball to material ratio is 40![[thin space (1/6-em)]](https://www.rsc.org/images/entities/char_2009.gif) :
:![[thin space (1/6-em)]](https://www.rsc.org/images/entities/char_2009.gif) 1). To avoid contamination and oxidation, all samples were handled and transferred in an Ar-filled glove box (Mikrouna) where the water/oxygen concentration was less than 0.1 ppm.
1). To avoid contamination and oxidation, all samples were handled and transferred in an Ar-filled glove box (Mikrouna) where the water/oxygen concentration was less than 0.1 ppm.
2.2 Sample characterization
The phase composition was analyzed by X-ray diffraction (XRD), which was carried out on an X'Pert Pro X-ray diffractometer (PANalytical, the Netherlands) with Cu K alpha radiation at 40 kV and 40 mA. A special container was used to prevent air and water contamination when samples were transferred and scanned. The morphology of samples was studied using scanning electron microscopy (SEM, Hitachi SU-70) and transmission electron microscopy (TEM, Tecnai G2 F20 STWIN) with energy dispersive spectroscopy (EDS). The hydrogen absorption and desorption results were obtained using Sieverts-type apparatus. Approximately 75 mg sample was heated to 430 °C at a heating rate of 2 °C min−1 in a stainless steel container during testing of the non-isothermal hydrogen desorption properties. Isothermal measurements were performed by quickly heating the sample to the target temperature and then keeping the temperature constant throughout the whole test. In addition, the isothermal absorption performance was measured at various temperatures under a hydrogen pressure of 30 bar while the isothermal desorption performance was tested at different temperatures under a hydrogen pressure below 0.01 bar.2.3 Theoretical methods
All calculations were carried out within the DMol3 code.43,44 The generalized gradient approximation with the Perdew–Burke–Ernzerhof (PBE) functional was used to describe the exchange and correlation effects.45 The DFT semi-core pseudopod (DSPP) core treatment method was used for relativistic effects and replaces the core electrons with an effective potential and introduces a degree of relativistic correction into the core.46 The double numerical atomic orbital augmented by a polarization function (DNP) was chosen as the basis set.47 To achieve the calculation convergence, a smearing of 0.005 Ha (1 Ha = 27.21 eV) to the orbital occupation was applied. In the geometry structural optimization, the convergence tolerances of energy, maximum force and displacement were 1.0 × 10⁻⁵ Ha, 0.002 Ha Å−1 and 0.005 Å, respectively.3. Results and discussion
3.1 Characterization of the prepared Mn3O4 nanoparticles
The structure and morphologies of the prepared Mn3O4 nanoparticles were analysed via XRD and TEM measurements, as shown in Fig. 1. Fig. 1a exhibits the TEM image of the Mn3O4 sample prepared by the simple chemical method. It can be clearly seen from the picture that the particle size of the as-prepared Mn3O4 ranged from 5 nm to 20 nm. Besides, the corresponding SAED image in Fig. 1b reveals that the diffraction rings correspond to the (211)/(220) of Mn3O4. In addition, it can be clearly seen from the particle size distribution curve that the size of prepared Mn3O4 was mainly concentrated in the range of 7 to 15 nm. The magnified TEM image of the marked part in Fig. 1c is shown in Fig. 1d, where the lattice planes corresponding to the (220) plane of Mn3O4 can be observed. The XRD examination result shown in Fig. 1e also indicates that the diffraction peak of Mn3O4 (PDF# 24-0734) can be clearly identified. Based on the TEM and XRD results, Mn3O4 nanoparticles were successfully synthesized and an outstanding catalytic effect on improving the hydrogen storage properties of MgH2 was expected.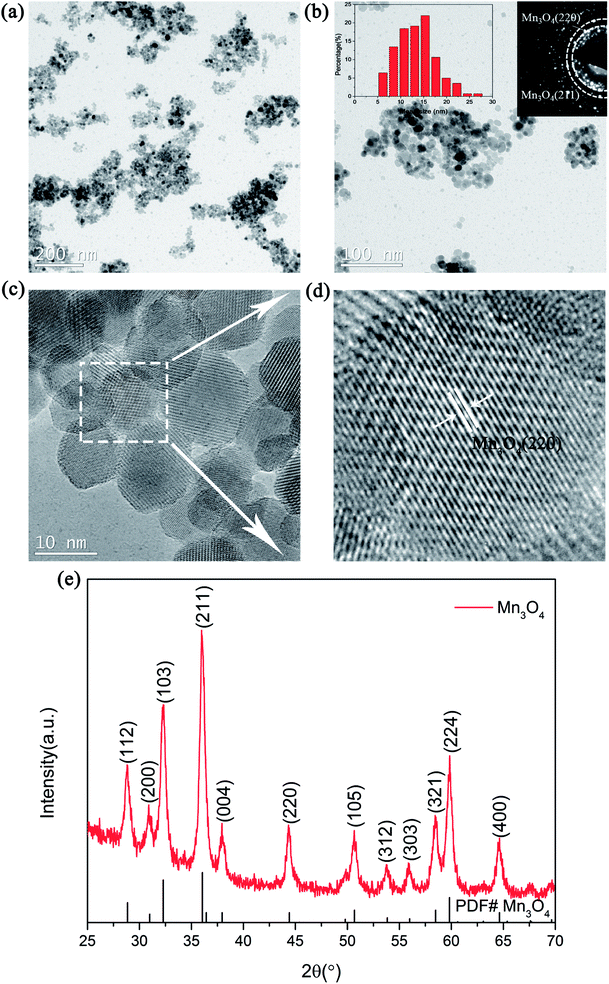 | ||
| Fig. 1 TEM images (a and c), TEM image with SAED patterns and particle size distribution curve (b), magnified TEM image (d) and XRD pattern (e) of the as-prepared Mn3O4 nanoparticles. | ||
3.2 Catalytic effect of the Mn3O4 nanoparticles on the hydrogen storage properties of MgH2
To examine the catalytic effect of Mn3O4 on the hydrogen desorption properties of MgH2, various amounts of Mn3O4 (5, 10 and 15 wt%) were doped into the MgH2 powders by ball-milling under a 1 bar Ar atmosphere for 2 h. The composites composed of MgH2 and x wt% Mn3O4 nanoparticles (x = 5, 10 and 15) were denoted as MgH2 + 5 wt% Mn3O4, MgH2 + 10 wt% Mn3O4 and MgH2 + 15 wt% Mn3O4, respectively. All of these milled composites were collected for structural characterization and property tests. Fig. 2a exhibits the XRD patterns of the Mn3O4-doped composites. Clearly, the MgH2 phase still dominated the XRD profiles and no obvious reacted phases occurred after ball milling. In addition, quite weak peaks of Mg can be seen in this pattern, which could be attributed to the unreacted Mg during synthesis.15 TPD (Temperature Programmed Desorption) analyses of different amounts of Mn3O4 nanoparticle doped MgH2 samples were also performed. Fig. 2b depicts the TPD curves of the above three composites and undoped MgH2 sample, revealing a single step of hydrogen release. It can be observed that the volumetric release curves of MgH2 + Mn3O4 composites shifted towards lower temperatures with the increasing added amount of Mn3O4. The as-synthesized MgH2 began to desorb hydrogen at 340 °C and released about 7.4 wt% hydrogen. With the addition of Mn3O4 nanoparticles, the initial desorption temperatures of the MgH2 + 5 wt% Mn3O4, MgH2 + 10 wt% Mn3O4 and MgH2 + 15 wt% Mn3O4 composites decreased to 230 °C, 200 °C and 200 °C, respectively. To further explore the hydrogen storage properties of the modified MgH2 systems, isothermal desorption measurements were carried out at 300 °C, as shown in Fig. 2c. The results show that the doping of Mn3O4 could significantly improve the hydrogen desorption kinetics of MgH2. The MgH2 + 5 wt% Mn3O4, MgH2 + 10 wt% Mn3O4 and MgH2 + 15 wt% Mn3O4 composites could desorb 6.9 wt%, 6.7 wt% and 6.2 wt% hydrogen in 8 min, while the pure MgH2 released only 0.038 wt% H2 in the same duration. From a comprehensive perspective of the dehydrogenation temperature and capacity, the MgH2 + 10 wt% Mn3O4 composite was chosen for further study. Fig. 2d illustrates the isothermal desorption profiles of the MgH2 + 10 wt% Mn3O4 composite at different temperatures (250, 275 and 300 °C). The composite could release 6.4 wt% hydrogen (nearly 94% of the theoretical hydrogen storage capacity) within 10 min at 275 °C and about 6.3 wt% hydrogen could be desorbed in 30 min even at 250 °C.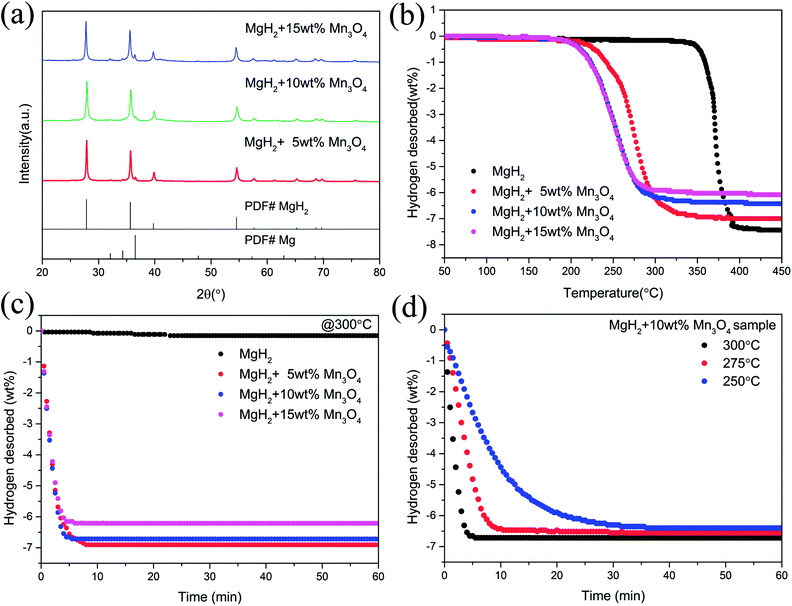 | ||
| Fig. 2 XRD patterns (a), volumetric release curves (b), and isothermal dehydrogenation curves (c and d) of MgH2, MgH2 + 5 wt% Mn3O4, MgH2 + 10 wt% Mn3O4, and MgH2 + 15 wt% Mn3O4 samples. | ||
Apart from the significantly improved desorption performance, we also focused on the absorption behaviour of the MgH2 + 10 wt% Mn3O4 composite. The isothermal and non-isothermal hydrogen absorption curves are shown in Fig. 3. Fig. 3a depicts the non-isothermal hydrogenation curves of the prepared MgH2 and MgH2 + 10 wt% Mn3O4 samples. The dehydrogenated MgH2 + 10 wt% Mn3O4 sample started absorbing hydrogen from room temperature, and about 5.4 wt% hydrogen could be taken up before 250 °C. However, the dehydrogenated MgH2 dilatorily absorbed hydrogen from 183 °C, which was approximately 160 °C higher than that for the dehydrogenated MgH2 + 10 wt% Mn3O4. Further isothermal absorption measurements of the as-prepared MgH2 and the MgH2 + 10 wt% Mn3O4 composite were conducted and the results are presented in Fig. 3b and c. At 50 °C, the dehydrogenated MgH2 + 10 wt% Mn3O4 sample exhibited a hydrogen absorption capacity of 2.5 wt% within 20 min. When heated to 75 °C, the hydrogen uptake of the Mn3O4 containing sample amounted to 4.1 wt% in 20 min. Within an identical time period, the hydrogen absorption capacity was increased to 5.1 wt% when the temperature was increased to 100 °C. Obviously, the MgH2 + 10 wt% Mn3O4 sample showed faster hydrogen absorption kinetics than pure MgH2 (Fig. 3b). Besides, the Ea values of the hydrogen absorption reaction were calculated to further explore the improved hydrogenation kinetics. Fig. 3d reveals the isothermal hydrogenation data of MgH2 and the MgH2 + 10 wt% Mn3O4 composite simulated using the Johnson–Mehl–Avrami–Kolmogorov (JMAK) equation,48,49 which can be written as:
ln[−ln(1 − α)] = n![[thin space (1/6-em)]](https://www.rsc.org/images/entities/char_2009.gif) ln ln![[thin space (1/6-em)]](https://www.rsc.org/images/entities/char_2009.gif) k + n k + n![[thin space (1/6-em)]](https://www.rsc.org/images/entities/char_2009.gif) ln ln![[thin space (1/6-em)]](https://www.rsc.org/images/entities/char_2009.gif) t t | (1) |
![[thin space (1/6-em)]](https://www.rsc.org/images/entities/char_2009.gif) ln
ln![[thin space (1/6-em)]](https://www.rsc.org/images/entities/char_2009.gif) k obtained by fitting the JMAK plots are shown in Fig. S1.† The Ea values for the hydrogenation reactions were calculated according to the Arrhenius equation:50
k obtained by fitting the JMAK plots are shown in Fig. S1.† The Ea values for the hydrogenation reactions were calculated according to the Arrhenius equation:50k = A![[thin space (1/6-em)]](https://www.rsc.org/images/entities/char_2009.gif) exp(−Ea/RT) exp(−Ea/RT) | (2) |
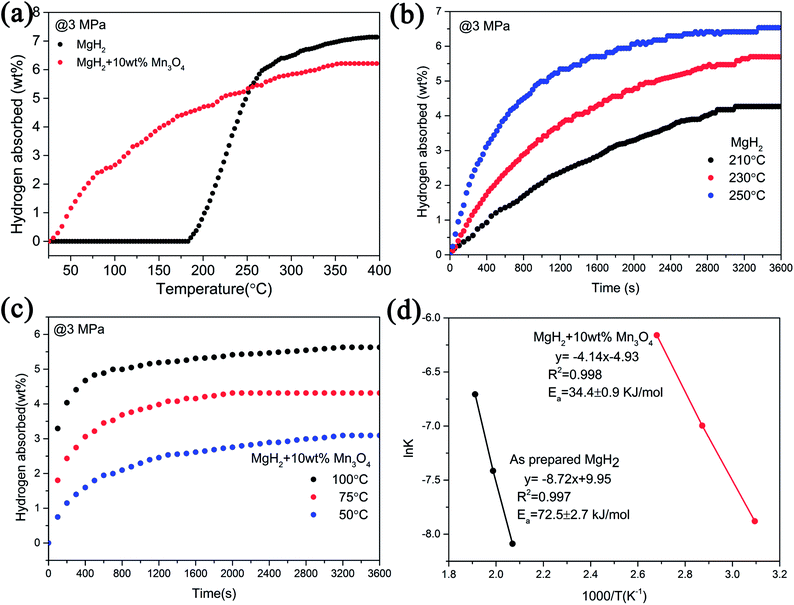 | ||
| Fig. 3 Non-isothermal hydrogenation curves (a), isothermal hydrogenation curves (b and c) and the corresponding Arrhenius plots (d) of MgH2 with and without 10 wt% Mn3O4. | ||
According to the plots in Fig. 3d, the calculated Ea value of the absorption process for the dehydrogenated MgH2 + 10 wt% Mn3O4 was 34.4 ± 0.9 kJ mol−1, which was much lower than that of the dehydrogenated MgH2 (72.5 ± 2.7 kJ mol−1) and other MgH2-based systems published recently.15,16 The Ea for hydrogenation was distinctly decreased by 52.6%, indicating that the energy barrier for the absorption of hydrogen is remarkably reduced due to the addition of Mn3O4, which is reasonably responsible for the enhanced hydrogenation kinetics of the MgH2 + 10 wt% Mn3O4 composite.
To achieve the practical application of hydrogen storage materials, preserving long-term kinetics is considered one of the key technology indicators. Although favourable hydrogen absorption and desorption properties of Mn3O4 doped MgH2 were evidenced, the cycling performance of the MgH2–Mn3O4 composite still needs to be explored. The cycle behaviour of the MgH2 + 10 wt% Mn3O4 composite was tested at 300 °C for 20 cycles. As revealed in Fig. 4, the hydrogen storage capacity of the MgH2 + 10 wt% Mn3O4 composite reached 6.6 wt% in the first dehydrogenation process. When exposed to a 30 bar hydrogen atmosphere, the dehydrogenated sample could quickly absorb 6.4 wt% H2 at 300 °C. After 20 cycles, a high reversible capacity of 6.1 wt% was still maintained, which corresponds to 95.3% of the original capacity. Generally, MgH2 particles tend to grow and aggregate during pyrolysis, leading to the degradation of cycling performance.51,52 In one of our previous studies,15 the cycling results showed that the capacity of Fe doped MgH2 was obviously decreased after 20 cycles. It is evident that the hydrogen storage capacity of the MgH2 + 10 wt% Mn3O4 composite remained stable without significant decline after 20 cycles, revealing remarkable enhancement due to the catalytic activity of Mn3O4 nanoparticles.
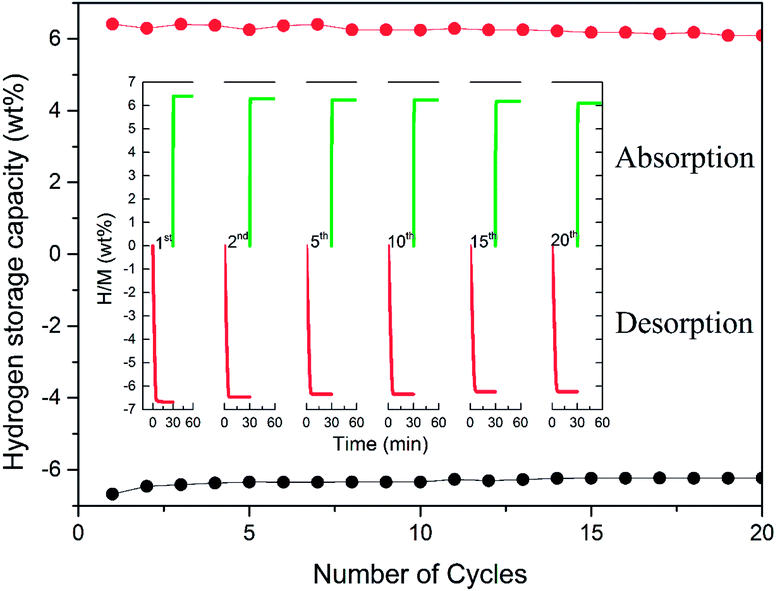 | ||
| Fig. 4 Non-isothermal dehydrogenation/hydrogenation curves and hydrogen storage capacity of the MgH2 + 10 wt% Mn3O4 composite. | ||
3.3 De/hydrogenation mechanism
As mentioned above, Mn3O4 showed a superior catalytic effect on improving the hydrogen absorption and desorption properties of MgH2. For a better understanding of the catalytic mechanism of the Mn3O4 modified MgH2 system, a deeper investigation was conducted. It can be seen in the TEM image (Fig. 5a) that the average size of the MgH2 + 10 wt% Mn3O4 composite after 20 cycles approached 300 nm, which is much smaller than that of ball-milled MgH2 (over 800 nm) as shown in Fig. S2.† Moreover, the HAADF-STEM image in Fig. 5b shows that numerous bright nanoparticles were homogeneously distributed on the surface of MgH2. Corresponding EDS mapping demonstrated that Mn and O covered almost the whole surface of the MgH2 + 10 wt% Mn3O4 composite after 20 cycles.53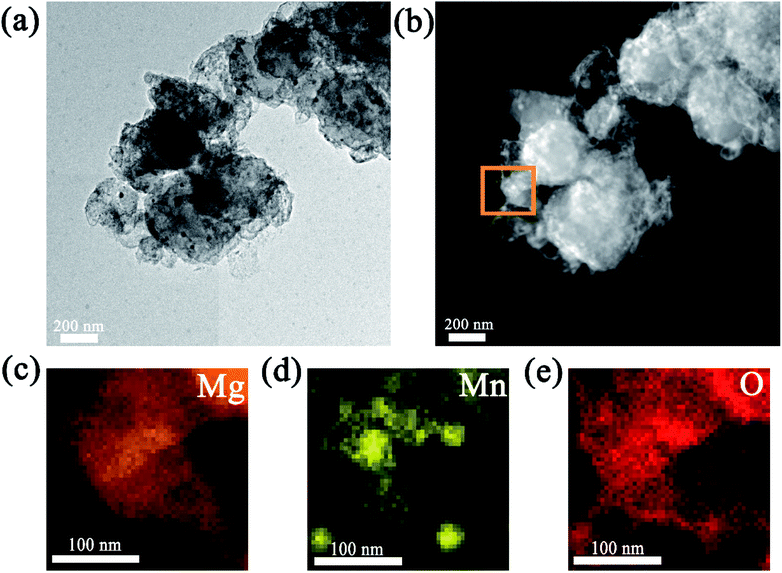 | ||
| Fig. 5 TEM image (a); STEM-HAADF image (b); corresponding EDS maps (c, d and e) of the MgH2 + 10 wt% Mn3O4 composite after 20 cycles. | ||
To elucidate the evolution of Mn3O4 nanoparticles in the de/hydrogenation process, the MgH2 + 10 wt% Mn3O4 sample in the ball-milled, dehydrogenated and re-hydrogenated states was collected and examined by XRD measurements (Fig. 6). Although the diffraction peaks of Mn3O4 were unclear in the XRD patterns, TEM measurements (Fig. S3†) demonstrated that small particles of Mn3O4 can be observed to be evenly distributed on the surface of MgH2. Compared with that of pure MgH2, the particle size of MgH2 + 10 wt% Mn3O4 in Fig. S3† was much smaller. Clearly, MgH2 or Mg still dominated the XRD patterns in Fig. 6 after the doping of Mn3O4. However, it is interesting that Mn and Mg0.9Mn0.1O phases occurred in both the dehydrogenated and rehydrogenated samples, as shown in Fig. 6b and c. In addition, the TEM image (Fig. S4†) reveals that Mn particles were uniformly dispersed on the surface of MgH2. It should be pointed out that Mn3O4 in contact with Mg can readily form Mn and Mg0.9Mn0.1O under conditions of high temperature.40 The XRD and TEM results indicate that the added Mn3O4 nanoparticles were reduced to metallic Mn during the de/hydrogenation process. Therefore, we believe that metallic Mn is the key active catalytic species which enhance the hydrogen release/uptake for MgH2/Mg.
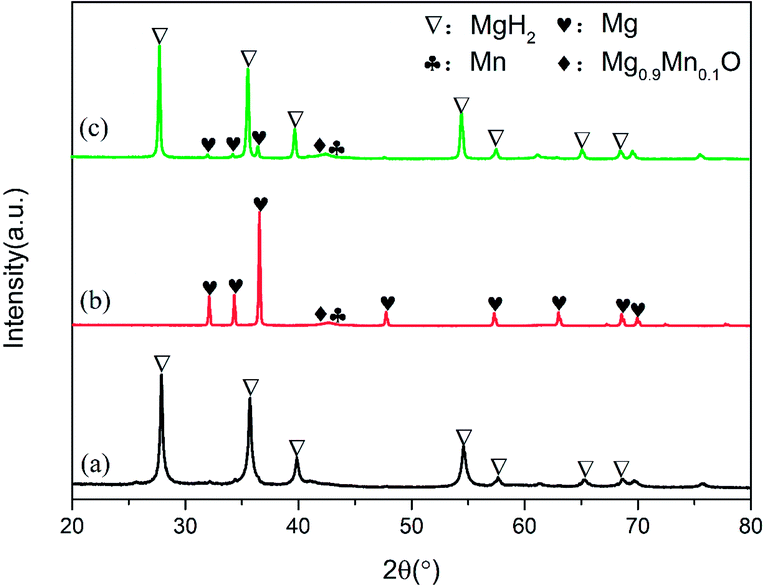 | ||
| Fig. 6 XRD patterns of ball-milled (a), dehydrogenated (b) and hydrogenated (c) MgH2 + 10 wt% Mn3O4 samples. | ||
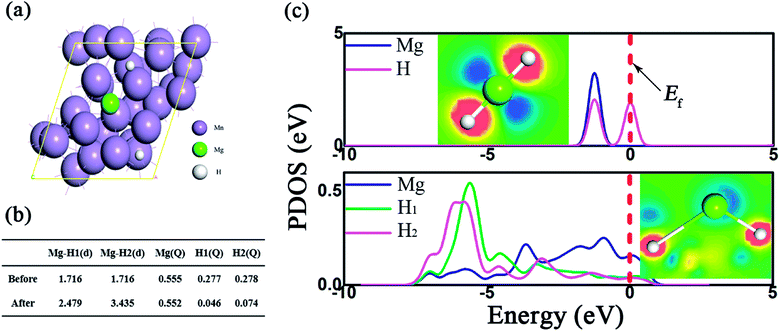
The impact of Mn metal on the catalytic performance was further investigated by DFT calculations, where the Mn (330) surface was modeled, as shown in the TEM picture. The bond length and the Mulliken population (MP) are described in Fig. 7b. As presented, due to the presence of the Mn support, the Mg–H bonds were dramatically elongated and the average bond length is 2.48 Å, much longer than the pristine one (1.72 Å). Besides, the partial density of states (PDOS) in Fig. 7c shows that the ss-orbital overlap of the Mg–H bond was obviously weakened and the s electrons of Mg and H were mainly distributed at −5 ∼ 0 eV and −5 ∼ −6 eV, respectively. This reduced orbital interaction corresponds to the faint bond strength, which benefits the de/hydrogenation kinetics.54 Therefore, the presence of Mn plays an important role in improving the hydrogen storage properties of the MgH2 molecule.
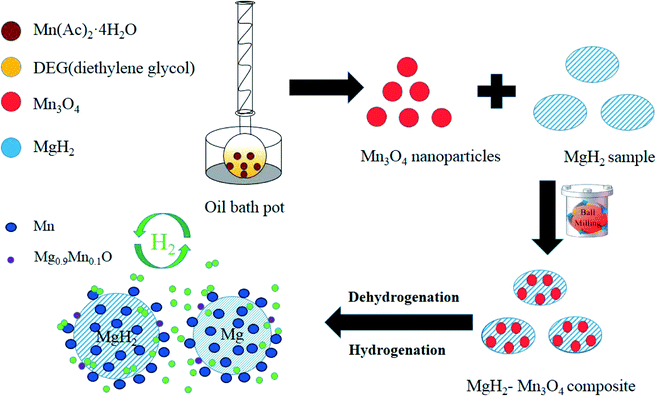
Based on the XRD, TEM and calculation results, the whole synthesis and de/hydrogenation process is illustrated in Fig. 8. Mn3O4 nanoparticles prepared by a facile chemical method were evenly decorated on the surface of MgH2 during ball milling. In the de/hydrogenation process, Mn3O4 was reduced to metallic Mn. The Mn “coating”, on one hand, will promote the fracture of the Mg–H bond in MgH2 and reduce the de/hydrogenation temperature. On the other hand, it will help to separate the MgH2 particles and prevent them from growing and aggregating, thus preserving the stable cycling properties. As a result, the Ea value of the hydrogen absorption reaction was greatly decreased and the hydrogen storage properties of the Mn3O4-doped MgH2 were significantly enhanced.
4. Conclusion
In summary, Mn3O4 nanoparticles around 10 nm were successfully synthesized by a simple chemical method and a series of experiments proved that Mn3O4 can remarkably improve the hydrogen storage properties of MgH2. During the process of the non-isothermal mode, the MgH2 + 10 wt% Mn3O4 composite released approximately 6.4 wt% hydrogen from 200 °C to 300 °C. Moreover, the MgH2 + 10 wt% Mn3O4 composite desorbed 6.7 wt% hydrogen within 8 min under the isothermal conditions of 300 °C. The dehydrogenated MgH2 + 10 wt% Mn3O4 sample could absorb hydrogen under 3 MPa H2 pressure even at room temperature, and about 5.4 wt% hydrogen could be charged before 250 °C. The Ea of rehydrogenation of the MgH2-10 wt% Mn3O4 composite was calculated to be 34.4 ± 0.9 kJ mol−1. In addition, this sample exhibited favourable cycling stability with no significant fading over 20 cycles. Further XRD, TEM and theoretical calculations revealed that the in situ formed Mn weakened the Mg–H bond, and thus greatly promoted the de/hydrogenation reaction and preserved the cycling performance. This study combined experimental results with DFT calculations to investigate the catalytic effect of Mn3O4 on improving the hydrogen storage properties of MgH2, which will be a good reference for developing a new composite hydrogen storage system.Conflicts of interest
There are no conflicts to declare.Acknowledgements
The authors would like to acknowledge the financial support from the National Natural Science Foundation of China (Grant No. 51801078 and 51702300) and the National Science Foundation of Jiangsu Province (Grant No. BK20180986).References
- T. Sadhasivam, H. Kim, S. Jung, S. Roh, J. Park and H. Jung, Renewable Sustainable Energy Rev., 2017, 72, 523–534 CrossRef CAS.
- Z. Cao, L. Ouyang, H. Wang, J. Liu, L. Sun, M. Felderhoff and M. Zhu, Int. J. Hydrogen Energy, 2016, 41, 11242–11253 CrossRef CAS.
- Y. Li, X. Zhong, K. Luo and Z. Shao, J. Mater. Chem. A, 2019, 7, 15593–15598 RSC.
- J. Zheng, H. Cheng, X. Wang, M. Chen, X. Xiao and L. Chen, ACS Appl. Energy Mater., 2020 DOI:10.1021/acsaem.0c00134.
- T. Bian, B. Xiao, B. Sun, L. Huang, S. Su, Y. Jiang, J. Xiao, A. Yuan, H. Zhang and D. Yang, Appl. Catal., B, 2020, 263, 118255 CrossRef CAS.
- J. Kim, A. Jun, O. Gwon, S. Yoo, M. Liu, J. Shin, T. H. Lim and G. Kim, Nano Energy, 2018, 44, 121–126 CrossRef CAS.
- N. A. A. Rusman and D. Mahari, Int. J. Hydrogen Energy, 2016, 41, 12108–12126 CrossRef CAS.
- B. Bogdanović, A. Ritter and B. Spliethoff, Angew. Chem., Int. Ed. Engl., 1990, 29, 223–234 CrossRef.
- I. P. Jain, C. Lal and A. Jain, Int. J. Hydrogen Energy, 2010, 35, 5133–5144 CrossRef CAS.
- X. Peng, H. Wang, R. Hu, L. Ouyang, J. Liu and M. Zhu, J. Alloys Compd., 2017, 711, 473–479 CrossRef CAS.
- C. Zhou, R. C. Bowman Jr, Z. Z. Fang, J. Lu, L. Xu, P. Sun, H. Liu, H. Wu and Y. Liu, ACS Appl. Mater. Interfaces, 2019, 11, 38868–38879 CrossRef CAS PubMed.
- R. Bardhan, A. M. Ruminski, A. Brand and J. J. Urban, Energy Environ. Sci., 2011, 4, 4882 RSC.
- L. Ouyang, X. Yang, M. Zhu, J. Liu, H. Dong, D. Sun, J. Zou and X. Yao, J. Phys. Chem. C, 2014, 118, 7808–7820 CrossRef CAS.
- P. Rizo-Acosta, F. Cuevas and M. Latroche, J. Mater. Chem. A, 2019, 7, 23064–23075 RSC.
- L. Zhang, L. Ji, Z. Yao, N. Yan, Z. Sun, X. Yang, X. Zhu, S. Hu and L. Chen, Int. J. Hydrogen Energy, 2019, 44, 21955–21964 CrossRef CAS.
- L. Zhang, Z. Cai, X. Zhu, Z. Yao, Z. Sun, L. Ji, N. Yan, B. Xiao and L. Chen, J. Alloys Compd., 2019, 805, 295–302 CrossRef CAS.
- W. Su, Y. Zhu, J. Zhang, Y. Liu, Y. Yang, Q. Mao and L. Li, J. Alloys Compd., 2016, 669, 8–18 CrossRef CAS.
- G. Xia, Y. Tan, X. Chen, D. Sun, Z. Guo, H. Liu, L. Ouyang, M. Zhu and X. Yu, Adv. Mater., 2015, 27, 5981–5988 CrossRef CAS PubMed.
- S. Gao, X. Wang, H. Liu, T. He, Y. Wang, S. Li and M. Yan, J. Power Sources, 2019, 438, 227006 CrossRef CAS.
- S. Gao, H. Liu, L. Xu, S. Li, X. Wang and M. Yan, J. Alloys Compd., 2018, 735, 635–642 CrossRef CAS.
- L. Ji, L. Zhang, X. Yang, X. Zhu and L. X. Chen, Dalton Trans., 2020 10.1039/d0dt00230e.
- M. Bououdina and Z. X. Guo, J. Alloys Compd., 2002, 336, 222–231 CrossRef CAS.
- B. Liao, Y. Lei, L. Chen, G. Lu, H. Pan and Q. Wang, J. Power Sources, 2004, 129, 358–367 CrossRef CAS.
- N. A. Ali, N. H. Idris, M. F. M. Din, M. S. Yahya and M. Ismail, J. Alloys Compd., 2019, 796, 279–286 CrossRef CAS.
- T. K. Nielsen, K. Manickam, M. Hirscher, F. Besenbacher and T. R. Jensen, ACS Nano, 2009, 3, 3521–3528 CrossRef CAS PubMed.
- G. Chen, Y. Zhang, J. Chen, X. Guo, Y. Zhu and L. Li, Nanotechnology, 2018, 29, 265705 CrossRef PubMed.
- Z. Ma, J. Zhang, Y. Zhu, H. Lin, Y. Liu, Y. Zhang, D. Zhu and L. Li, ACS Appl. Energy Mater., 2018, 1, 1158–1165 CrossRef CAS.
- Y. Jia, L. Cheng, N. Pan, J. Zou, G. Max Lu and X. Yao, Adv. Energy Mater., 2011, 1, 387–393 CrossRef CAS.
- M. P. Pitt, M. Paskevicius, C. J. Webb, D. A. Sheppard, C. E. Buckley and E. M. Gray, Int. J. Hydrogen Energy, 2012, 37, 4227–4237 CrossRef CAS.
- J. Cui, J. Liu, H. Wang, L. Ouyang, D. Sun, M. Zhu and X. Yao, J. Mater. Chem. A, 2014, 2, 9645–9655 RSC.
- Z. Wang, X. Zhang, Z. Ren, Y. Liu, J. Hu, H. Li, M. Gao, H. Pan and Y. Liu, J. Mater. Chem. A, 2019, 7, 14244–14252 RSC.
- M. Liu, X. Xiao, S. Zhao, S. Saremi-Yarahmadi, M. Chen, J. Zheng, S. Li and L. Chen, Int. J. Hydrogen Energy, 2019, 44, 1059–1069 CrossRef CAS.
- H. Cheng, G. Chen, Y. Zhang, Y. Zhu and L. Li, Int. J. Hydrogen Energy, 2019, 44, 10777–10787 CrossRef CAS.
- M. Mehta, N. Kodan, S. Kumar, A. Kaushal, L. Mayrhofer, M. Walter, M. Moseler, A. Dey, S. Krishnamurthy, S. Basu and A. P. Singh, J. Mater. Chem. A, 2016, 4, 2670–2681 RSC.
- S. Kumar, Y. Kojima and G. K. Dey, Int. J. Hydrogen Energy, 2018, 43, 809–816 CrossRef CAS.
- H. Chen, P. Liu, J. Li, Y. Wang, C. She, J. Liu, L. Zhang, Q. Yang, S. Zhou and X. Feng, ACS Appl. Mater. Interfaces, 2019, 11, 31009–31017 CrossRef CAS PubMed.
- Z. Ma, J. Liu, Y. Zhu, Y. Zhao, H. Lin, Y. Zhang, H. Li, J. Zhang, Y. Liu, W. Gao, S. Li and L. Li, J. Alloys Compd., 2020, 822, 153553 CrossRef.
- H. Lin, J. Tang, Q. Yu, H. Wang, L. Ouyang, Y. Zhao, J. Liu, W. Wang and M. Zhu, Nano Energy, 2014, 8, 80–87 CrossRef.
- M. Chen, X. Xiao, M. Zhang, J. Zheng, M. Liu, X. Wang, L. Jiang and L. Chen, Int. J. Hydrogen Energy, 2019, 44, 15100–15109 CrossRef CAS.
- A. Bhatnagar, S. K. Pandey, A. K. Vishwakarma, S. Singh, V. Shukla, P. K. Soni, M. A. Shaz and O. N. Srivastava, J. Mater. Chem. A, 2016, 4, 14761–14772 RSC.
- N. S. Mustafa and M. Ismail, J. Alloys Compd., 2017, 695, 2532–2538 CrossRef CAS.
- L. Zhang, Z. Cai, Z. Yao, L. Ji, Z. Sun, N. Yan, B. Zhang, B. Xiao, J. Du, X. Zhu and L. Chen, J. Mater. Chem. A, 2019, 7, 5626–5634 RSC.
- G. Kresse and J. Furthmuller, Comput. Mater. Sci., 1996, 6, 15–50 CrossRef CAS.
- B. Xiao, H. Liu, L. Yang, E. Song, X. Jiang and Q. Jiang, ACS Appl. Energy Mater., 2020, 3, 260–267 CrossRef CAS.
- K. B. J. P. Perdew and M. Ernzerhof, Phys. Rev. Lett., 1996, 77, 3865–3868 CrossRef PubMed.
- B. Xiao, H. Liu, X. Jiang, Z. Yu and Q. Jiang, RSC Adv., 2017, 7, 54332–54340 RSC.
- W. Tang, E. Sanville and G. Henkelman, J. Phys.: Condens. Matter, 2009, 21, 084204 CrossRef CAS PubMed.
- M. Avrami, J. Chem. Phys., 1939, 7, 1103–1112 CrossRef CAS.
- M. Liu, S. Zhao, X. Xiao, M. Chen, C. Sun, Z. Yao, Z. Hu and L. Chen, Nano Energy, 2019, 61, 540–549 CrossRef CAS.
- F. Jensen, Qual. Reliab. Eng. Int., 1985, 1, 13–17 CrossRef.
- B. Paik, I. P. Jones, A. Walton, V. Mann, D. Book and I. R. Harris, J. Alloys Compd., 2010, 492, 515–520 CrossRef CAS.
- J. Chen, G. Xia, Z. Guo, Z. Huang, H. Liu and X. Yu, J. Mater. Chem. A, 2015, 3, 15843–15848 RSC.
- L. Zhang, Z. Sun, Z. Cai, N. Yan, X. Lu, X. Zhu and L. Chen, Appl. Surf. Sci., 2020, 504, 144465 CrossRef.
- X. Zhang, Z. Leng, M. Gao, J. Hu, F. Du, J. Yao, H. Pan and Y. Liu, J. Power Sources, 2018, 398, 183–192 CrossRef CAS.
Footnotes |
| † Electronic supplementary information (ESI) available. See DOI: 10.1039/d0na00137f |
| ‡ Liuting Zhang, Ze Sun and Zhendong Yao contributed equally. |
| This journal is © The Royal Society of Chemistry 2020 |

