
 Open Access Article
 This Open Access Article is licensed under a Creative Commons Attribution-Non Commercial 3.0 Unported Licence
Novel microwave synthesis of near-metallic copper sulfide nanodiscs with size control: experimental and DFT studies of charge carrier density†
Alex T.
Sheardy
,
Durga M.
Arvapalli
and
Jianjun
Wei
 *
*
Department of Nanoscience, Joint School of Nanoscience and Nanoengineering, University of North Carolina at Greensboro, 2907 E. Gate City Blvd, Greensboro, NC 27401, USA. E-mail: j_wei@uncg.edu; Tel: +1-336-285-2859
First published on 12th February 2020
Abstract
A simple unprecedented microwave synthesis of size controllable copper sufide (CuS) nanodiscs is reported. The experimental results and density functional theory (DFT)-calculated results show charge carrier densities on the order of 1021 cm−3 with an effective mass of 0.3me, resulting in near-metallic properties.
Copper sulfide (CuxS, 1 ≤ x ≤ 2) nanoparticles have recently been the focus of a variety of optical-based studies, including: bioimaging/detection,1,2 photothermal therapy,3,4 photovoltaics,11 and photocatalysis.12,13 The majority of these studies are based on the plasmonic near-infrared absorption band, which has been explicitly studied both experimentally9,14,15 and theoretically.16–18 The plasmon absorption arises from intrinsic p-doping that is dependent on the stoichiometric ratio of Cu
![[thin space (1/6-em)]](https://www.rsc.org/images/entities/char_2009.gif) :S; an increased sulfur content results in increased p-doping and therefore a stronger and higher energy plasmon absorption.5,6,9,19–24 This results in more controllability of the plasmons in comparison to traditional noble metal nanoparticles, as the charge carrier density can be modified in semiconductor plasmons in addition to their size and morphology.25 Stoichiometric CuS (x = 1, covellite) is the most heavily doped of the copper sulfides, thus exhibiting the strongest plasmon absorption and is of most interest for these potential applications.14,15
:S; an increased sulfur content results in increased p-doping and therefore a stronger and higher energy plasmon absorption.5,6,9,19–24 This results in more controllability of the plasmons in comparison to traditional noble metal nanoparticles, as the charge carrier density can be modified in semiconductor plasmons in addition to their size and morphology.25 Stoichiometric CuS (x = 1, covellite) is the most heavily doped of the copper sulfides, thus exhibiting the strongest plasmon absorption and is of most interest for these potential applications.14,15
Despite the myriad potential applications of CuS NPs, most of the synthesis methods used are not ideal for wide-spread use. A summary of some of the various synthetic methods used to synthesize CuxS NPs of varying stoichiometry is gathered in Table S1.† Many of these reactions require temperatures on the order of 150–200 °C and/or multistep preparation of precursors. Some hydrothermal syntheses at a lower temperature (90 °C) have been performed, but the concentration used in these reactions was 1 mM, making these prohibitive for commercial applications. Copper sulfide NPs have been synthesized using microwave synthesis, however micron-sized particles with nanoscale features have been generally reported. Kim et al. synthesized 13 nm CuS nanodiscs, but the procedure required multiple steps and the reaction was not explored in depth.20
Microwave synthesis is an emerging technique used in both organic26 and inorganic27 syntheses and could potentially overcome conventional heating in many processes and allow for more efficient synthesis. Microwave-assisted synthetic methods show many advantages over traditional heating, including reduced reaction times, faster/more uniform heating, increased reproducibility, and simpler reaction setups. In a simple sense, microwave heating functions by causing molecular rotations which result in molecular friction and therefore heat. Furthermore, since microwaves can penetrate through solvents, heating can occur in the entire reaction simultaneously vs. conventional heating which is dependent on external heating and stirring to achieve thermal equilibrium. Finally, traditional heating methods require high temperatures and techniques like hot injection to achieve reproducible nanoparticle sizes, but the rapid heating of microwave reactions eliminates the need for complicated synthetic techniques.26,27 For these reasons, we aim to provide a more comprehensive study on the microwave synthesis of plasmonic CuS nanoparticles.
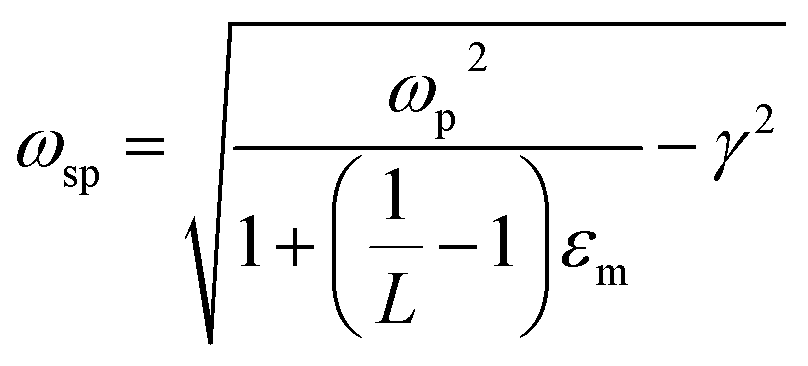
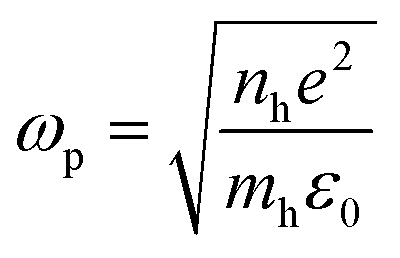
Furthermore, while many of the proposed applications for CuS NPs are based on the electronic properties of the NPs, these properties remain poorly understood. As mentioned above, copper sulfides are intrinsically p-doped, meaning the charge carriers are mainly holes. The density of charge carriers is of particular interest, as it affects both the energy of plasmons and their conductivity. Calculation of charge carrier density is often performed using the Drude model (eqn (1) and (2), see Discussion), which has dependence on both the shape of nanoparticles and the effective mass of charge carriers.7,9,15,20,23,24 Often in the literature, the shape factor is assumed to be that of a spherical particle (L = 1/3), regardless of the actual shape of the particle. The effective mass of holes in Cu2S has been reported in the literature as 0.8me,18 however the effective mass of holes in stoichiometric CuS has not been theoretically studied and rather is assumed to be the same as Cu2S. This assumption is unlikely valid based on the results of the computational study by Lukashev et al., which shows that Cu2S is a traditional semiconductor, while the introduction of additional sulfur atoms introduces more metallic character.18 A review by Kriegel et al. on plasmonic semiconductors reported an experimentally calculated CuS effective mass of 0.55me, however these experiments were based on an experimental study of Ba1−xKxCuSF, making it erroneous to attribute this value to pure CuS.6,19,28 As such, the authors are unaware of any experimental or theoretical studies that have determined the effective mass of carriers in pure stoichiometric CuS. For these reasons, we have combined the experimental results with the density functional theory (DFT)-calculated results to better determine both experimental and theoretical charge carrier density values of CuS nanoparticles, along with an appropriate effective mass of their charge carriers.
The synthesis procedure is provided in the ESI.† TEM images of the synthesized CuS NPs are given in Fig. 1 both parallel (A–C) and perpendicular (D–F) to the support film. As can be seen from the images, there is an obvious increase in the diameter of the particles with increasing reaction time, and multiple morphologies including circles, triangles and hexagons are present. The insets in Fig. 1 show the electron diffraction pattern, indicating the crystalline nature of the particles. Specifically, the bright ring in all samples corresponds to the (2![[1 with combining macron]](https://www.rsc.org/images/entities/char_0031_0304.gif) 0) plane, with a lattice spacing of 1.88 Å. From Fig. 1D–F, it can be seen that the particles are disc shaped, which is consistent with the expected hexagonal crystal structure. Size distributions for both the diameter and height of the particles are given in Fig. S1,† and there is a clear increase in both dimensions with increasing reaction time. The size data are also summarized in Table 1.
0) plane, with a lattice spacing of 1.88 Å. From Fig. 1D–F, it can be seen that the particles are disc shaped, which is consistent with the expected hexagonal crystal structure. Size distributions for both the diameter and height of the particles are given in Fig. S1,† and there is a clear increase in both dimensions with increasing reaction time. The size data are also summarized in Table 1.
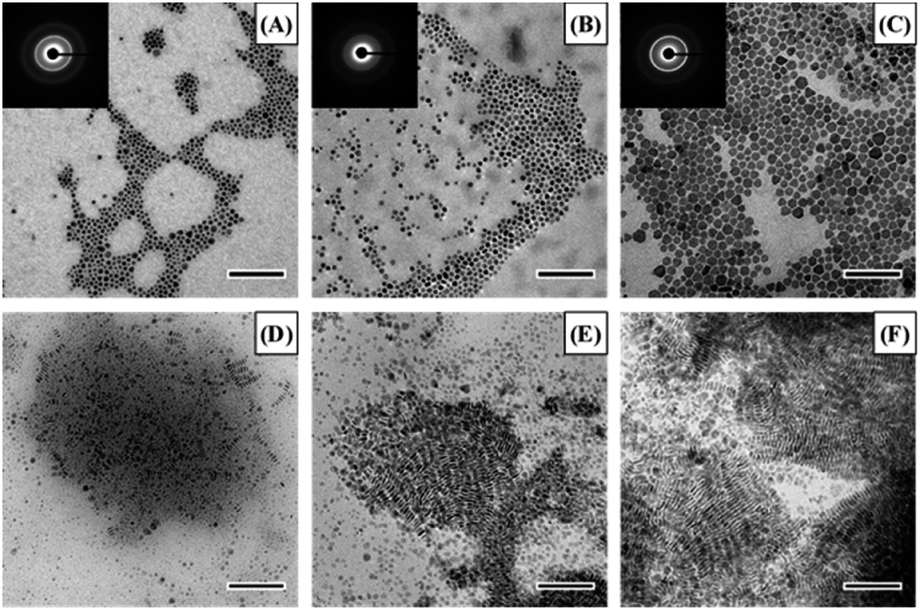 | ||
| Fig. 1 Representative TEM micrographs of CuS NPs synthesized for 5 (A and D), 10 (B and E), or 15 (C and F) minutes either parallel (A–C) or perpendicular (D–F) to the carbon support film. The insets in the micrographs show the electron diffraction pattern, and the scale bar for all images is 100 nm. | ||
| Time (min) | Diameter (nm) | Height (nm) | L x | λ (nm) | γ (eV) | ħω sp (eV) | ħω p (eV) | n h (1022 cm−3) |
|---|---|---|---|---|---|---|---|---|
| 5 | 6.5 ± 1.9 | 3.3 ± 0.5 | 0.239 | 1176 ± 2.6 | 0.461 | 1.05 | 4.65 | 1.25 |
| 10 | 8.5 ± 2.3 | 4.2 ± 0.7 | 0.235 | 1197 ± 7.6 | 0.454 | 1.04 | 4.62 | 1.24 |
| 15 | 11.6 ± 3.2 | 4.5 ± 0.7 | 0.202 | 1215 ± 27.5 | 0.411 | 1.02 | 4.92 | 1.41 |
FTIR spectroscopy was used to confirm the presence of the oleylamine capping agent (Fig. S2A†), and the agreement between pure oleylamine and the CuS NPs can be clearly seen. TGA between 100 and 800 °C shows a similar structure for all reaction times, with two main mass losses at ∼250 and ∼450 °C (Fig. S2B†). The first of these losses corresponds to ∼30% of the mass and is due to the loss of sulfur and formation of higher copper stoichiometries.29 The second loss is approximately 40% of the initial mass and is attributed to the loss of the oleylamine capping agent. XPS was performed to verify the expected 1:1 stoichiometry of CuS (Fig. S2C†). From these experiments, the major elements present are copper, sulfur, carbon, nitrogen, and oxygen. The carbon and nitrogen are expected from the oleylamine capping agent, while the oxygen may be due to surface contamination. Table S2† lists the Cu and S contents for each sample, and the materials do present an approximate 1:1 relationship. The relatively low elemental content of each of these elements (2–8% each) and deviations from 1:1 stoichiometry are due to a high carbon content (∼75–80%) from the capping agent and the relatively shallow probe depth of the technique. High resolution scans of the Cu L-edge give a single peak for the p3/2 signal at ∼933.3 eV and a single peak for the p1/2 signal at ∼953.1 eV (Fig. S3D†). For the S L-edge, a single peak at ∼163.5 eV is observed (Fig. S3E†).
X-Ray diffraction was performed to verify that the crystal structure of the synthesized nanodiscs matches the expected structure of stoichiometric CuS (Fig. S3†). As can be seen, the experimental data for all synthesized samples show good agreement with the predicted diffraction pattern shown in black. Taken together the FTIR, TGA, XRD and XPS data confirm the synthesis of stoichiometric CuS capped with oleylamine, with no major differences between different reaction times, except the size/aspect ratio.
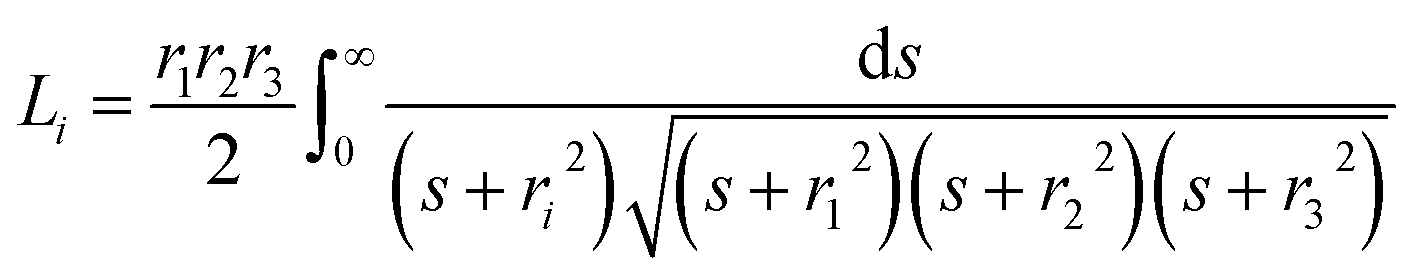
The UV-Vis-NIR spectra were measured (Fig. 2), and it can be seen that there is a red shift of the NIR plasmon peak with increasing reaction time. Based on this plasmon peak, it is possible to calculate the density of charge carriers (holes), nh, according to the Drude model and eqn (1) and (2).7,9,15,20,23,24 In these equations, ωsp is the surface plasmon frequency, ωp is the bulk plasmon frequency, εm is the dielectric constant of the media (CHCl3, 4.81), γ is the plasmon linewidth, is the shape factor, e is the charge of an electron, mh is the effective mass of the holes, and ε0 is the free space permittivity. In the calculations that follow, ωsp and γ are taken from the position and FWHM of the plasmon resonance, respectively. The shape factor for an oblate ellipsoid can be found using eqn (3), and for disc-like particles it is assumed that Lx = Ly < Lz (r1 = r2 < r3).30 Finally, an effective hole mass of 0.8me was used, based on previous literature.9,24 These calculations result in hole densities of 1.25, 1.24, and 1.41 × 1022 cm−3 for 5, 10 and 15 minute reactions, respectively. For comparison, gold and copper have electron densities of 5.9 and 8.4 × 1022 cm−3, respectively, so the charge carrier densities of synthesized CuS NPs approach the near-metallic levels of charge carriers. All of the data used in these calculations are summarized in Table 1.
 | (1) |
 | (2) |
 | (3) |
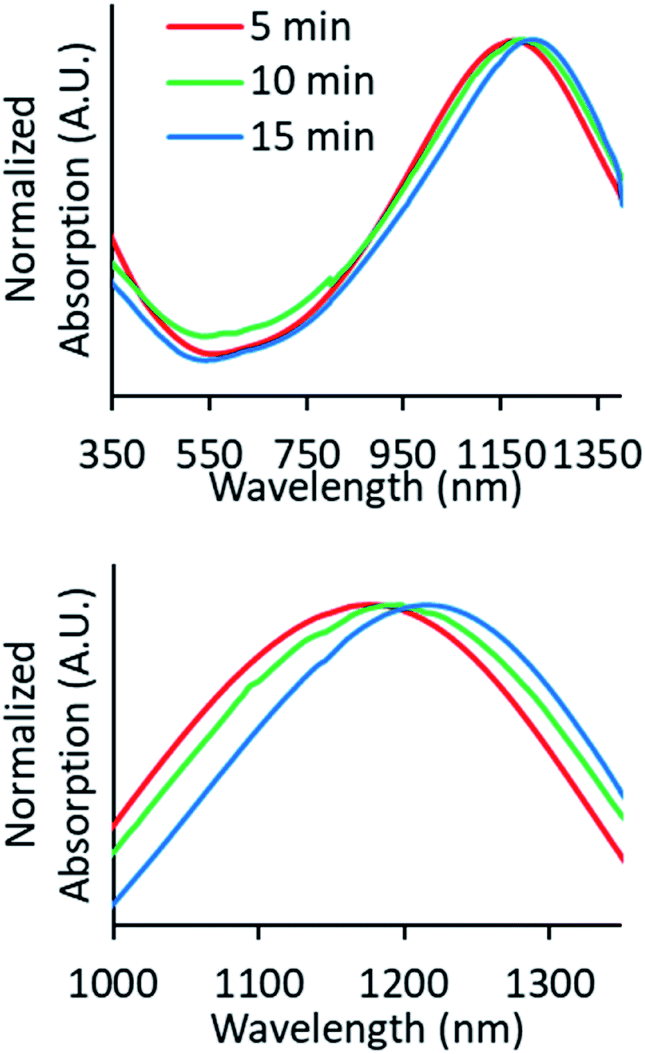 | ||
| Fig. 2 UV-Vis-NIR absorption spectra of CuS synthesized with reaction times of 5 (red), 10 (green), and 15 minutes (blue). The spectra have been normalized for comparison, and both the entire spectra (top) and plasmon absorption (bottom) are shown. The peak absorptions occur at 1176, 1197, and 1215 nm, respectively. | ||
Density functional theory (DFT) calculations of the total energy, density of states, and band structure were carried out using Quantum Espresso,31 following the methodology of Morales-Garcia et al.16 Specifically, the calculations were performed using the generalized gradient approximation (GGA) with a projector-augment wave (PAW) all-electron description32,33 and the Perdew, Burke, and Ernzerhof (PBE) exchange-correlation functional.34 Calculations were performed using a Monkhorst–Pack35 grid of k-points (10 × 10 × 2), with a plane-wave cutoff of 560 eV. For convergence, a consecutive total energy difference of less than 10−4 eV was required. Since DFT is known to underestimate the bandgap, the Dudarev simplified rotationally invariant form of DFT+U was used.36 Values of U (6 eV) and J (1 eV) were chosen based on the results of Morales-Garcia et al., giving an effective U of 5 eV.16
A number of different copper sulfide stoichiometries have been studied in terms of the carrier effective mass, charge carrier density, and band gap; these data are collected in Table 2. Cu2S has been shown to be purely semiconducting, and therefore has insufficient charge carriers to support a plasmon.9,18 Increasing the sulfur content results in increased charge carrier densities, with the charger carrier density of CuS being approximately one order of magnitude higher than those of the less heavily doped stoichiometries. Specifically, previous literature has reported CuS hole densities in the range of 0.5–1.6 × 1022 cm−3, which are of similar order to those reported in this work.5,6,20–24 It should be noted that most of these calculations are dependent on the effective mass of the charge carriers (holes), but these values have only been computationally reported for Cu2S, and other studies assume that the mass does not change significantly. The near-metallic nature of CuS23 suggests that the effective mass of the carrier should be different from that of purely semiconducting Cu2S. For this, values of 0.55, 0.8, and 1me have been used, but the former of these comes from an experiment using Ba1−xKxCuSF,19 while the latter values are assumptions.
| Stoichiometry | Carrier effective mass (me) | Charge carrier density (cm−3) | Band gap (eV) |
|---|---|---|---|
| Cu2S5,14 | 0.8 | — | 0.6, 2.4 |
| Cu1.94S–Cu1.98S5–10 | 0.8 | 0.7–1.3 × 10²¹ | 1.53 |
| Cu1.94S–Cu1.8S (theoretical)18 | — | 0.8–2.4 × 10²¹ | 0.55 |
| Cu1.8S5,6,10 | 0.8 | 3.0–4.6 × 10²¹ | 1.46, 2.55 |
| Cu1.4S5,21 | 0.8 | 5.88 × 10²¹ | 2.5 |
| CuS2,5,6,10,20–24 | 0.55–1 | 0.5–1.6 × 10²² | 1.48, 2.58 |
| CuS (this work) | 0.3 | 9.8 × 10²¹ (theoretical), 4.7–5.27 × 10²¹ (experimental) | N/A |
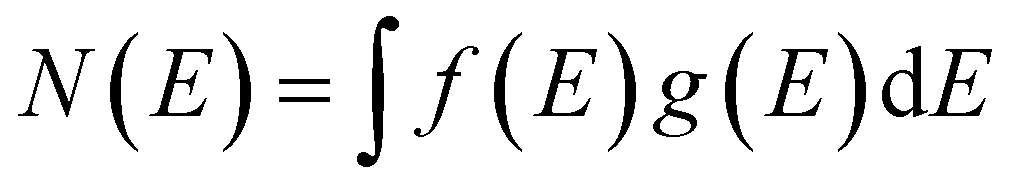
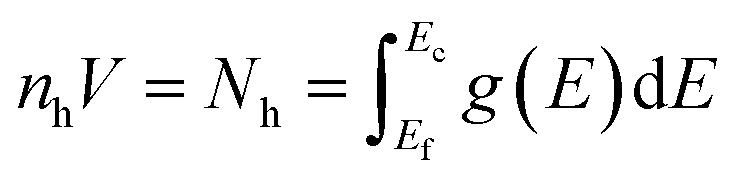
In order to verify the experimental charge carrier density, a density functional theory (DFT) calculation of the band structure and density of states (DOS) was performed (Fig. 3), following the methodology of Morales-Garcia et al.16 Using DFT+U, the band structure and DOS of bulk CuS were calculated (Fig. 3) and show good agreement with Morales-Garcia's calculations. From simple solid state physics, the number of charge carriers (N) is given by eqn (4), where f(E) is the Fermi–Dirac distribution and g(E) is the density of states.37 At 0 K, the Fermi–Dirac distribution for holes would simplify to either 0 (E < Ef) or 1 (E > Ef). While this assumption is only completely accurate at 0 K, at higher temperatures the distribution of charge carriers will change, but the total density should remain relatively unchanged. Furthermore, seeing as the Fermi energy is within the conduction band, only the holes within that same band are likely to contribute to charge carrying in the plasmon, as holes in higher bands would have too high energy. Taking these assumptions together, eqn (4) can be simplified to eqn (5), where Ec is the top of the conduction band and V is the unit cell volume. Performing this calculation results in ∼2 holes per unit cell, or nh = 9.81 × 1021 cm−3. This computationally derived result shows good agreement with both previous literature and the present results. Specifically, the value of two holes per unit cell is consistent with the prediction of Conejeros et al., based on the expected number of electrons and the number of states available.38 Work of Mazin also shows similar results of 1/3 of a hole per Cu, combined with 6 copper atoms per unit cell giving a total of two holes per unit cell.39
 | (4) |
 | (5) |
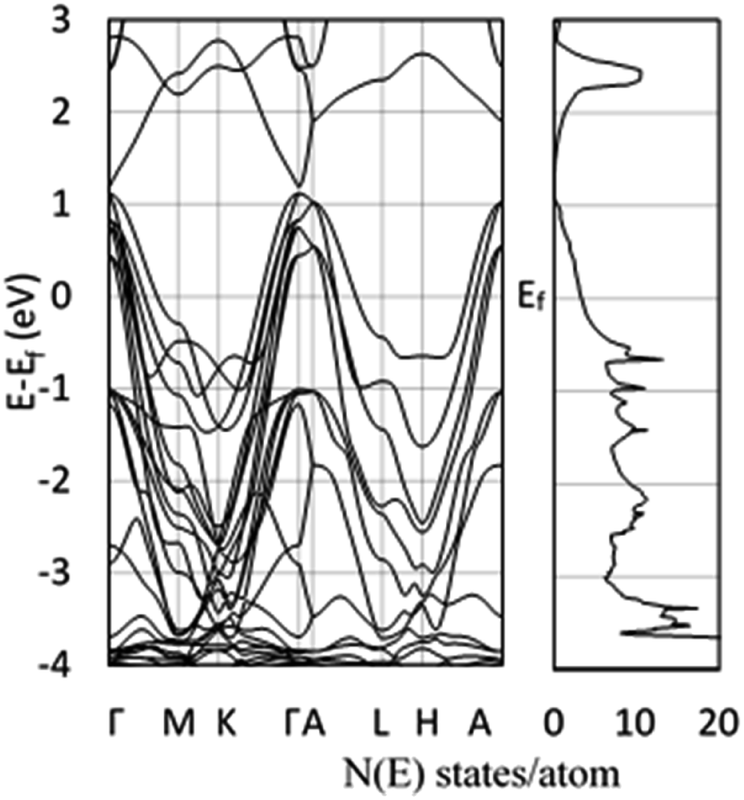 | ||
| Fig. 3 DFT-calculated band structure (left) and density of states (right) using DFT+U (Ueff = 5). Energies are relative to the Fermi energy, and both figures share the same y-axis values. | ||
The DFT-calculated charge density is of similar order, but slightly lower than the experimentally calculated value. One likely source for this discrepancy is an over-estimation of the value of γ, due to experimental broadening of the peak. Additionally, the dielectric constant used was for chloroform, while the oleylamine capping agent likely changes the effective dielectric constant around the NPs. Finally, the largest source of discrepancy between experiment and theory could come from the choice of the effective hole mass of 0.8me. As previously discussed, the prior reported values for the hole mass in CuS do not come from pure samples, or is assumed to be the same as Cu2S. For this reason, the effective hole mass was calculated in the Γ–M direction around the Fermi energy using eqn (6). Performing this calculation results in an effective hole mass of 0.3me. The Γ–M direction was selected based both on the work of Lukashev et al.18 and the fact that this represents the same transverse direction the plasmon oscillates in. To ensure that there were no significantly different effective masses, the Γ–K direction was also tested. The calculated effective mass is consistent with Lukashev's calculated electron effective mass for Cu2S, a result that is not unexpected. For a metal at reasonable temperatures, the narrow spread of the Fermi–Dirac distribution should result in electrons and holes having similar effective masses. Using this effective mass results in experimental charge carrier densities of 4.70, 4.64 and 5.27 × 1021 cm−3, which are approximately half of the predicted value of 9.81 × 1021 cm−3. This effective mass can be considered as a lateral effective mass; the transverse effective mass calculated at the Γ point using the Γ–A direction is significantly larger with 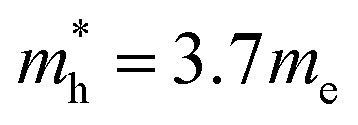 and
and 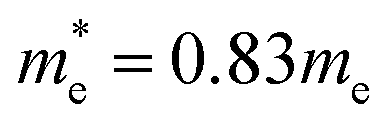 . Combined with a calculated energy gap of 1.45 eV in the z-direction, it is not expected that there will be sufficient carriers with small enough effective mass to support an out-of-plane plasmon. The band structures in the Γ–A and Γ–M direction used for these calculations can be found in Fig. S4.†
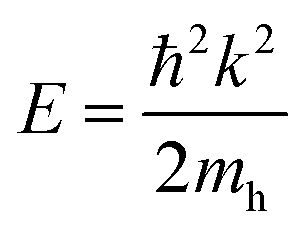 | (6) |
In conclusion, a new simple size-controlled microwave synthesis method for oleylamine-capped CuS nanodiscs has been developed. The particles have undergone multiple characterization techniques to accurately determine the structure and confirm that the only differences made by the reaction time are the size of the disc-like NPs and resulting plasmon absorption. Furthermore, using a conventional effective hole mass of 0.8me, charge carrier densities of 1.2–1.4 × 1022 cm−3 were obtained, while density functional theory was used to determine a predicted charge carrier density of 9.81 × 1021 cm−3. Using the calculated band structure around the Fermi energy resulted in a lower effective hole mass of 0.3me, closer to that predicted for electrons in less heavily doped copper sulfides. Finally, using this calculated effective mass, the experimental charge carrier densities were recalculated to be 4.7–5.3 × 1021 cm−3, approximately half of the predicted value.
Conflicts of interest
There are no conflicts to declare.Acknowledgements
The authors acknowledge the support from NSF grants (1511194 and 1832134), and North Carolina State funding through Joint School of Nanoscience and Nanoengineering. This work was performed at the JSNN, a member of South Eastern Nanotechnology Infrastructure Corridor (SENIC) and National Nanotechnology Coordinated Infrastructure (NNCI), which is supported by the National Science Foundation (ECCS-1542174).Notes and references
- K. Ding, J. Zeng, L. Jing, R. Qiao, C. Liu, M. Jiao, Z. Li and M. Gao, Nanoscale, 2015, 7, 11075–11081 RSC.
- G. Ku, M. Zhou, S. Song, Q. Huang, J. Hazle and C. Li, ACS Nano, 2012, 6, 7489–7496 CrossRef CAS PubMed.
- M. Zhou, J. Li, S. Liang, A. K. Sood, D. Liang and C. Li, ACS Nano, 2015, 9, 7085–7096 CrossRef CAS PubMed.
- M. Zhou, R. Zhang, M. Huang, W. Lu, S. Song, M. P. Melancon, M. Tian, D. Liang and C. Li, J. Am. Chem. Soc., 2010, 132, 15351–15358 CrossRef CAS PubMed.
- I. Grozdanov and M. Najdoski, J. Solid State Chem., 1995, 114, 469–475 CrossRef CAS.
- S. W. Hsu, C. Ngo and A. R. Tao, Nano Lett., 2014, 14, 2372–2380 CrossRef CAS PubMed.
- S.-W. Hsu, W. Bryks and A. R. Tao, Chem. Mater., 2012, 24, 3765–3771 CrossRef CAS.
- S.-W. Hsu, K. On and A. R. Tao, J. Am. Chem. Soc., 2011, 133, 19072–19075 CrossRef CAS PubMed.
- J. M. Luther, P. K. Jain, T. Ewers and A. P. Alivisatos, Nat. Mater., 2011, 10, 361–366 CrossRef CAS PubMed.
- P. Parreira, G. Lavareda, A. Amaral, A. M. Botelho do Rego, O. Conde, J. Valente, F. Nunes and C. Nunes de Carvalho, J. Alloys Compd., 2011, 509, 5099–5104 CrossRef CAS.
- H. Lee, S. W. Yoon, E. J. Kim and J. Park, Nano Lett., 2007, 7, 778–784 CrossRef CAS PubMed.
- Y. Kim, K. Y. Park, D. M. Jang, Y. M. Song, H. S. Kim, Y. J. Cho, Y. Myung and J. Park, J. Phys. Chem. C, 2010, 114, 22141–22146 CrossRef CAS.
- C. Ratanatawanate, A. Bui, K. Vu and K. J. Balkus, J. Phys. Chem. C, 2011, 115, 6175–6180 CrossRef CAS.
- M. C. Brelle, C. L. Lorres-Martinez, J. C. McNulty, R. K. Mehra and J. Z. Zhang, Pure Appl. Chem., 2000, 72, 101–117 CAS.
- Y. Zhao, H. Pan, Y. Lou, X. Qui, J. Zhu and C. Burda, J. Am. Chem. Soc., 2009, 131, 4253–4261 CrossRef CAS PubMed.
- A. Morales-Garcia, A. L. Soares Jr, E. C. Dos Santos, H. A. de Abreu and H. A. Duarte, J. Phys. Chem. A, 2014, 118, 5823–5831 CrossRef CAS PubMed.
- L. Xiao, J. Wu, J. Ran, Y. Liu, W. Qiu, F. Lu, F. Shao, D. Tang and P. Peng, AIP Adv., 2016, 6, 085122 CrossRef.
- P. Lukashev, W. R. L. Lambrecht, T. Kotani and M. van Schilfgaarde, Phys. Rev. B: Condens. Matter Mater. Phys., 2007, 76, 195202 CrossRef.
- R. Kykyneshi, PhD Dissertation, Oregon State University, 2007.
- M. R. Kim, H. A. Hafez, X. Chai, L. V. Besteiro, L. Tan, T. Ozaki, A. O. Govorov, R. Izquierdo and D. Ma, Nanoscale, 2016, 8, 12946–12957 RSC.
- L. Liu, H. Zhong, Z. Bai, T. Zhang, W. Fu, L. Shi, H. Xie, L. Deng and B. Zou, Chem. Mater., 2013, 25, 4828–4834 CrossRef CAS.
- M. Liu, X. Xue, C. Ghosh, X. Liu, Y. Liu, E. P. Furlani, M. T. Swihart and P. N. Prasad, Chem. Mater., 2015, 27, 2584–2590 CrossRef CAS.
- Y. Xie, L. Carbone, C. Nobile, V. Grillo, S. D'Agostino, F. D. Sala, C. Giannini, D. Altamura, C. Oelsner, C. Kryschi and P. D. Cozzoli, ACS Nano, 2013, 7, 7352–7369 CrossRef CAS PubMed.
- Y. Xie, A. Riedinger, M. Prato, A. Casu, A. Genovese, P. Guardia, S. Sottini, C. Sangregorio, K. Miszta, S. Ghosh, T. Pellegrino and L. Manna, J. Am. Chem. Soc., 2013, 135, 17630–17637 CrossRef CAS PubMed.
- P. K. Jain, K. Manthiram, J. H. Engel, S. L. White, J. A. Faucheaux and A. P. Alivisatos, Angew. Chem., Int. Ed. Engl., 2013, 52, 13671–13675 CrossRef CAS PubMed.
- C. O. Kappe, Angew. Chem., Int. Ed. Engl., 2004, 43, 6250–6284 CrossRef CAS PubMed.
- I. Bilecka and M. Niederberger, Nanoscale, 2010, 2, 1358 RSC.
- I. Kriegel, F. Scotognella and L. Manna, Phys. Rep., 2017, 674, 1–52 CrossRef CAS.
- E. Godočíková, P. Baláž, J. M. Criado, C. Real and E. Gock, Thermochim. Acta, 2006, 440, 19–22 CrossRef.
- W. L. Barnes, Am. J. Phys., 2016, 84, 593–601 CrossRef CAS.
- P. Giannozzi, S. Baroni, N. Bonini, M. Calandra, R. Car, C. Cavazzoni, D. Ceresoli, G. L. Chiarotti, M. Cococcioni, I. Dabo, A. Dal Corso, S. de Gironcoli, S. Fabris, G. Fratesi, R. Gebauer, U. Gerstmann, C. Gougoussis, A. Kokalj, M. Lazzeri, L. Martin-Samos, N. Marzari, F. Mauri, R. Mazzarello, S. Paolini, A. Pasquarello, L. Paulatto, C. Sbraccia, S. Scandolo, G. Sclauzero, A. P. Seitsonen, A. Smogunov, P. Umari and R. M. Wentzcovitch, J. Phys.: Condens. Matter, 2009, 21, 395502 CrossRef PubMed.
- P. E. Blöchl, Phys. Rev. B: Condens. Matter Mater. Phys., 1994, 50, 17953–17979 CrossRef PubMed.
- G. Kresse and D. Joubert, Phys. Rev. B: Condens. Matter Mater. Phys., 1999, 59, 1758–1775 CrossRef CAS.
- J. P. Perdew, K. Burke and M. Ernzerhof, Phys. Rev. Lett., 1996, 77, 3865–3868 CrossRef CAS PubMed.
- H. J. Monkhorst and J. D. Pack, Phys. Rev. B: Solid State, 1976, 13, 5188–5192 CrossRef.
- S. L. Dudarev, G. A. Botton, S. Y. Savrasov, C. J. Humphreys and A. P. Sutton, Phys. Rev. B: Condens. Matter Mater. Phys., 1998, 57, 1505–1509 CrossRef CAS.
- C. Kittel, Introduction to Solid State Physics, Wiley, 8th edn, 2004 Search PubMed.
- S. Conejeros, P. Moreira Ide, P. Alemany and E. Canadell, Inorg. Chem., 2014, 53, 12402–12406 CrossRef CAS PubMed.
- I. I. Mazin, Phys. Rev. B: Condens. Matter Mater. Phys., 2012, 85, 115133 CrossRef.
Footnote |
| † Electronic supplementary information (ESI) available: Experimental procedures and characterization methods. See DOI: 10.1039/d0na00069h |
| This journal is © The Royal Society of Chemistry 2020 |