
 Open Access Article
 This Open Access Article is licensed under a Creative Commons Attribution-Non Commercial 3.0 Unported Licence
Structure-tunable supraparticle assemblies of hollow cupric oxide sheathed with nanographenes†
Minsu
Gu‡
 a,
Woo-ram
Lee‡
b,
Minkyung
Kim
c,
Jiwoong
Kang
b,
Jae Sung
Lee
c,
Levi T.
Thompson
d and
Byeong-Su
Kim
*a
a,
Woo-ram
Lee‡
b,
Minkyung
Kim
c,
Jiwoong
Kang
b,
Jae Sung
Lee
c,
Levi T.
Thompson
d and
Byeong-Su
Kim
*a
aDepartment of Chemistry, Yonsei University, Seoul 03722, Korea. E-mail: bskim19@yonsei.ac.kr
bDepartment of Chemical Engineering, University of Michigan, Ann Arbor, Michigan 48109, USA
cSchool of Energy and Chemical Engineering, Ulsan National Institute of Science and Technology (UNIST), Ulsan 44919, Korea
dCollege of Engineering, University of Delaware, Newark, Delaware 19716, USA
First published on 5th February 2020
Abstract
Self-assembled supraparticles (SPs), a secondary structure of clustered nanoparticles, have attracted considerable interest owing to their highly tunable structure, composition, and morphology from their primary nanoparticle constituents. In this study, hierarchically assembled hollow Cu2O SPs were prepared using a cationic polyelectrolyte poly(diallyl dimethylammonium chloride) (PDDA) during the formation of Cu2O nanoparticles. The concentration-dependent structural transformation of PDDA from linear chains to assembled droplets plays a crucial role in forming a hollow colloidal template, affording the self-assembly of Cu2O nanoparticles as a secondary surfactant. The use of the positively charged PDDA also affords negatively charged nanoscale graphene oxide (NGO), an electrical and mechanical supporter to uniformly coat the surface of the hollow Cu2O SPs. Subsequent thermal treatment to enhance the electrical conductivity of NGO within the NGO/Cu2O SPs allows for the concomitant phase transformation of Cu2O to CuO, affording reduced NGO/CuO (RNGO/CuO) SPs. The uniquely structured hollow RNGO/CuO SPs achieve improved electrochemical properties by providing enhanced electrical conductivity and electroactive surface area.
Introduction
Inorganic nanomaterials are known to be spontaneously assembled together into higher ordered supraparticles (SPs) under specific assembling conditions through a self-limiting process controlling the size, shape, and morphology of individual nanoparticles.1,2 Unlike their individual structures, the self-assembled structures of SPs provide diverse collective and synergistic properties such as magnetic, optical, catalytic, and electrochemical properties.3,4 Therefore, self-assembled SPs have attracted extensive interest in promising applications ranging from biological systems, including drug delivery and protein mimics to sensors and energy applications in photovoltaics and charge storage.5–10Cupric oxide (CuO) has attracted attention due to its environmental benignity, high safety, abundant natural sources, and electronic and electrochemical properties.11–13 In addition, CuO is considered to be a superior alternative to a conventional graphite anode in lithium-ion batteries (LIBs) because of its safety characteristics and high theoretical capacity of 674 mA h g−1.14,15 Despite these unique advantages, CuO is also limited by its low electronic conductivity and drastic volume change during the charge/discharge processes that often causes large internal stress, pulverization of the electrode, and destruction of the conduction pathways.
To address these drawbacks, extensive efforts have been made to carefully engineer the nanoscale structure of CuO, such as nanoparticles, nanosheets, nanowires, and nanocomposites, due to their inherent advantages in providing more reaction sites on the surface and their ability to accommodate strain relaxation more efficiently compared to conventional bulk electrode materials.11–13,16–23 However, it is still highly desirable to pursue new materials with unconventional morphology and compositions of nanostructured CuO.
In this regard, we introduce a simple, scalable, and solution-processable synthetic route for hierarchically assembled CuO SPs by the synergetic design of a hollow porous structure sheathed with conductive graphene nanosheets (Scheme 1). Unlike the direct synthesis of CuO nanoparticles, we prepared a self-assembled secondary structure of hollow SPs which consists of primary nanoparticles (approximately 12 nm in diameter). This unique design strategy allows for the formation of both interior voids and pores between the nanoparticles, which can provide not only free spaces to accommodate the volume variations during the electrochemical reaction, but also short diffusion paths for mass transfer into the nanoparticles and facile penetration of the electrolyte.9,10,24–26 These SPs also combine the advantages of high capacity, fast kinetics of nanometre-sized building units, and enhanced stability of supraparticle assemblies.
 | ||
| Scheme 1 Illustration of the synthetic processes of hollow porous cupric oxide supraparticles sheathed with reduced nanoscale graphene oxide nanosheets (RNGO/CuO SPs). | ||
Graphene and its derivatives, such as graphene oxide (GO), have been considered excellent candidates for hybrid composites with transition metal oxide anodes by endowing them with high electrical conductivity and alleviating their large volume expansion.27–34 However, the direct use of conventional micrometre-sized GO in hybrid nanocomposite assemblies is limited due to its chemical and dimensional incompatibility. By taking advantage of the surface chemistry of graphene oxide derivatives,35–42 the surface of the positively charged Cu2O SPs, modified with cationic poly(diallyl dimethylammonium chloride) (PDDA) polyelectrolyte, was uniformly coated with nanoscale graphene oxide (NGO) nanosheets by electrostatic interactions. Interestingly, we found that thermal treatment of NGO within the NGO/Cu2O SPs to enhance the electrical conductivity also allowed for the concomitant phase transformation of Cu2O into CuO, affording reduced RNGO/CuO SPs. The prepared RNGO/CuO SPs exhibited a significantly enhanced electrochemical performance with a capacity of 657 mA h g−1 and a high rate capability even at 2000 mA g−1 with a stable cycling performance in LIBs. This high and stable battery anode performance demonstrated that the rationally designed hollow RNGO/CuO SPs not only provided sufficient surface area for facile ionic transfer of Li ions, but also sustained a good electronic conductivity pathway though the RNGO coating layers.
Experimental
Materials
Graphite nanofibers were purchased from Catalytic Materials (USA). Copper(II) acetate monohydrate (Cu(OAc)2·H2O), L-ascorbic acid, poly(diallyldimethylammonium chloride) solution (PDDA, 20 wt% in water, Mw 100![[thin space (1/6-em)]](https://www.rsc.org/images/entities/char_2009.gif) 000–200000), and n-methyl-2-pyrrolidone (NMP) were purchased from Sigma-Aldrich. Super P Li carbon and polyvinylidene fluoride (PVDF) were obtained from TIMCAL and Kynar, respectively. The Celgard 2500 separator was purchased from Celgard. 1.0 M LiPF6 electrolyte in a mixture (1:1 v/v) of ethylene carbonate and dimethyl carbonate was purchased from SoulBrain and used without further purification.
000–200000), and n-methyl-2-pyrrolidone (NMP) were purchased from Sigma-Aldrich. Super P Li carbon and polyvinylidene fluoride (PVDF) were obtained from TIMCAL and Kynar, respectively. The Celgard 2500 separator was purchased from Celgard. 1.0 M LiPF6 electrolyte in a mixture (1:1 v/v) of ethylene carbonate and dimethyl carbonate was purchased from SoulBrain and used without further purification.
Synthesis of NGO
NGO was synthesized from graphite nanofibers (Catalytic Materials, USA) according to a literature method using ultrasonication at a concentration of 0.50 mg mL−1.43Synthesis of Cu2O SPs
The Cu2O SPs were prepared at room temperature according to a modification of a previously reported procedure.44 In a typical synthesis, 1.0 g of Cu(OAc)2·H2O and varying concentrations of PDDA solutions of 0.016, 0.16, 0.48 or 0.80 mg mL−1 were dissolved in 50 mL of deionized (DI) water. To this solution mixture, 1.0 g of ascorbic acid was added and then allowed to react for 5 min with occasional agitation. After the reaction, the suspension was centrifuged at 10000 rpm for 10 min and washed twice with DI water.
Preparation of NGO/Cu2O nanocomposites
The Cu2O SPs stabilized with PDDA were mixed with a suspension of NGO (conc. 0.50 mg mL−1) for 20 min. The resulting solution was washed twice with DI water using centrifugation at 4000 rpm for 10 min.Preparation of RNGO/CuO nanocomposites
The assembled NGO/Cu2O nanocomposites were subjected to a thermal treatment at 200 °C for 12 h in an oven under atmospheric conditions. The temperature was raised at a rate of 5 °C min−1.Characterization
The morphology of the samples was investigated using scanning electron microscopy (SEM) (cold FE-SEM, Hitachi, S-4800). The hydrodynamic diameter was studied using dynamic light scattering (DLS, HORIBA Scientific, SZ-100). The size and morphology of the prepared SPs were measured by transmission electron microscopy (normal-TEM, JEOL, JEM-2100, accelerating voltage of 200 kV). High-resolution TEM and elemental analysis were carried out by high-resolution transmission electron microscopy (HRTEM), high-angle annular dark field scanning transmission electron microscopy (HAADF-STEM), and energy dispersive X-ray spectroscopy (EDXS) (JEOL, JEM-2100F, accelerating voltage of 200 kV). Thermogravimetric analysis (TGA; TA instruments, Q50) was used to calculate the mass content of Cu2O and NGO. The microstructures of the samples were studied using a high-power X-ray diffractometer (XRD) and a Cu Kα source (Rigaku, D/MAZX 2500V/PC). The SPs were analysed by X-ray photoelectron spectroscopy (XPS, Thermo Fisher, K-alpha). Attenuated total reflectance-infrared (ATR-IR) spectra were analysed with a FT-IR spectrophotometer (Varian, 670-IR). The zeta potential of the suspensions was measured using a zeta potential analyzer (Malvern, Zetasizer Nano ZS).Electrochemical analysis
Electrodes were prepared using a slurry made from a dry composition of 70% active material, 20% Super P Li carbon, and 10% PVDF in NMP. A high-speed FlakTech mixer (Landrum, SC, USA) was used to ensure that the slurry was well mixed. The slurry was doctor bladed onto a clean copper foil current collector and then dried under vacuum at 110 °C overnight. The total mass loading of the materials was approximately 3–4 mg cm−2. Cyclic voltammetry (CV) and charge/discharge measurements were performed using 2032 coin cells assembled in an argon filled glovebox with lithium metal discs as the counter electrode and a Celgard 2500 membrane as the separator. The electrolyte consisted of a mixture of ethylene carbonate and dimethyl carbonate (1:1 v/v) with 1.0 M LiPF6 as the supporting electrolyte. CV was performed using a Metrohm Autolab potentiostat over the voltage range from 0.02 to 3.0 V vs. Li/Li+ at a scan rate of 0.1 mV s−1, with the lithium metal counter electrode serving as a Li/Li+ quasi reference electrode. Galvanostatic charge–discharge experiments were performed using a Maccor Series 4000 multichannel battery test stand over the voltage range from 0.02 to 3.0 V vs. Li/Li+. A minimum of three devices were tested for each electrode material to confirm reproducibility, and the average capacity values were reported, with the standard deviation of the capacity for the 10th cycle less than 7%.
Results and discussion
Cu2O SPs were synthesized using a simple one-step chemical reduction method in the presence of varying concentrations of the PDDA surfactant. Interestingly, the use of PDDA enables the formation of highly spherical and uniform Cu2O SPs, composed of primary Cu2O nanoparticles, 12.5 ± 4.8 nm in diameter (Fig. 1 and S1 in the ESI†). Unlike a previous protocol that employed polyacrylamide,44 PDDA was used as the surfactant in order to introduce a positively charged surface onto the Cu2O SPs. In the case of polyacrylamide, NGO hardly coated the Cu2O SPs in the following NGO coating procedure due to the lack of electrostatic interactions between NGO and the Cu2O SP surface. In the absence of any polymer, the size and shape of the Cu2O SPs were irregular due to the random aggregation of the Cu2O nanoparticles.44 | ||
| Fig. 1 Morphology transformation of Cu2O SPs assisted by the PDDA surfactant. SEM images of Cu2O SPs prepared at various PDDA concentrations: (a) 0.016, (b) 0.16, and (c) 0.80 mg mL−1, with a corresponding schematic illustration. (d) Representative TEM images of hollow Cu2O SPs from sample c when 0.80 mg mL−1 PDDA was used. (e) Diameter and zeta potential of Cu2O SPs prepared with different concentrations of PDDA. | ||
As monitored using the scanning electron microscopy (SEM) images shown in Fig. 1, the size of the Cu2O SPs decreased from 2.59 ± 0.36 to 0.39 ± 0.06 μm upon increasing the concentration of PDDA from 0.016 to 0.80 mg mL−1 whereas the corresponding zeta potential increased from +23.8 mV to +49.2 mV due to the increasing charge density on the smaller Cu2O SPs. Interestingly, we observed a change in the morphology of the PDDA-stabilized Cu2O SPs from spherical to a hollow structure upon increasing the concentration of PDDA (Fig. 1a–c). The TEM images in Fig. 1d clearly show the hollow structure of the Cu2O SPs with a shell thickness of approximately 103 ± 11 nm, resulting in a 40% internal void sphere within the Cu2O SPs. In general, it is well-known that the formation of single-shelled Cu2O hollow spheres is assisted by micelles and vesicles as soft templates, such as cetyltrimethlyammonium bromide.45 Although the polymeric backbone structure of hydrophilic PDDA is significantly different from the molecular structure of amphiphilic cetyltrimethlyammonium bromide, it has also been reported that PDDA droplets can be used as a soft template to create hollow titania structures.46 Furthermore, the high degree of alkylation of polyamines and the high concentration of PDDA, a long-chain quaternary ammonium polymer that results in enhanced hydrophobicity of the polymer, induce the formation of droplets composed of PDDA with a segregated polymer backbone chain in a solvent.47,48
To prove that these PDDA droplets serve as a soft template for the formation of hollow Cu2O SPs, the hydrodynamic diameter (Dh) of PDDA was measured by dynamic light scattering (DLS) at various concentrations of PDDA in the presence of 0.10 M Cu(OAc)2 precursor, which was identical to the concentration used in the synthesis of Cu2O SPs (Fig. 2). The molar concentration ratio of Cu ions to monomer units of PDDA (in the case of 0.80 mg mL−1) was estimated to be approximately 20. The Dh of the PDDA template was determined to be 215 ± 14 nm (0.80 mg mL−1), 506 ± 22 nm (1.6 mg mL−1), and 390 ± 17 nm (3.2 mg mL−1). However, it was difficult to obtain a reliable Dh of PDDA at concentrations below 0.50 mg mL−1. Note that the size of the internal hollow sphere matches that measured by TEM in Fig. 1, signifying that the hollow assembly of the primary Cu2O nanoparticles formed on the surface of the PDDA droplets.
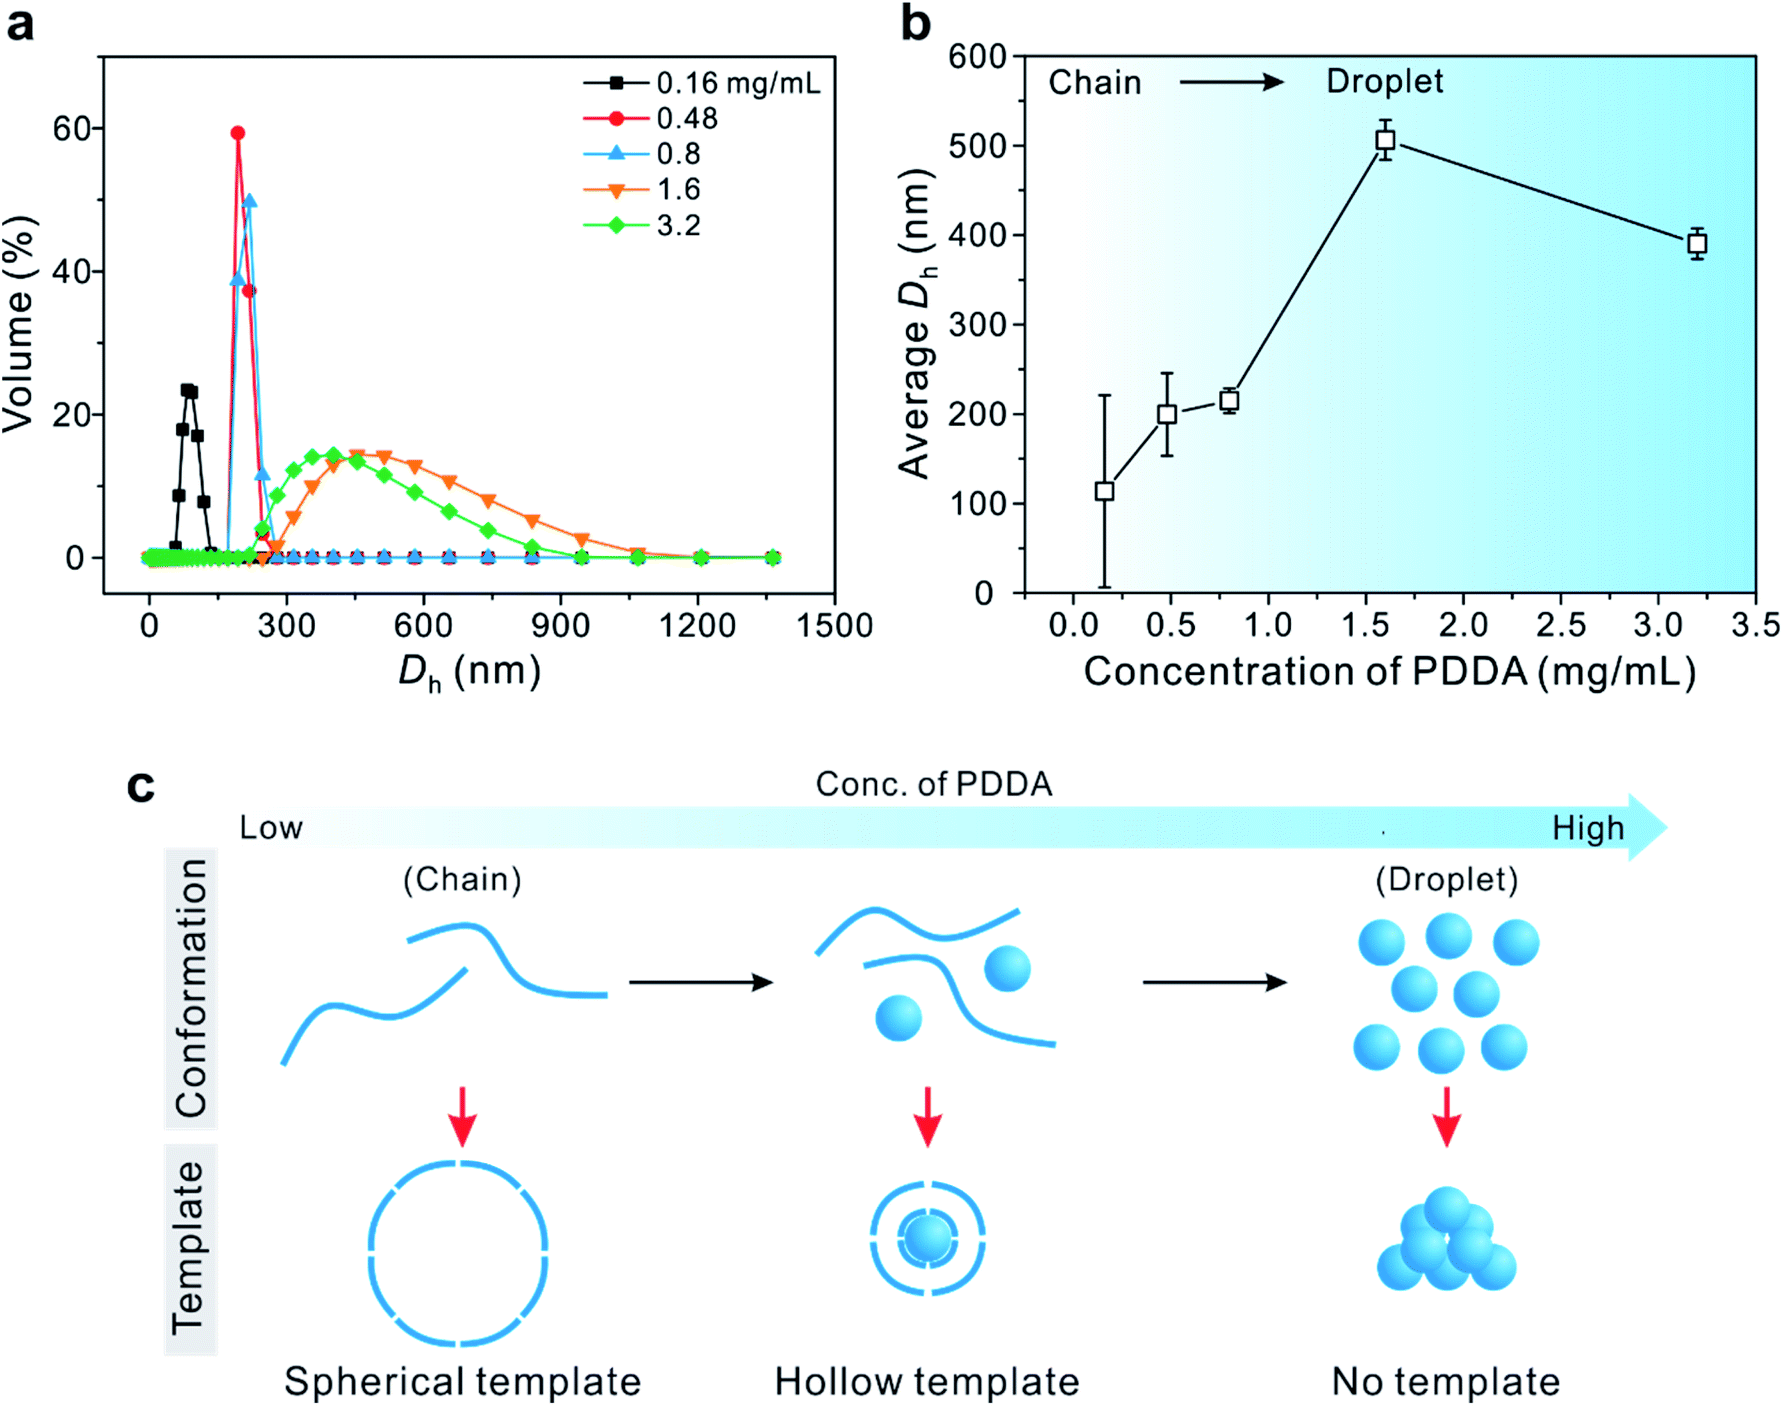 | ||
| Fig. 2 (a) Volume distribution and (b) the corresponding average hydrodynamic diameter (Dh) of PDDA by DLS upon increasing the PDDA concentration in the presence of 0.10 M Cu(OAc)2. (c) A schematic illustration of the conformational transition of the PDDA template from a chain to a droplet with increasing concentration of PDDA. | ||
On the other hand, at higher concentrations of PDDA, above 1.6 mg mL−1, a precipitate was observed without the formation of uniform hollow Cu2O SPs. These results imply that the co-existence of linear chains and droplets of PDDA in an appropriate ratio plays a crucial role, not only in assembling Cu2O nanoparticles as the secondary surfactant, but also in forming the hollow structure via the soft colloidal template.
As a representative sample of the hierarchical assembly of NGO with Cu2O SPs, the hollow Cu2O SP synthesized at a PDDA concentration of 0.80 mg mL−1 was chosen because of its structural and electrochemical advantages derived from the unique hollow structure. Based on the electrostatic interaction, the positively charged hollow Cu2O SPs were assembled with the negatively charged NGO to afford the NGO/Cu2O nanocomposites. The complementary adsorption of NGO on the surface of the Cu2O SPs was monitored from the reversal of the zeta potential value of Cu2O SPs from +49.2 mV to −21.3 mV at pH 7. Moreover, the morphology of the Cu2O SPs decorated with NGO displayed an increased surface roughness compared to that of bare Cu2O SPs (Fig. S2†). This increased surface roughness and nanopores on the surface were confirmed by a nitrogen adsorption/desorption measurement using Brunauer–Emmett–Teller (BET) surface area analysis on the basis of the Barrett–Joyner–Halenda (BJH) model (Fig. S3†). For instance, bare Cu2O SPs and NGO/Cu2O nanocomposites exhibited a mean pore diameter of 6.2 and 3.5 nm, respectively, while the BJH pore surface area of bare Cu2O SPs and NGO/Cu2O was 129.8 and 153.0 m2 g−1, respectively. In addition, the total surface area measured by BET of NGO/Cu2O was 86.5 m2 g−1, which is considerably higher than that of bare Cu2O SPs, 56.2 m2 g−1. The high surface area of NGO/Cu2O not only indicates the successful coverage of the Cu2O SPs with NGO, but also offers advantageous porous structures for electrochemical performance by an enhanced interaction between the active materials and the electrolyte.
The successful coating by NGO was further observed with TEM images corresponding to the associated elemental information by high-angle annular dark field scanning transmission electron microscopy (HAADF-STEM) (Fig. 3a and b). Elemental copper, oxygen, and carbon were uniformly distributed over the entire SPs in addition to elemental Cl that originated from the counter ion of PDDA encapsulating Cu2O SPs (Fig. 3c). It should be noted that the nanoscale NGO nanosheets had an average lateral dimension of 23 nm which enables them to uniformly coat the surface of the Cu2O SPs, facilitating diffusion of the electrolyte into the inner pores of the hollow Cu2O SPs, which could not be achieved by using typical micron-scale GO nanosheets (Fig. S4†). High-resolution TEM images also showed a distinct morphology of graphene sheets on the Cu2O SPs and a lattice distance of 0.246 nm of the corresponding (111) plane in Cu2O (Fig. 3d).
 | ||
| Fig. 3 (a) HAADF-STEM and (b) TEM image with (c) the corresponding elemental mapping images of NGO/Cu2O SPs. (d) High-resolution TEM image and the corresponding digital diffractograms of Cu2O. | ||
We further conducted a thermal treatment process using the NGO/Cu2O nanocomposites to further control the electrical and chemical properties as well as morphology. The NGO nanosheets in NGO/Cu2O SPs were reduced to reduced NGO (i.e., RNGO) after thermal treatment at 200 °C for 12 h under an ambient atmosphere. Interestingly, we found that the phase of Cu2O was also transformed into CuO during the process, leading to the formation of RNGO/CuO SPs. The phase transition of Cu2O was clearly observed by XRD through the appearance of new peaks at 35.4° and 38.6°, corresponding to CuO (Fig. 4a and S5†). The broad XRD peak of NGO at around 11° was attributed to the (001) diffraction of NGO (Fig. S6†). The absence of this peak in the NGO/Cu2O nanocomposites indicated that the NGO encapsulation of the PDDA-modified Cu2O SPs effectively inhibited the re-stacking of the graphene sheets, and hence, limited the constructive diffractions from the ordered graphene sheets.29
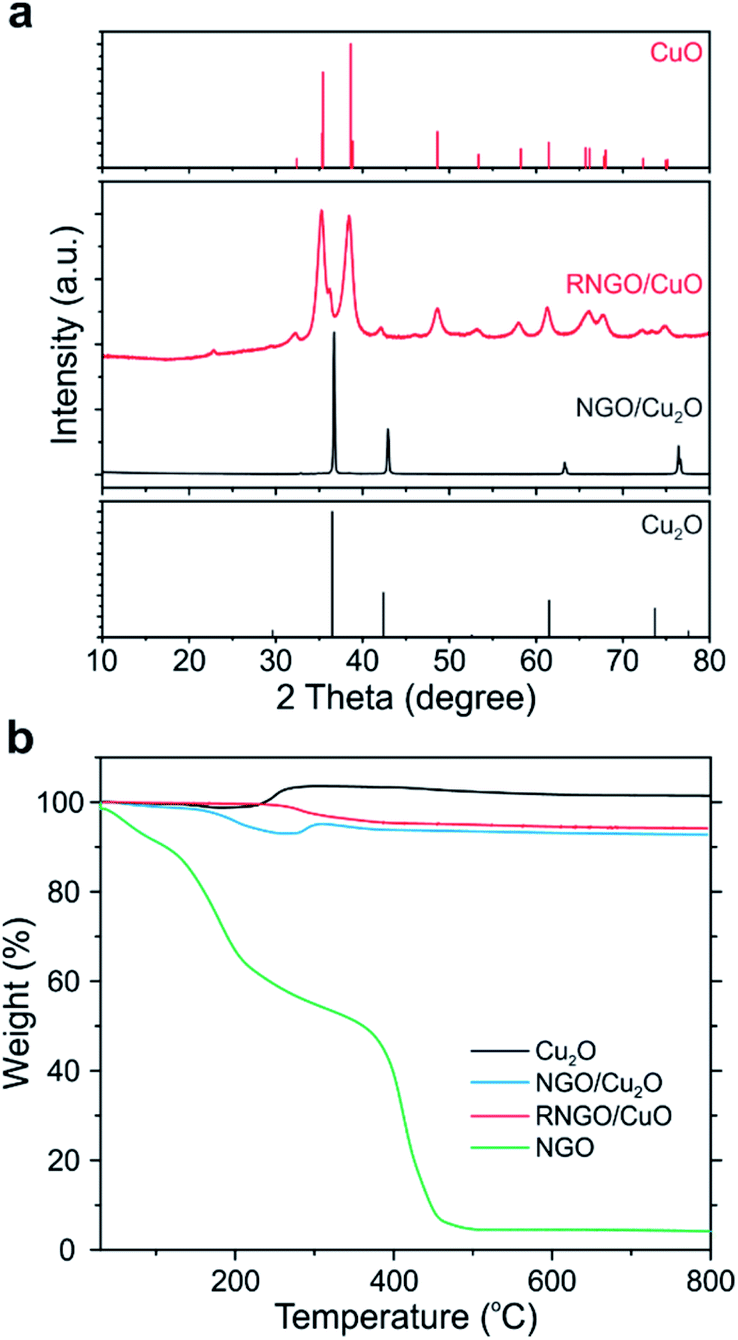 | ||
| Fig. 4 (a) XRD patterns and (b) TGA of NGO/Cu2O and RNGO/CuO nanocomposites compared to bare Cu2O and NGO. | ||
The phase transition of Cu2O was further examined using high-resolution X-ray photoelectron spectroscopy (XPS) spectra of Cu 2p for bare Cu2O, untreated NGO/Cu2O, and NGO/Cu2O after thermal treatment (Fig. S7†). The characteristic Cu 2p3/2 and Cu 2p1/2 peaks of Cu2O (Cu1+) were located at 932 and 952 eV, respectively. However, the thermally treated NGO/Cu2O SPs at 200 °C showed characteristic peaks corresponding to the fully converted CuO (Cu2+) at 934 and 954 eV, with new satellite peaks of CuO, while the thermally treated NGO/Cu2O SPs at 150 °C showed a mixed phase of Cu2O and CuO due to the co-existence of Cu1+ and Cu2+ (Fig. S7†).
The compositional ratio and the change of the Cu2O phase in the NGO/Cu2O nanocomposites were also evaluated by thermogravimetric analysis (TGA) (Fig. 4b). The mass of the bare Cu2O SPs began to increase to ∼104% at 200 °C due to the phase transition to CuO. In the case of the thermally treated NGO/Cu2O at 200 °C, however, this increase in mass was not observed, indicating that Cu2O was completely converted to CuO. The specific content of each component can be calculated using simple eqn (1):
| WCu2OXCu2O + WNGO(1 − XCu2O) = WNGO/Cu2O | (1) |
The successful reduction to RNGO was also revealed by XPS and Fourier-transform infrared (FT-IR) spectroscopy. In the C 1s spectra of NGO, the intensity of the peaks assigned to the oxygen-bearing functional groups such as hydroxy, carbonyl, and carboxylic groups disappeared after thermal reduction at 200 °C, indicating that the NGO nanosheets were successfully reduced (Fig. S7b†). This thermal reduction was also supported by the disappearance of the C–O and C![[double bond, length as m-dash]](https://www.rsc.org/images/entities/char_e001.gif) O stretching peaks of NGO in the FT-IR spectra, seen at 1140 and 1720 cm−1, respectively (Fig. S8†). As a result, these phase transition and reduction processes slightly affected the BET surface area of CuO (50.1 m2 g−1) and RNGO/CuO (31.6 m2 g−1) (Fig. S9†).
O stretching peaks of NGO in the FT-IR spectra, seen at 1140 and 1720 cm−1, respectively (Fig. S8†). As a result, these phase transition and reduction processes slightly affected the BET surface area of CuO (50.1 m2 g−1) and RNGO/CuO (31.6 m2 g−1) (Fig. S9†).
As a representative active material for promising energy application, the electrochemical properties of the Cu2O, NGO/Cu2O, and RNGO/CuO SPs were evaluated using cyclic voltammetry (CV) in coin cells with lithium metal disks as the counter electrode (Fig. 5 and S10†). The tests were conducted at 0.10 mV s−1 between 0.02 and 3.0 V vs. Li/Li+. In the first cathodic scan of RNGO/CuO in Fig. 5a, three peaks are observed at 1.4, 1.0, and 0.7 V, which can be ascribed to the formation of the CuII1−xCuIxO1−x/2 solid solution phase, the conversion of CuII1−xCuIxO1−x/2 into the Cu2O phase, and the decomposition of Cu2O into Cu and Li2O accompanied by the growth of organic layers of the electrolyte, respectively.11,12 The oxidation peaks during the first anodic scan at 1.3, 2.5, and 2.7 V are associated with the decomposition of the organic layers, formation of Cu2O and Li and the regeneration of CuO, respectively.12,21 In the second cycle, the reduction peaks shifted to higher potentials, and the individual peak intensity and integral area decreased due to the decomposition of the electrolyte and the consequent formation of a solid electrolyte interphase (SEI) layer, which is common for most transition metal oxide anodes (Fig. S10†). The subsequent CV curves are almost identical, implying the high reversibility of the redox reaction and good cycle stability.
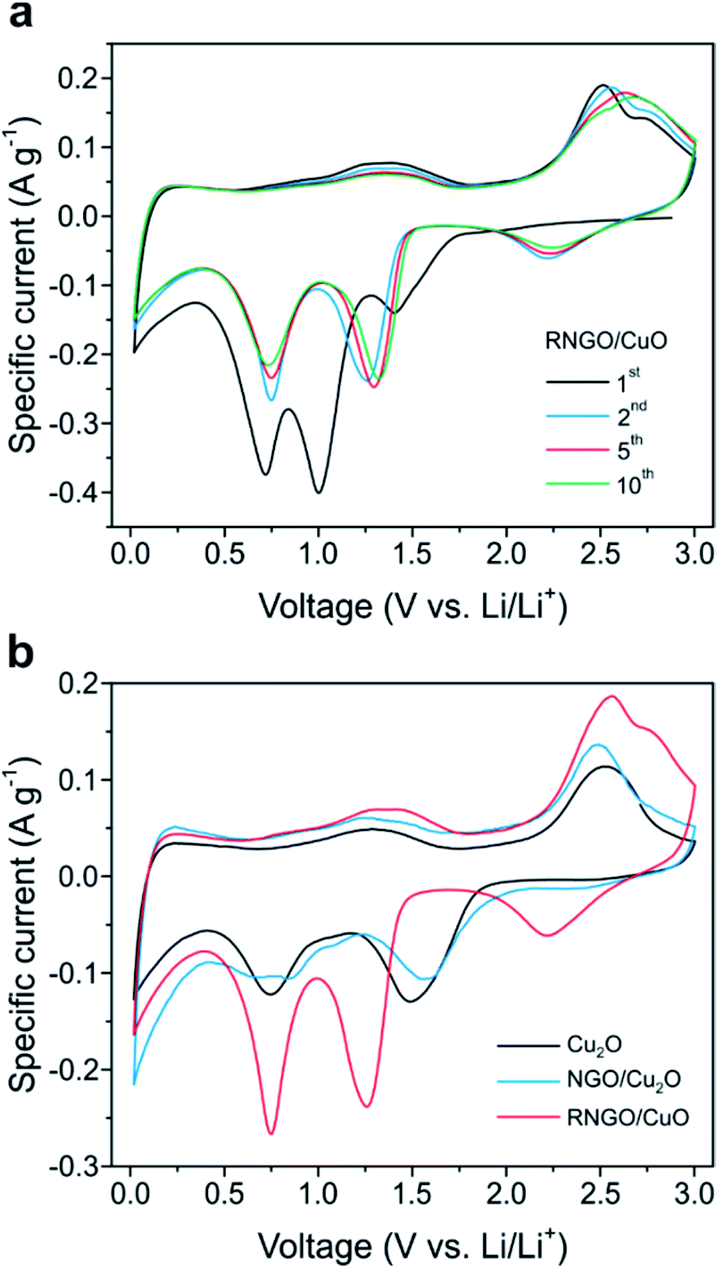 | ||
| Fig. 5 CV curves of (a) RNGO/CuO SPs for various electrochemical cycles and (b) comparison of CV curves of Cu2O, NGO/Cu2O, and RNGO/CuO from the 2nd cycle at a scan rate of 0.10 mV s−1 over the voltage range 0.02 to 3.0 V vs. Li/Li+. | ||
Another interesting feature is that the specific capacitance of the RNGO/CuO composites, calculated from the area under the CV peak, was 642 F g−1, considerably higher than the values of 411 and 522 F g−1 for Cu2O and NGO/Cu2O, respectively (Fig. 5b). This higher specific capacitance indicates the involvement of a larger amount of Li ions and the faster kinetics of the redox reactions on RNGO/CuO. The improved kinetics on RNGO/CuO composites is further demonstrated by the subsequent results from the charge/discharge cycles.
The capacities and rate capabilities for the Cu2O, NGO/Cu2O and RNGO/CuO anodes were determined by cycling experiments in coin cells (Fig. S11†). The respective mass of NGO or RNGO was included when the specific capacity of the composites was calculated. The RNGO/CuO SPs indicated three plateaus located at approximately 2.3, 1.3, and 0.8 V during discharge; these are consistent with the reduction peaks seen the CVs in Fig. 5. In Fig. S11b,† the RNGO/CuO SPs demonstrated a high and stable battery anode performance by delivering 657 mA h g−1 after the initial irreversible cycle and 576 mA h g−1 after 50 cycles. This electrochemical performance of RNGO/CuO is comparable to that of other CuO-based anode materials.13,20–23 The discharge capacities of the RNGO/CuO material were higher than those of Cu2O and NGO/Cu2O throughout all 50 cycles. Furthermore, RNGO/CuO showed a highly enhanced cycling stability of 71%, compared to that of bare CuO SPs of 30% for 100 cycles (Fig. S12†). All of the materials exhibited good coulombic efficiencies (∼100%), which indicates good reversibility of the lithium-ion insertion/extraction processes.
The rate capabilities were assessed by cycling the materials at 100, 500, 100, and 2000, and then 100 mA g−1, for running 10 cycles at each rate (Fig. S11c†). The capacities of the Cu2O containing cells faded quickly, falling to ∼78% of their second capacity by the 10th cycle at 100 mA g−1. The NGO/Cu2O material demonstrated improved capacity retention relative to the Cu2O material, retaining 99% of its low rate capacities until the 50th cycle. The RNGO/CuO cell showed a much higher capacity than Cu2O and NGO/Cu2O SPs. RNGO/CuO also maintained a high fraction of the initial capacities throughout cycling: 613 and 585 mA h g−1 for the 10th and 50th cycle, respectively, representing 96% and 91% of the second cycle capacity of 636 mA h g−1. Furthermore, RNGO/CuO showed higher capacities than the Cu2O and NGO/Cu2O SPs at higher discharge rates of 500 and 2000 mA g−1. The high performance of the RNGO/CuO SPs can be attributed to the appropriate morphological design and composite fabrication strategy.
This enhanced electrochemical performance again highlights the unique morphology of hollow and porous CuO SPs composed of tiny primary particles, which can provide a sufficient contact area for electrolyte penetration and a short diffusion length for Li ions. In addition, the top coating of RNGO, with a moderate electronic conductivity, onto the CuO SPs facilitates fast electron transfer in the electrode system.
Conclusions
We presented a simple process based on supraparticle (SP) assemblies to fabricate nanoscale graphene oxide nanosheet-sheathed hollow Cu2O nanocomposites (NGO/Cu2O SPs). The tunable morphology of the Cu2O SPs from spherical to hollow structures by varying the concentration of PDDA was examined to reveal the formation mechanism of the hollow secondary SPs by the free chain-to-droplet phase transformation of PDDA in the presence of a copper precursor. Furthermore, thermal treatment of NGO/Cu2O SPs not only reduced NGO to RNGO, resulting in an enhancement in the electrical conductivity, but also afforded the phase transition of Cu2O to CuO for high-performance anode materials of LIBs. We demonstrated that this control of structure and composition eventually led to improved electrochemical performances, including high reversible capacity, stable cycling retention, and superior rate capabilities. We anticipate that this tunable approach of using nanomaterials can be further extended to other SP assemblies to fabricate organic/inorganic hybrid nanocomposites for diverse applications.Conflicts of interest
There are no conflicts to declare.Acknowledgements
This work was supported by the National Research Foundation of Korea (NRF-2017R1A2B3012148).Notes and references
- S. Wintzheimer, T. Granath, M. Oppmann, T. Kister, T. Thai, T. Kraus, N. Vogel and K. Mandel, ACS Nano, 2018, 12, 5093–5120 CrossRef CAS PubMed.
- Y. S. Xia, T. D. Nguyen, M. Yang, B. Lee, A. Santos, P. Podsiadlo, Z. Y. Tang, S. C. Glotzer and N. A. Kotov, Nat. Nanotechnol., 2011, 6, 580–587 CrossRef CAS PubMed.
- Y. S. Xia and Z. Y. Tang, Chem. Commun., 2012, 48, 6320–6336 RSC.
- E. Piccinini, D. Pallarola, F. Battaglini and O. Azzaroni, Mol. Syst. Des. Eng., 2016, 1, 155–162 RSC.
- J. I. Park, T. D. Nguyen, G. D. Silveira, J. H. Bahng, S. Srivastava, G. P. Zhao, K. Sun, P. J. Zhang, S. C. Glotzer and N. A. Kotov, Nat. Commun., 2014, 5, 3593 CrossRef CAS PubMed.
- W. M. Park and J. A. Champion, ACS Nano, 2016, 10, 8271–8280 CrossRef CAS PubMed.
- T. P. Chou, Q. F. Zhang, G. E. Fryxell and G. Z. Cao, Adv. Mater., 2007, 19, 2588–2592 CrossRef CAS.
- X. L. Hu, J. M. Gong, L. Z. Zhang and J. C. Yu, Adv. Mater., 2008, 20, 4845–4850 CrossRef CAS.
- H. Guo, L. X. Liu, T. T. Li, W. W. Chen, Y. P. Wang and W. Wang, Chem. Commun., 2014, 50, 673–675 RSC.
- H. Guo, R. Mao, D. X. Tian, W. Wang, D. P. Zhao, X. J. Yang and S. X. Wang, J. Mater. Chem. A, 2013, 1, 3652–3658 RSC.
- D. M. Yin, G. Huang, Z. L. Na, X. X. Wang, Q. Li and L. M. Wang, ACS Energy Lett., 2017, 2, 1564–1570 CrossRef CAS.
- X. S. Hu, C. Li, X. B. Lou, Q. Yang and B. W. Hu, J. Mater. Chem. A, 2017, 5, 12828–12837 RSC.
- S. H. Wu, G. L. Fu, W. Q. Lv, J. K. Wei, W. J. Chen, H. Q. Yi, M. Gu, X. D. Bai, L. Zhu, C. Tan, Y. C. Liang, G. L. Zhu, J. R. He, X. Q. Wang, K. H. L. Zhang, J. Xiong and W. D. He, Small, 2018, 14, 1702667 CrossRef PubMed.
- M. V. Reddy, G. V. S. Rao and B. V. R. Chowdari, Chem. Rev., 2013, 113, 5364–5457 CrossRef CAS PubMed.
- K. Z. Cao, T. Jin, L. Yang and L. F. Jiao, Mater. Chem. Front., 2017, 1, 2213–2242 RSC.
- D. Deng and J. Y. Lee, ACS Appl. Mater. Interfaces, 2014, 6, 1173–1179 CrossRef CAS PubMed.
- L. Hu, Y. M. Huang, F. P. Zhang and Q. W. Chen, Nanoscale, 2013, 5, 4186–4190 RSC.
- R. Dang, X. L. Jia, X. Liu, H. T. Ma, H. Y. Gao and G. Wang, Nano Energy, 2017, 33, 427–435 CrossRef CAS.
- J. Y. Xiang, J. P. Tu, L. Zhang, Y. Zhou, X. L. Wang and S. J. Shi, J. Power Sources, 2010, 195, 313–319 CrossRef CAS.
- B. Wang, X. L. Wu, C. Y. Shu, Y. G. Guo and C. R. Wang, J. Mater. Chem., 2010, 20, 10661–10664 RSC.
- Y. J. Mai, X. L. Wang, J. Y. Xiang, Y. Q. Qiao, D. Zhang, C. D. Gu and J. P. Tu, Electrochim. Acta, 2011, 56, 2306–2311 CrossRef CAS.
- A. K. Rai, L. T. Anh, J. Gim, V. Mathew, J. Kang, B. J. Paul, N. K. Singh, J. Song and J. Kim, J. Power Sources, 2013, 244, 435–441 CrossRef CAS.
- L. N. Sun, Q. W. Deng, Y. L. Li, L. B. Deng, Y. Y. Wang, X. Z. Ren and P. X. Zhang, Electrochim. Acta, 2016, 222, 1650–1659 CrossRef CAS.
- Y. X. Yin, S. Xin and Y. G. Guo, Part. Part. Syst. Charact., 2013, 30, 737–753 CrossRef CAS.
- J. Zhu, K. Y. S. Ng and D. Deng, ACS Appl. Mater. Interfaces, 2014, 6, 2996–3001 CrossRef CAS PubMed.
- S. J. Ding, J. S. Chen, G. G. Qi, X. N. Duan, Z. Y. Wang, E. P. Giannelis, L. A. Archer and X. W. Lou, J. Am. Chem. Soc., 2011, 133, 21–23 CrossRef CAS PubMed.
- S. Wi, H. Woo, S. Lee, J. Kang, J. Kim, S. An, C. Kim, S. Nam, C. Kim and B. Park, Nanoscale Res. Lett., 2015, 10, 1–8 CrossRef CAS PubMed.
- D. Y. Chen, G. Ji, Y. Ma, J. Y. Lee and J. M. Lu, ACS Appl. Mater. Interfaces, 2011, 3, 3078–3083 CrossRef CAS PubMed.
- G. Ji, B. Ding, Z. Sha, J. S. Wu, Y. Ma and J. Y. Lee, Nanoscale, 2013, 5, 5965–5972 RSC.
- J. Y. Wang, Q. L. Deng, M. J. Li, K. Jiang, J. Z. Zhang, Z. G. Hu and J. H. Chu, Sci. Rep., 2017, 7, 8903 CrossRef PubMed.
- Y. T. Ma, J. Huang, L. Lin, Q. S. Xie, M. Y. Yan, B. H. Qu, L. S. Wang, L. Q. Mai and D. L. Peng, J. Power Sources, 2017, 365, 98–108 CrossRef CAS.
- D. J. Guo, Z. Y. Wei, B. Shi, S. W. Wang, L. Z. Wang, W. Tan and S. M. Fang, J. Mater. Chem. A, 2016, 4, 8466–8477 RSC.
- S. J. Shi, T. T. Deng, M. Zhang and G. Yang, Electrochim. Acta, 2017, 246, 1104–1111 CrossRef CAS.
- M. Gu, S. Ko, S. Yoo, E. Lee, S. H. Min, S. Park and B. S. Kim, J. Power Sources, 2015, 300, 351–357 CrossRef CAS.
- Y. Choi, M. Gu, J. Park, H. K. Song and B. S. Kim, Adv. Energy Mater., 2012, 2, 1510–1518 CrossRef CAS.
- M. Park, T. Lee and B. S. Kim, Nanoscale, 2013, 5, 12255–12260 RSC.
- T. Lee, S. H. Min, M. Gu, Y. K. Jung, W. Lee, J. U. Lee, D. G. Seong and B. S. Kim, Chem. Mater., 2015, 27, 3785–3796 CrossRef CAS.
- K. Jo, M. Gu and B. S. Kim, Chem. Mater., 2015, 27, 7982–7989 CrossRef CAS.
- M. Park, K. Song, T. Lee, J. Cha, I. Lyo and B. S. Kim, ACS Appl. Mater. Interfaces, 2016, 8, 21595–21602 CrossRef CAS PubMed.
- M. Gu and B. S. Kim, Nano Energy, 2016, 30, 658–666 CrossRef CAS.
- E. Ahn, T. Lee, M. Gu, M. Park, S. H. Min and B. S. Kim, Chem. Mater., 2017, 29, 69–79 CrossRef CAS.
- M. Gu, J. Choi, T. Lee, M. Park, I. S. Shin, J. Hong, H. W. Lee and B. S. Kim, Nanoscale, 2018, 10, 16159–16168 RSC.
- J. Luo, L. J. Cote, V. C. Tung, A. T. L. Tan, P. E. Goins, J. Wu and J. Huang, J. Am. Chem. Soc., 2010, 132, 17667–17669 CrossRef CAS PubMed.
- W. R. Lee, L. Piao, C. H. Park, Y. S. Lim, Y. R. Do, S. Yoon and S. H. Kim, J. Colloid Interface Sci., 2010, 342, 198–201 CrossRef CAS PubMed.
- H. L. Xu and W. Z. Wang, Angew. Chem., Int. Ed., 2007, 46, 1489–1492 CrossRef CAS PubMed.
- Y. Yan, B. Hao, X. B. Wang and G. Chen, Dalton Trans., 2013, 42, 12179–12184 RSC.
- D. J. Belton, S. V. Patwardhan, V. V. Annenkov, E. N. Danilovtseva and C. C. Perry, Proc. Natl. Acad. Sci. U. S. A., 2008, 105, 5963–5968 CrossRef CAS PubMed.
- L. Du, S. Zhang, G. Y. Chen, G. P. Yin, C. Y. Du, Q. Tan, Y. R. Sun, Y. T. Qu and Y. Z. Gao, ACS Appl. Mater. Interfaces, 2014, 6, 14043–14049 CrossRef CAS PubMed.
Footnotes |
| † Electronic supplementary information (ESI) available. See DOI: 10.1039/d0na00031k |
| ‡ These authors contributed equally to this work. |
| This journal is © The Royal Society of Chemistry 2020 |