 Open Access Article
Carbon source self-heating: ultrafast, energy-efficient and room temperature synthesis of highly fluorescent N, S-codoped carbon dots for quantitative detection of Fe(III) ions in biological samples†
Honggang
Yin‡
a,
Die
Gao‡
a,
Yan
Qiu
a,
Gaoyi
Yi
a,
Jun
Li
 b,
Yingying
Dong
b,
Kailian
Zhang
*a,
Zhining
Xia
b,
Yingying
Dong
b,
Kailian
Zhang
*a,
Zhining
Xia
 c and
Qifeng
Fu
 *a
*a
aSchool of Pharmacy, Southwest Medical University, Luzhou, Sichuan 646000, China. E-mail: fuqifeng1990@163.com; zkl66@swmu.edu.cn
bInstitute of Engineering Thermophysics, School of Energy and Power Engineering, Chongqing University, Chongqing 400030, China
cSchool of Pharmaceutical Sciences, Chongqing University, Chongqing, 401331, China
First published on 27th February 2020
Abstract
In recent years, photoluminescent (PL) carbon dots (CDs) have attracted enormous attention because of their many fascinating properties. However, the traditional synthesis routes of PL CDs usually suffer from relatively low quantum yields (QYs) and require complicated operation processes as well as lots of externally supplied energy. Herein, we report a room temperature, green, ultrafast and energy-efficient route for large scale synthesis of highly PL N, S-codoped CDs without any external energy supply. The N, S-codoped CDs are prepared through a novel carbon source self-heating strategy, using the sole precursor tetraethylenepentamine (TEPA) simultaneously as the carbon, nitrogen and heat source, triggered by the heat initiator sodium persulfate (Na2S2O8). The large amount of heat released from Na2S2O8-triggered oxidation of TEPA could effectively promote the spontaneous polymerization and carbonization of TEPA precursors themselves as well as the in situ co-doping of sulfur, which had marked synergistic effects on the fluorescence enhancement of CDs, eventually leading to the high-yield (58.0%) preparation of highly fluorescent N, S-codoped CDs (QY 26.4%) at room temperature within 2 min. Moreover, the fluorescence of N, S-codoped CDs could be selectively quenched by Fe3+ ions in the presence of EDTA, in an ultra-wide range of 0.2–600 μM, with a detection limit of 0.10 μM. Ultimately, the fluorescent nanoprobe was successfully used for the quantitative detection of Fe3+ in human serum samples, indicating its great potential for sensing and biomedical applications.
Introduction
In recent years, photoluminescent (PL) carbon dots (CDs) have captured tremendous attention for potential application in the fields of sensing,1–4 biolabeling,5,6 bioimaging7–9 and drug delivery,10,11 because of their low toxicity, good biocompatibility, excellent photostability, adjustable functionalities and PL properties. To produce PL CDs, a wide variety of strategies including electrochemical etching,12,13 laser ablation,14 pyrolysis,15 plasma treatment,16 microwave-assisted preparation,17 and hydrothermal or solvothermal synthesis18–21 have been developed. However, these synthesis routes usually require complicated and time-consuming processes (that usually last ten hours or longer), cumbersome experimental instruments or high synthesis temperature, which not only increases the cost, but also significantly restricts their large-scale fabrication and further industrial applications. Therefore, it is of great practical significance to further develop energy-efficient synthesis strategies for producing PL CDs at low temperature or even without requiring externally supplied energy.The common strategies for fabricating PL CDs at low temperature are based on the dehydration and condensation processes of reactants triggered by strong acid or alkali such as concentrated sodium hydroxide or sulfuric acid.22–25 However, the obtained CDs typically have relatively low quantum yields (QY, less than 5%) or take a long time to perform. In addition, the reaction heat produced from the ethylenediamine/triethylenetetramine-catalysed decomposition of hydrogen peroxide (H2O2) has been utilized as the heat source to induce the synthesis of hydroquinone-derived CDs at room temperature without strong acid or alkali.26,27 However, these strategies for fabricating CDs still require the costly external energy supplied by H2O2-based self-exothermic systems to carbonize the precursors. Additionally, only one kind of carbon source, i.e. hydroquinone, can be applied by the synthetic strategies, which restricts their practicability. Therefore, it is highly desirable to further develop more facile, energy-efficient, green and scalable strategies for the room temperature synthesis of functionalized PL CDs without any external energy supply.
On the other hand, heteroatom doping of CDs has become an emerging topic for effectively tuning the intrinsic properties of CDs. It is well known that doping of CDs with nitrogen can lead to the fluorescence enhancement and shift of emission spectra.28,29 As for sulphur, the other larger atom, it has a more remarkable influence on the shift in energy states of CDs, which may lead to the change of fluorescence characteristics or further increase of PLQY.30–32 Therefore, the PL properties of CDs can be effectively adjusted by doping with nitrogen and sulphur atoms, contributing to expanding their applications in sensing and biomedical fields. Although some strategies have been presented for producing nitrogen and sulphur codoped CDs (N, S-codoped CDs), they generally require harsh synthesis conditions and tedious processes.33,34 Thus, it is still a huge challenge to develop facile, green, scalable and room temperature synthesis strategies for producing N, S-codoped CDs.
Herein, inspired by the developments of the room temperature synthesis of CDs as well as excellent PL properties obtained by nitrogen and sulphur doping, we report a novel route for large scale production of highly PL N, S-codoped CDs at room temperature through a one-step carbon source self-heating strategy, using the sole precursor tetraethylenepentamine (TEPA) simultaneously as the carbon, nitrogen and heat source. This method was based on the self-heating effect of TEPA triggered by the heat initiator sodium persulfate (Na2S2O8). Upon mixing the two reactants, lots of reaction heat derived from the Na2S2O8-triggered oxidation of TEPA would be spontaneously produced at room temperature. Meanwhile, the oxidation, polymerization and carbonization of TEPA as well as the in situ co-doping of sulphur atoms occurred simultaneously, resulting in the rapid spontaneous formation of N, S-codoped CDs within 2 min (Scheme 1). In these processes, TEPA not only acted as the sole carbon and nitrogen source, but also served as the heat source triggered by Na2S2O8, which could rapidly release lots of heat to promote their own spontaneous formation of N, S-codoped CDs. On the other hand, Na2S2O8 not only acted as the heat initiator, but also served as the dopant for in situ co-doping of sulfur, which had significant synergistic effects for the fluorescence enhancement of CDs. Thus, the one-step carbon source self-heating strategy provides a facile, green, ultrafast, scalable and energy-efficient route to prepare highly fluorescent heteroatom-doped CDs without requiring any external energy supply, which would greatly decrease the energy consumption, simplify the synthesis processes, and promote the extensive applications of PL CDs.
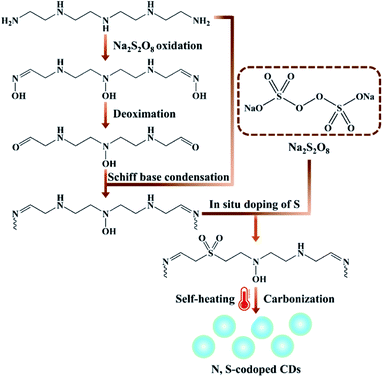 | ||
| Scheme 1 Schematic of the synthetic procedure of N, S-codoped CDs at room temperature through a one-step carbon source self-heating strategy. | ||
To the best of our knowledge, this is the first demonstration for room temperature synthesis of highly fluorescent N, S-codoped CDs without any external energy supply. The preparation, morphology, chemical compositions and fluorescent properties of N, S-codoped CDs were investigated extensively. The as-prepared N, S-codoped CDs exhibited excellent water solubility, high production yield (about 58.0%), high photostability and a high QY up to 26.4% under the optimized synthesis conditions. More intriguingly, the label-free N, S-codoped CDs showed a highly selective and sensitive fluorescence response to Fe3+ ions under the masking effect of EDTA, in an ultra-wide range of 0.2–600 μM, with a detection limit of 0.10 μM. Furthermore, the N, S-codoped CD based fluorescent nanoprobe was successfully utilized for the quantitative detection of Fe3+ in environmental water and human serum samples with satisfactory results, which presented its great potential for sensing and biomedical applications.
Experimental
Materials
H2O2 solution (30 wt%), ethylenediamine-tetraacetic acid disodium salt dihydrate (EDTA), ethylenediamine (EDA), diethylenetriamine (DETA), triethylenetetramine (TETA), tetraethylenepentamine (TEPA), hydrochloric acid and concentrated sulfuric acid were all purchased from KeLong Chemical Reagent Co., Ltd. (Chengdu, China). Pentaethylenehexamine (PEHA) was obtained from Sigma-Aldrich. Sodium persulfate (Na2S2O8), ascorbic acid (AA), sodium citrate (SC), glutathione (GSH), hydroxylamine hydrochloride (HA) and trichloroacetic acid (TCA) were obtained from Adamas Reagent Co., Ltd (Shanghai, China). Quinine sulfate dihydrate (99.0%) was purchased from Aladdin Reagent Co., Ltd (Shanghai, China). 4-(2-Hydroxyethyl)-1-piperazineethanesulfonic acid (HEPES), ferric chloride, sodium chloride (NaCl) and other metal salts were all bought from Huaxia Reagent Co., Ltd (Chengdu, China). The human serum samples were all directly obtained from the Affiliated Hospital of Southwest Medical University, Luzhou, China. The ultrapure water used in the study was purified with an AWL-1002-H (Aquapro International Company LLC., USA) ultrapure water system.Characterization
UV-visible absorption and fluorescence spectra were recorded using a UV-visible spectrophotometer (UV-2600, Shimadzu, Japan) and an LS55 luminescence spectrometer (Perkin-Elmer, USA), respectively. The elemental compositions of N, S-codoped CDs were obtained using an ESCALAB 250Xi X-ray photoelectron spectrometer (XPS, Thermo Electron, USA). Fourier transform infrared (FTIR) spectra were collected using the potassium bromide pellet methodology with an IRAffinity-1S spectrophotometer (Shimadzu, Japan). Transmission electron microscopy (TEM) and high-resolution TEM (HRTEM) images were obtained using a JEOL JEM-1200EX electron microscope operating at 120 kV with an accelerating voltage of 120 kV and an FEI Tecnai G2 F20 S-Twin electron microscope operating at 200 kV, respectively. The further determination of the concentration of Fe3+ in human serum was performed using an Agilent 7500ce inductively coupled plasma mass spectrometry (ICP-MS) system (Agilent Technologies, Japan).Synthesis and purification processes of N, S-codoped CDs
Na2S2O8 (1.0 g) was firstly dissolved in 4.0 mL ultrapure water at room temperature (25.1 °C). Subsequently, 0.5 mL TEPA was added into the Na2S2O8 solution (25%, w/v) in a 50 mL beaker without stirring. The reaction mixture was quickly foamed by the heat in situ released from the Na2S2O8-triggered oxidation of TEPA. Meanwhile, the color of the mixed solution deepened dramatically to brownish-black within 2 min at room temperature, indicating the carbonization of TEPA. The obtained crude product was gradually cooled down to room temperature and extensively dialyzed against ultrapure water through a dialysis tube (molecular weight cut-off of 500–1000, Sangon Biotech Co. Ltd, Shanghai, China) for 48 h and then filtered through a membrane filter (0.22 μm). Finally, the purified solution was lyophilized to obtain the CD powder (Fig. S1†) and re-dispersed in ultrapure water with a concentration of 3 mg mL−1 for further characterization and application. The production yield of N, S-codoped CDs was calculated to be about 58.0% based on the weight of the lyophilized CD powder. The synthetic processes of other CDs using H2O2 as the oxidant or DETA, TETA and PEHA as the carbon, nitrogen and heat sources were similar to those of CDs obtained by the reaction between Na2S2O8 and TEPA, except for the replacement of the corresponding reactants with the desired amounts, respectively.Fluorescence detection of Fe3+
The detection of Fe3+ was carried out in HEPES (10 mM, pH = 7.0) buffer solution. In a typical experiment, standard stock solutions of Fe3+ with different concentrations were firstly prepared by dissolving ferric chloride in ultrapure water. 400 μL Fe3+ solutions of different concentrations were added into a quartz cuvette and mixed with 100 μL of N, S-codoped CD (3 mg mL−1) solution and 400 μL of 25 mM EDTA solution. Subsequently, the solutions were diluted to 4 mL with HEPES buffer. The obtained diluted solutions were mixed uniformly and incubation for 5 min. The fluorescence emission spectra at 450 nm before and after the addition of Fe3+ were recorded under excitation at 370 nm, respectively. All the experiments were performed in triplicate and at room temperature.Detection of Fe3+ in environmental water samples
The application of Fe3+ detection in environmental water samples was conducted using tap, river and lake water as the analytes, which were collected from our laboratory, Tuojiang River and Yanyu Lake (Luzhou, Sichuan, China), respectively. Prior to use, the river and lake water samples were centrifuged at 12![[thin space (1/6-em)]](https://www.rsc.org/images/entities/char_2009.gif) 000 rpm for 20 min and then filtered through a membrane filter (0.22 μm) to remove the insoluble impurities. The tap water sample was pre-heated to eliminate the residual chlorine and then filtered through a membrane filter (0.22 μm). Fe3+ standard solutions with different concentrations were added into the environmental water samples to calculate the recovery of Fe3+ based on the developed sensing method.
000 rpm for 20 min and then filtered through a membrane filter (0.22 μm) to remove the insoluble impurities. The tap water sample was pre-heated to eliminate the residual chlorine and then filtered through a membrane filter (0.22 μm). Fe3+ standard solutions with different concentrations were added into the environmental water samples to calculate the recovery of Fe3+ based on the developed sensing method.
Quantification of Fe3+ in human serum samples
The human serum samples were firstly treated with TCA to release the Fe3+ from proteins. Briefly, equal volumes of 20% (w/v) TCA solution and human serum were mixed uniformly and heated at 90 °C for 15 min. After being cooled to room temperature, the protein precipitate was completely removed by centrifugation. The resulting supernatant was collected and diluted 4 times with HEPES buffer (10 mM, pH = 7.0) for further analysis. Afterwards, aliquots of the as-prepared deproteinized human serum (0, 0.1, 0.2, 0.4, 0.6, 0.8, and 1.0 mL) were first mixed with 100 μL of N, S-codoped CDs (3 mg mL−1) solution and 400 μL of 25 mM EDTA solution, and then diluted to 4 mL with HEPES buffer. The resulting solutions were incubated at room temperature for 5 min and fluorescence emission spectra at 450 nm were recorded. The unknown amount of Fe3+ in human serum was determined using the standard addition method using ferric chloride as a standard. The deproteinized human serum samples were spiked with different concentrations (5, 10, 15, 20, and 25 μM) of Fe3+ and then analysed using the N, S-codoped CD based fluorescent nanoprobe.Results and discussion
Preparation of N, S-codoped CDs
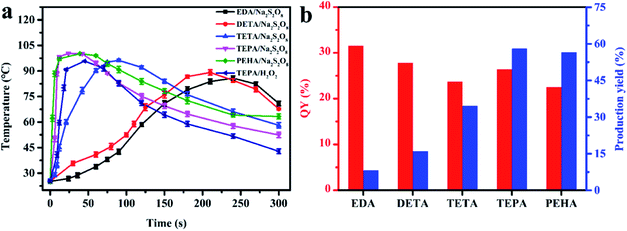
Various aliphatic amine precursors, including EDA, DETA, TETA, TEPA and PEHA, were utilized as the self-heating carbon sources for the spontaneous synthesis of PL N, S-codoped CDs at room temperature in the presence of Na2S2O8. The temperature change of the mixed solutions composed of 0.5 mL of different aliphatic amine precursors and 4.0 mL of Na2S2O8 solutions (25%, w/v) was firstly investigated using a digital thermometer. As shown in Fig. 1a, after Na2S2O8 was mixed with the five aliphatic amine precursors, the significant increase in the temperature of the mixed solutions could be detected immediately. With the increase of the alkyl chain length of the aliphatic amines, the increase in the temperature of the mixed solutions became increasingly obvious because more and more heat was released in situ. Especially, a remarkable increase in the temperature from 25.1 to 100.3 °C within 1 min was observed after mixing Na2S2O8 with TEPA. When using PEHA, the aliphatic amine with a longer alkyl-chain length, for the reaction with Na2S2O8, the variation trend and degree of the temperature were similar to those for TEPA. As a result, the large amount of reaction heat derived from Na2S2O8-triggered oxidation of aliphatic amines, which would be accumulated in certain micro-regions of the self-heated solutions, was found to be a good alternative to the costly external energy supply for ultrafast spontaneous synthesis of N, S-codoped CDs (Movie S1†).Further comparison of the QYs and production yields of the different aliphatic amine-derived CDs obtained under their respective optimum reaction conditions, by which the corresponding maximum QYs could be achieved, is presented in Fig. 1b and Table S1.† It can be found that the N, S-codoped CDs derived from different kinds of aliphatic amines had a slight difference in QY values, which might be due to the similarities of precursor structures and reaction procedures. On the other hand, there was an enormous difference in their production yields. With the increase of the alkyl-chain length, the consumption of aliphatic amines decreased continuously (Table S1†) and the corresponding production yields gradually increased (Fig. 1b). Consequently, the maximum yield (58.0%) could be obtained by using TEPA. Further increasing the alkyl-chain length resulted in a slight decrease of the values of QYs and production yields. Therefore, TEPA was selected for the further studies.
Furthermore, after Na2S2O8 was mixed with several other common organic reductants (including AA, SC, GSH and HA) under the same conditions, only a slight increase in the temperature could be detected (Fig. S2a†) and no PL CDs were formed. Therefore, in the preparation processes of N, S-codoped CDs, the aliphatic amines not only acted as the sole carbon and nitrogen source, but also served as the heat source simultaneously. Once the flammable aliphatic amine precursors were triggered by the combustion-supporting heat initiator Na2S2O8, lots of heat would rapidly release and accumulate in certain micro-regions of the mixed solutions, leading to their own spontaneous rapid formation of N, S-codoped CDs. In addition, the concentration of Na2S2O8 had an obvious impact on the heat release. As illustrated in Fig. S2b,† the increase in the temperature of the Na2S2O8/TEPA solutions became obvious with the increase of Na2S2O8 content up to about 25% (w/v). Further increasing the amount of Na2S2O8 to approximately 30% resulted in a slight increase of the maximum temperature, which might be because the Na2S2O8-triggered oxidation of TEPA had proceeded completely in the presence of excess Na2S2O8. In the subsequent studies, the Na2S2O8 solution with an optimal content of 25% was selected for the synthesis of N, S-codoped CDs.
Characterization of the as-prepared N, S-codoped CDs
The surface morphology of the as-prepared N, S-codoped CDs was characterized by using TEM and HRTEM. As shown in Fig. 2a, the CDs are spheroidal and well separated from each other, and their size distribution ranges from 7 nm to 14 nm with an average diameter of about 10.4 nm. The well-resolved and uniform lattice fringes with an interplanar spacing of 0.25 nm shown in the HRTEM image (Fig. 2b) correspond to the (020) plane of graphite, which indicates that the N, S-codoped CDs have a graphite-like crystalline structure.35 Then, the FTIR measurements were performed to characterize the functional groups present in the N, S-codoped CDs. As shown in Fig. 2c (curve a), TEPA has strong characteristic absorption peaks for the N–H and C–H stretching vibrations at around 3350, 1308, 2940 and 2830 cm−1 as well as those for N–H and C–H bending vibrations at around 1607 and 1460 cm−1, respectively.36,37 After the introduction of Na2S2O8, plenty of TEPA molecules would be oxidized, polymerized, carbonized and eventually transformed into the graphite-like structures of CDs. As a result, the absorption peak related to C–H stretching vibrations was red-shifted to 3010 cm−1, which could have contributed to this series of structural transformations from TEPA to CDs and was consistent with the previously reported peak position (3010–3130 cm−1) of the C–H bond in DTPA derived N-doped carbon dots.38 The new absorption peaks at around 1740, 1650 and 1515 cm−1 were found to appear in the spectrum of CDs (Fig. 2c, curve b), which can be ascribed to the C![[double bond, length as m-dash]](https://www.rsc.org/images/entities/char_e001.gif) O, C
O, C![[double bond, length as m-dash]](https://www.rsc.org/images/entities/char_e001.gif) N and N–H groups, respectively,26,39,40 verifying the oxidation and polymerization of TEPA. Additionally, another new absorption peak could also be observed at around 1120 cm−1, which was associated with the stretching vibrations of the S
N and N–H groups, respectively,26,39,40 verifying the oxidation and polymerization of TEPA. Additionally, another new absorption peak could also be observed at around 1120 cm−1, which was associated with the stretching vibrations of the S![[double bond, length as m-dash]](https://www.rsc.org/images/entities/char_e001.gif) O bond derived from Na2S2O8,41 and indicated the successful doping of sulphur into N, S-codoped CDs.
O bond derived from Na2S2O8,41 and indicated the successful doping of sulphur into N, S-codoped CDs.
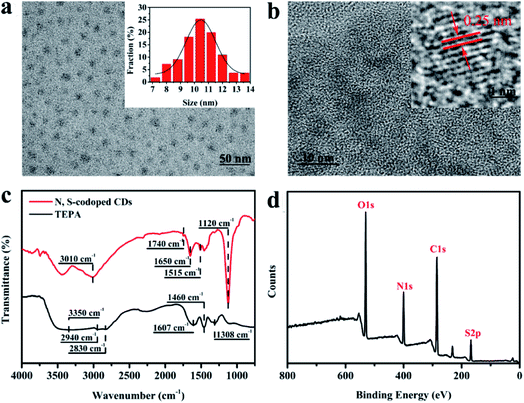 | ||
| Fig. 2 (a) TEM and (b) HRTEM images of the as-prepared N, S-codoped CDs; (c) FTIR spectra of TEPA and the TEPA-derived N, S-codoped CDs; (d) XPS spectrum of the obtained N, S-codoped CDs. | ||
The compositions of the as-synthesized CDs were further analysed using XPS spectra. As shown in Fig. 2d, the XPS full survey spectrum indicates that the obtained CDs are mainly composed of carbon (C), nitrogen (N), oxygen (O) and sulphur (S). The high-resolution C 1s spectrum (Fig. 3a) reveals three peaks with binding energies of 284.6, 286.0 and 287.4 eV, ascribed to C![[double bond, length as m-dash]](https://www.rsc.org/images/entities/char_e001.gif) C/C–C, C–O/C–N and C
C/C–C, C–O/C–N and C![[double bond, length as m-dash]](https://www.rsc.org/images/entities/char_e001.gif) O bonds, respectively.42 Deconvolution of the O 1s peak (Fig. 3b) yields three main peaks with binding energies of 530.9, 532.2 and 533.3 eV, corresponding to C–O, C
O bonds, respectively.42 Deconvolution of the O 1s peak (Fig. 3b) yields three main peaks with binding energies of 530.9, 532.2 and 533.3 eV, corresponding to C–O, C![[double bond, length as m-dash]](https://www.rsc.org/images/entities/char_e001.gif) O and C–OH/C–O–C, respectively.43 The four peaks at 398.4, 398.9, 399.6 and 400.7 eV in the high-resolution N 1s spectrum (Fig. 3c) can be attributed to C
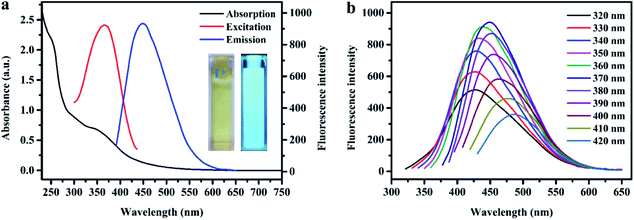
O and C–OH/C–O–C, respectively.43 The four peaks at 398.4, 398.9, 399.6 and 400.7 eV in the high-resolution N 1s spectrum (Fig. 3c) can be attributed to C![[double bond, length as m-dash]](https://www.rsc.org/images/entities/char_e001.gif) N, pyridinic N, pyrrolic N, and graphitic N, respectively.18,44–46 Deconvolution of the S 2p signal (Fig. 3d) yields three main peaks with binding energies of 167.6, 168.8 and 170.0 eV, corresponding to the –C–SOx– (x = 2, 3, 4) species, respectively.47,48 The results of XPS measurements further demonstrate that the as-prepared CDs were not only functionalized by imine, hydroxyl, carboxyl and amino groups but also successfully codoped with N and S atoms. Furthermore, the UV-visible absorption spectrum of the as-prepared N, S-codoped CDs was also measured. As shown in Fig. 4a, the characteristic UV absorption peaks at around 370 nm were observed, which could be attributed to the n–π* transition of the C
N, pyridinic N, pyrrolic N, and graphitic N, respectively.18,44–46 Deconvolution of the S 2p signal (Fig. 3d) yields three main peaks with binding energies of 167.6, 168.8 and 170.0 eV, corresponding to the –C–SOx– (x = 2, 3, 4) species, respectively.47,48 The results of XPS measurements further demonstrate that the as-prepared CDs were not only functionalized by imine, hydroxyl, carboxyl and amino groups but also successfully codoped with N and S atoms. Furthermore, the UV-visible absorption spectrum of the as-prepared N, S-codoped CDs was also measured. As shown in Fig. 4a, the characteristic UV absorption peaks at around 370 nm were observed, which could be attributed to the n–π* transition of the C![[double bond, length as m-dash]](https://www.rsc.org/images/entities/char_e001.gif) N groups,49 corresponding to the findings of FTIR and XPS measurements.
N groups,49 corresponding to the findings of FTIR and XPS measurements.
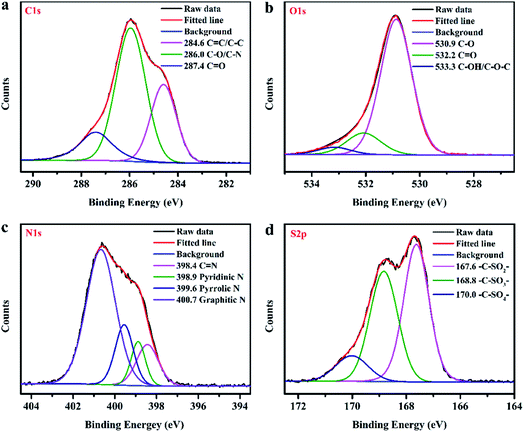 | ||
| Fig. 3 The high-resolution C 1s (a), O 1s (b), N 1s (c), and S 2p (d) XPS spectra of the as-prepared TEPA-derived N, S-codoped CDs. | ||
From all the above characterization results, it can be confirmed that the formation mechanisms of N, S-codoped CDs are probably related to the multi-step reaction processes, including TEPA oxidation, Schiff base condensation, in situ doping of sulphur and carbonization (Scheme 1). Initially, in the presence of a high concentration of Na2S2O8, many amino groups of TEPA molecules are easily oxidized and converted to oxime and carbonyl groups. Subsequently, Schiff base condensation reaction of the oxidation products of TEPA ensues with the unreacted precursors. Eventually, the condensation products undergo rapid polymerization, N/S doping and carbonization processes promoted by the large amounts of released heat, resulting in the ultrafast spontaneous formation of N, S-codoped CDs with a graphite-like crystalline structure.
Synergistic effect of sulfur doping
In order to clarify the effects of sulfur doping on the fluorescent properties of N, S-codoped CDs, TEPA-derived nitrogen-doped carbon dots (N-CDs) were also synthesized using H2O2 as the oxidant and the synthetic routes and temperature variations were similar to those obtained by the reaction between Na2S2O8 and TEPA (Fig. 1a). The QY of the N-CDs obtained under the optimal conditions is calculated to be 8.6%, which is far below that of N, S-codoped CDs, demonstrating the synergistic effect of sulfur doping on the fluorescence enhancement of CDs. The typical TEM image of N-CDs shown in Fig. S3a† indicates that the CDs are well dispersed and their average diameter is about 12.1 nm, which is only slightly larger than that of N, S-codoped CDs, indicating that the possible quantum effects can be ignored in comparison. Afterwards, the UV-visible absorption spectrum of N-CDs was measured. As shown in Fig. S3b,† the characteristic UV absorption peaks of the N-CDs blueshift from 370 nm to 340 nm. Moreover, compared to N, S-codoped CDs, the absorbance strength of N-CDs obviously decreased, suggesting the much lower content of C![[double bond, length as m-dash]](https://www.rsc.org/images/entities/char_e001.gif) N groups in N-CDs.
N groups in N-CDs.
The surface functional groups of N-CDs were also characterized by XPS analysis (Fig. S4a†). The high-resolution C 1s spectrum (Fig. S4b†) reveals four peaks with binding energies of 284.5, 285.7, 287.5 and 289.9 eV, ascribed to C![[double bond, length as m-dash]](https://www.rsc.org/images/entities/char_e001.gif) C/C–C, C–O/C–N, C
C/C–C, C–O/C–N, C![[double bond, length as m-dash]](https://www.rsc.org/images/entities/char_e001.gif) O and COOH bonds, respectively. Deconvolution of the N 1s peak (Fig. S4c†) yields four main peaks with binding energies of 398.3, 398.8, 399.6 and 401.2 eV, corresponding to C
O and COOH bonds, respectively. Deconvolution of the N 1s peak (Fig. S4c†) yields four main peaks with binding energies of 398.3, 398.8, 399.6 and 401.2 eV, corresponding to C![[double bond, length as m-dash]](https://www.rsc.org/images/entities/char_e001.gif) N, pyridinic N, pyrrolic N, and graphitic N, respectively. Compared with N, S-codoped CDs, the percentage of carbonyl/carboxyl groups of N-CDs dramatically increased from 15.16% to 31.14% (Table S2†), and the content of C
N, pyridinic N, pyrrolic N, and graphitic N, respectively. Compared with N, S-codoped CDs, the percentage of carbonyl/carboxyl groups of N-CDs dramatically increased from 15.16% to 31.14% (Table S2†), and the content of C![[double bond, length as m-dash]](https://www.rsc.org/images/entities/char_e001.gif) N bonds existing in N-CDs greatly decreased from 13.69% to 7.57% (Table S3†), corresponding to the findings of UV-visible spectral analysis. These results indicate that the sulfur atom doping can lead to the content redistribution of the functional groups in CDs. Previous studies have indicated that the C
N bonds existing in N-CDs greatly decreased from 13.69% to 7.57% (Table S3†), corresponding to the findings of UV-visible spectral analysis. These results indicate that the sulfur atom doping can lead to the content redistribution of the functional groups in CDs. Previous studies have indicated that the C![[double bond, length as m-dash]](https://www.rsc.org/images/entities/char_e001.gif) N functional groups are one of the important fluorescence-emitting moieties and play a significant role in the strong fluorescence properties of CDs.47,49 In contrast, the electron-accepting carboxyl and carbonyl moieties act as fluorescence quenchers and induce non-radiative recombination processes.42 Besides, the calculations based on density functional theory also revealed that the improvement of the fluorescence performances of N, S-codoped CDs was caused by the redistribution of spin processes.50 Taken together, the potential mechanism of fluorescence enhancement after the doping of sulfur atoms can be attributed to the redistribution of spin and charge densities of CDs, which can lead to an increase in the content of fluorescence-emitting moieties (i.e. C
N functional groups are one of the important fluorescence-emitting moieties and play a significant role in the strong fluorescence properties of CDs.47,49 In contrast, the electron-accepting carboxyl and carbonyl moieties act as fluorescence quenchers and induce non-radiative recombination processes.42 Besides, the calculations based on density functional theory also revealed that the improvement of the fluorescence performances of N, S-codoped CDs was caused by the redistribution of spin processes.50 Taken together, the potential mechanism of fluorescence enhancement after the doping of sulfur atoms can be attributed to the redistribution of spin and charge densities of CDs, which can lead to an increase in the content of fluorescence-emitting moieties (i.e. C![[double bond, length as m-dash]](https://www.rsc.org/images/entities/char_e001.gif) N functional groups) in CDs and contribute to the inhibition of the non-radiative recombination quenching effect caused by carboxyl and carbonyl moieties.
N functional groups) in CDs and contribute to the inhibition of the non-radiative recombination quenching effect caused by carboxyl and carbonyl moieties.
Fluorescence properties and photostability of N, S-codoped CDs
The light-yellow N, S-codoped CD aqueous solution emits a bright blue fluorescence under a UV lamp (365 nm) (the inset of Fig. 4a). The fluorescence properties of N, S-codoped CDs were investigated by fluorescence spectroscopy. As shown in Fig. 4b, the N, S-codoped CDs exhibited an excitation-dependent fluorescence behavior. With increasing excitation wavelength from 320 to 420 nm, the maximum emission wavelengths of the N, S-codoped CDs are gradually red-shifted. The maximum excitation and emission wavelengths of N, S-codoped CDs are 370 and 450 nm (Fig. 4a). Such excitation-dependent emission character can be attributed to the different sizes (quantum effect) and heterogeneous surface states of N, S-codoped CDs.51Prior to investigating the application prospects of N, S-codoped CDs, it is necessary to first study their photostability toward various operation environments, such as high ionic strength and extreme pH. As depicted in Fig. S5a,† the fluorescence intensity of N, S-codoped CDs excited at 370 nm scarcely exhibits obvious changes from pH 3 to 12, indicating that the obtained CDs can be utilized in a wide range of pH. Furthermore, with the concentration of NaCl (0–400 mM) increased, the fluorescence intensity of N, S-codoped CDs remained almost unchanged (Fig. S5b†), demonstrating their excellent resistance to high ionic strength. The photostability of N, S-codoped CDs was also studied through continuously exposing the CD suspension to a 20 kW xenon lamp for 120 min, and the fluorescence intensity did not significantly change (Fig. S5c†). Meanwhile, after storage for two months at room temperature, there was no significant change in the fluorescence intensity of N, S-codoped CDs. Therefore, it was confirmed that the obtained N, S-codoped CDs have enormous potential in the field of sensing under physiological conditions.
Fluorescence response of N, S-codoped CDs to Fe3+
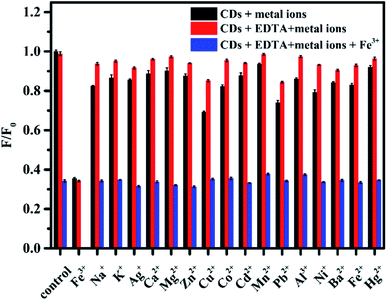
Based on the coordination interaction between metal ions and the functional groups on the CDs (e.g. hydroxyl and amino groups) and inspired by previous studies on the fluorescence quenching effect of metal ions on PL CDs,1,33 we speculate that the as-prepared N, S-codoped CDs may also exhibit a sensitive response to metal ions. To test the selectivity for the detection of metal ions in the current sensing system, the representative metal ions, including Na+, K+, Mg2+, Ca2+, Mn2+, Fe3+, Fe2+, Co2+, Ni2+, Cd2+, Pb2+, Ba2+, Cu2+, Zn2+, Al3+, Ag+ and Hg2+, were respectively added to the solutions of N, S-codoped CDs, and the changes in the fluorescence intensity were recorded. As shown in Fig. 5, besides Fe3+, several other metal ions could also quench the fluorescence of N, S-codoped CDs to a certain extent. By contrast, when N, S-codoped CDs coexisted with EDTA, the fluorescence intensity ratios (F/F0) in the presence and absence of different metal ions were remarkably increased to values approaching those of the control group, except that of Fe3+. Therefore, the as-prepared N, S-codoped CDs exhibited a highly selective fluorescence response to Fe3+ under the masking effect of EDTA. The excellent selectivity could be attributed to the strong binding preference of Fe3+ ions toward the functional groups on the surface of the N, S-codoped CDs, while the other metal ions were chelated by EDTA.52 In consideration of the possible cross reactivity, the selectivity of the presented nanoprobe coexisting with the possible interfering ions was investigated. As shown by the blue bar of Fig. 5, the coexistence of other metal ions does not induce a significant change in the fluorescence quenching effect of Fe3+ ions, confirming the good anti-interference capability of the proposed nanoprobe for detecting Fe3+.To obtain the best sensing performance for the detection of Fe3+, the fluorescence intensity ratios of N, S-codoped CDs in the presence and absence of Fe3+ at different pH values were further investigated. As shown in Fig. S6,† the as-prepared CDs exhibited a good response to Fe3+ ions over a broad pH range of 3–12, which contributed to extending their applicability in extreme pH environments. Specifically, the fluorescence intensity ratios gradually decreased with the increase of pH value up to 7.0, followed by a slight increasing trend for further increase in the pH value. Enhanced protonation of CDs and stronger interaction of Fe3+ with OH− might be the reasons for the decreased fluorescence responses of N, S-codoped CDs to Fe3+ at low and high pH values, respectively. Therefore, the HEPES buffer at pH 7.0 was selected for further studies.
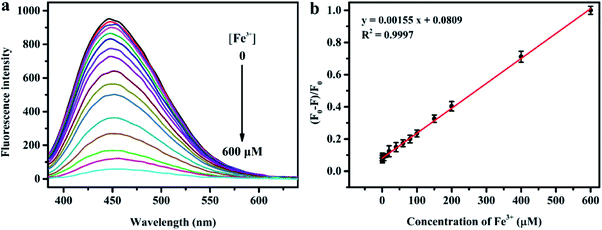
Fig. 6a depicts the change in the fluorescence intensity of N, S-codoped CDs in the presence of EDTA (2.5 mM) and an increased concentration of Fe3+. It can be seen that the fluorescence of N, S-codoped CDs gradually decreased as the concentration of Fe3+ increased from 0 to 600 μM. Moreover, as shown in Fig. 6b, the fluorescence quenching efficiency ((F0 − F)/F0) has a good linear relationship (R2 = 0.9997) versus the concentration of Fe3+ in an ultra-wide range of 0.2–600 μM. The detection limit of Fe3+ was calculated to be 0.10 μM according to the 3σ/slope rule (σ is the standard deviation of the blank signal), which was much lower than the limit of Fe3+ (about 5.4 μM) in drinking water prescribed by the US Environmental Protection Agency. As listed in Table S4,† the presented method has better sensitivity and a much wider linear range for the detection of Fe3+ compared with the previously reported PL CD-based nanosensors and other fluorescent nanoprobes.42,52–60 Therefore, the as-synthesized N, S-codoped CDs have great potential for the detection of Fe3+ in real samples.
Possible quenching mechanism of Fe3+ to N, S-codoped CDs
To reveal the fluorescence quenching mechanism of N, S-codoped CDs by Fe3+, the quenching constant KSV was calculated based on the Stern–Volmer equation: F0/F = 1 + KSV[Fe3+], where F0 and F are the fluorescence intensities before and after the addition of Fe3+, respectively. As shown in Fig. S7a,† a good linear relationship between F0/F and Fe3+ concentration was observed over the range of 0.2–600 μM with a correlation coefficient (R2) of 0.9996 and the value of KSV was calculated to be 1.77 × 10³ M−1. Then, time resolved fluorescence decay analysis was further performed by the time-dependent single photon counting (TCSPC) method to better understand the quenching process. As illustrated in Fig. S7b,† the average fluorescence lifetime of N, S-codoped CDs was 3.39 ns, suggesting a fast electron-transfer process. After the addition of Fe3+, the lifetime decreased to 2.21 ns, indicating that a dynamic quenching process occurred in the Fe3+/CD sensing system.58 The quenching rate (kq) was further calculated to be 5.22 × 10¹¹ M−1 s−1 according to the equation KSV = kqτ0, where τ0 = 3.39 ns. The value of Kq is higher than the typical diffusion-controlled quenching rate of 1010 M−1 s−1,59 further confirming the fast electron-transfer process. From all the above results, we propose that when Fe3+ ions are added into the solution of N, S-codoped CDs in the presence of EDTA, they can selectively coordinate with the hydroxyl and amino groups on the surfaces of N, S-codoped CDs, and the excited electrons of N, S-codoped CDs can rapidly transfer from the excited state to the half-filled 3d orbitals of Fe3+ ions, facilitating the non-radiative electron transfer process and resulting in fluorescence quenching.Quantitative detection of Fe3+ in environmental water and human serum samples
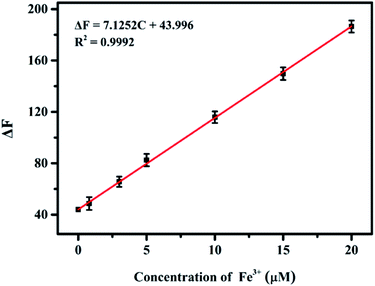
The practicability of the proposed sensing system was verified through the detection of Fe3+ in environmental water and human serum samples. The samples of tap, river and lake water were spiked with different concentrations (5, 15, and 25 μM) of Fe3+. The results listed in Table S5† showed that the recoveries ranged from 94.1 to 107.9%, and the relative standard deviation was lower than 6.51%, indicating the high accuracy of the sensing system. Besides, quantitative determination of Fe3+ in human serum samples based on the nanoprobe was performed. As illustrated in Fig. S8,† with the increase of the amount of human serum sample, the fluorescence intensity gradually decreased and the corresponding fluorescence quenching values ΔF (ΔF = F0 − F) had a good linear correlation with the sample volume, confirming that the presented method could be used in the quantitative analysis of Fe3+ in human serum samples. The unknown amount of Fe3+ in human serum was measured using the standard addition method with ferric chloride as the standard (Fig. 7) and the concentration of Fe3+ in a selected serum was found to be 24.8 ± 0.6 μM, which was in good accord with the result (25.6 ± 0.5 μM) obtained by ICP-MS. Thus, these above results demonstrate that the presented nanoprobe has great practicability for sensing of Fe3+ ions.Conclusions
In summary, a room temperature, green, ultrafast and energy-efficient route for large scale synthesis of highly PL N, S-codoped CDs has been successfully developed. Compared with previously reported synthesis routes of PL CDs, the present carbon source self-heating strategy is more concise, energy-efficient and environmentally friendly. The use of this method not only allows us to bypass the costly external energy supply, but also to easily tune the fluorescence properties of PL CDs by controlling the reaction conditions of heteroatom doping. The as-prepared N, S-codoped CDs exhibited excellent photostability and high QY, as well as a highly selective and sensitive fluorescence response to Fe3+ in an ultra-wide range of 0.2–600 μM, with a detection limit of 0.10 μM. Furthermore, the fluorescent nanoprobe was successfully applied for the quantitative detection of Fe3+ in environmental water and human serum samples with satisfactory results. The present study not only paves a new effective way for the green synthesis of PL CDs, but also shows its great application prospects in the field of sensing and biomedical applications.Conflicts of interest
There are no conflicts to declare.Acknowledgements
This work was supported by the National Natural Science Foundation of China (Grant No. 21804113), the Science and Technology Strategic Cooperation Project of Luzhou Municipal People's Government and Southwest Medical University (Grant No. 2019LZXNYDC03), the Talent Introduction Project of Southwest Medical University (Grant No. 090300040005) and the Science and Technology Transformation Project of Southwest Medical University (Grant No. 2018001).Notes and references
- F. Du, G. Li, X. Gong, G. Zhonghui, S. Shuang, M. Xian and C. Dong, Sens. Actuators, B, 2018, 277, 492–501 CrossRef CAS.
- M. L. Liu, B. B. Chen, C. M. Li and C. Z. Huang, Green Chem., 2019, 21, 449–471 RSC.
- H. Huang, J.-J. Lv, D.-L. Zhou, N. Bao, Y. Xu, A.-J. Wang and J.-J. Feng, RSC Adv., 2013, 3, 21691–21696 RSC.
- J.-R. Macairan, D. B. Jaunky, A. Piekny and R. Naccache, Nanoscale Adv., 2019, 1, 105–113 RSC.
- Z. Gao, X. Li, L. Shi and Y. Yang, Spectrochim. Acta, Part A, 2019, 220, 117080 CrossRef CAS PubMed.
- R. M. Shereema, V. Sankar, K. G. Raghu, T. P. Rao and S. S. Shankar, Electrochim. Acta, 2015, 182, 588–595 CrossRef CAS.
- X. Wei, L. Li, J. Liu, L. Yu, H. Li, F. Cheng, X. Yi, J. He and B. Li, ACS Appl. Mater. Interfaces, 2019, 11, 9832–9840 CrossRef CAS PubMed.
- H. Li, F.-Q. Shao, S.-Y. Zou, Q.-J. Yang, H. Huang, J.-J. Feng and A.-J. Wang, Microchim. Acta, 2016, 183, 821–826 CrossRef CAS.
- M. Amjad, M. Igbal, A. Faisal, A. M. Junjua, I. Hussain, S. Z. Hussain, F. A. Ghramh, K. A. Khan and H. A. Janjua, Nanoscale Adv., 2019, 1, 2924–2936 RSC.
- M. Zheng, S. Liu, J. Li, D. Qu, H. Zhao, X. Guan, X. Hu, Z. Xie, X. Jing and Z. Sun, Adv. Mater., 2014, 26, 3554–3560 CrossRef CAS PubMed.
- S. Y. Lim, W. Shen and Z. Gao, Chem. Soc. Rev., 2015, 44, 362–381 RSC.
- C.-I. Wang, W.-C. Wu, A. P. Periasamy and H.-T. Chang, Green Chem., 2014, 16, 2509–2514 RSC.
- Y.-S. Lin, Y. Lin, A. P. Periasamy, J. Cang and H.-T. Chang, Nanoscale Adv., 2019, 1, 2553–2561 RSC.
- H. Xu, L. Yan, V. Nguyen, Y. Yu and Y. Xu, Appl. Surf. Sci., 2017, 414, 238–243 CrossRef CAS.
- X. Miao, D. Qu, D. Yang, B. Nie, Y. Zhao, H. Fan and Z. Sun, Adv. Mater., 2018, 30, 1704740 CrossRef PubMed.
- J. Wang, C.-F. Wang and S. Chen, Angew. Chem., Int. Ed., 2012, 51, 9297–9301 CrossRef CAS PubMed.
- M. Si, J. Zhang, Y. He, Z. Yang, X. Yan, M. Liu, S. Zhuo, S. Wang, X. Min, C. Gao, L. Chai and Y. Shi, Green Chem., 2018, 20, 3414–3419 RSC.
- Y. Bi, H. Zhou, H. Jia and P. Wei, RSC Adv., 2017, 7, 12283–12291 RSC.
- M. Zhang, L. Hu, H. Wang, Y. Song, Y. Liu, H. Li, M. Shao, H. Huang and Z. Kang, Nanoscale, 2018, 10, 12734–12742 RSC.
- Z. Lin, M. Li, S. Lv, K. Zhang, M. Lu and D. Tang, J. Mater. Chem. B, 2017, 5, 8506–8513 RSC.
- J. Zhang, X. Liu, J. Zhou, X. Huang, D. Xie, J. Ni and C. Ni, Nanoscale Adv., 2019, 1, 2151–2156 RSC.
- S. Mitra, S. Chandra, S. H. Pathan, N. Sikdar, P. Pramanik and A. Goswami, RSC Adv., 2013, 3, 3189–3193 RSC.
- Y. Li, X. Zhong, A. E. Rider, S. A. Furman and K. Ostrikov, Green Chem., 2014, 16, 2566–2570 RSC.
- D. Sun, R. Ban, P.-H. Zhang, G.-H. Wu, J.-R. Zhang and J.-J. Zhu, Carbon, 2013, 64, 424–434 CrossRef CAS.
- Y. Hu, J. Yang, J. Tian, L. Jia and J.-S. Yu, Carbon, 2014, 77, 775–782 CrossRef CAS.
- B. B. Chen, Z. X. Liu, W. C. Deng, L. Zhan, M. L. Liu and C. Z. Huang, Green Chem., 2016, 18, 5127–5132 RSC.
- B. B. Chen, R. S. Li, M. L. Liu, H. Z. Zhang and C. Z. Huang, Chem. Commun., 2017, 53, 4958–4961 RSC.
- Z. L. Wu, M. X. Gao, T. T. Wang, X. Y. Wan, L. L. Zheng and C. Z. Huang, Nanoscale, 2014, 6, 3868–3874 RSC.
- Y. H. Yuan, Z. X. Liu, R. S. Li, H. Y. Zou, M. Lin, H. Liu and C. Z. Huang, Nanoscale, 2016, 8, 6770–6776 RSC.
- Y. Yuli, Y. Liang, Z. Zhaohui and W. Jing, Talanta, 2015, 144, 671 CrossRef PubMed.
- H.-X. Wang, J. Xiao, Z. Yang, H. Tang, Z.-T. Zhu, M. Zhao, Y. Liu, C. Zhang and H.-L. Zhang, J. Mater. Chem. A, 2015, 3, 11287–11293 RSC.
- W. Wang, Y.-C. Lu, H. Huang, A.-J. Wang, J.-R. Chen and J.-J. Feng, Sens. Actuators, B, 2014, 202, 741–747 CrossRef CAS.
- Y. Chen, Y. Wu, B. Weng, B. Wang and C. Li, Sens. Actuators, B, 2016, 223, 689–696 CrossRef CAS.
- Y. Wang, L. Yan, G. Ji, C. Wang, H. Gu, Q. Luo, Q. Chen, L. Chen, Y. Yang, C.-Q. Ma and X. Liu, ACS Appl. Mater. Interfaces, 2019, 11, 2243–2253 CrossRef CAS PubMed.
- M. L. Liu, L. Yang, R. S. Li, B. B. Chen, H. Liu and C. Z. Huang, Green Chem., 2017, 19, 3611–3617 RSC.
- X. Wang, H. Li, H. Liu and X. Hou, Microporous Mesoporous Mater., 2011, 142, 564–569 CrossRef CAS.
- M. Gurung, B. B. Adhikari, S. Alam, H. Kawakita, K. Ohto and K. Inoue, Chem. Eng. J., 2013, 228, 405–414 CrossRef CAS.
- X. Pang, Y. Zhang, J. Pan, Y. Zhao, Y. Chen, X. Ren, H. Ma, Q. Wei and B. Du, Biosens. Bioelectron., 2016, 77, 330–338 CrossRef CAS PubMed.
- M. Sieger, G. Kos, M. Sulyok, M. Godejohann, R. Krska and B. Mizaikoff, Sci. Rep., 2017, 7, 44028 CrossRef PubMed.
- W. Wang, Y.-C. Lu, H. Huang, A.-J. Wang, J.-R. Chen and J.-J. Feng, Biosens. Bioelectron., 2015, 64, 517–522 CrossRef CAS PubMed.
- C. Yao, S. Zhao, Y. Wang, B. Wang, M. Wei and M. Hu, Polym. Degrad. Stab., 2013, 98, 1724–1730 CrossRef CAS.
- H. Yin, K. Zhang, L. Wang, K. Zhou, J. Zeng, D. Gao, Z. Xia and Q. Fu, Nanoscale, 2018, 10, 18064–18073 RSC.
- M. Moniruzzaman and J. Kim, Sens. Actuators, B, 2019, 295, 12–21 CrossRef CAS.
- W. Zhang, X. Li, R. Zou, H. Wu, H. Shi, S. Yu and Y. Liu, Sci. Rep., 2015, 5, 11129 CrossRef PubMed.
- Y. Chen, S. Zhao and Z. Liu, Phys. Chem. Chem. Phys., 2015, 17, 14012–14020 RSC.
- T. Yang, J. Liu, R. Zhou, Z. Chen, H. Xu, S. Z. Qiao and M. J. Monteiro, J. Mater. Chem. A, 2014, 2, 18139–18146 RSC.
- H. Ding, J.-S. Wei and H.-M. Xiong, Nanoscale, 2014, 6, 13817–13823 RSC.
- H. Wang and C. You, Chem. Eng. J., 2016, 292, 199–206 CrossRef CAS.
- S. G. Liu, N. Li, Y. Ling, B. H. Kang, S. Geng, N. B. Li and H. Q. Luo, Langmuir, 2016, 32, 1881–1889 CrossRef CAS PubMed.
- J. Liang, Y. Jiao, M. Jaroniec and S. Z. Qiao, Angew. Chem., Int. Ed., 2012, 51, 11496–11500 CrossRef CAS PubMed.
- R. Atchudan, T. N. J. I. Edison, D. Chakradhar, S. Perumal, J.-J. Shim and Y. R. Lee, Sens. Actuators, B, 2017, 246, 497–509 CrossRef CAS.
- J. Shangguan, J. Huang, D. He, X. He, K. Wang, R. Ye, X. Yang, T. Qing and J. Tang, Anal. Chem., 2017, 89, 7477–7484 CrossRef CAS PubMed.
- K. Kaur, S. Chaudhary, S. Singh and S. K. Mehta, Sens. Actuators, B, 2016, 232, 396–401 CrossRef CAS.
- S. Hu, S. Zhang, C. Gao, C. Xu and Q. Gao, Spectrochim. Acta, Part A, 2013, 113, 325–331 CrossRef CAS PubMed.
- Z. F. Gao, T. T. Li, X. L. Xu, Y. Y. Liu, H. Q. Luo and N. B. Li, Biosens. Bioelectron., 2016, 83, 134–141 CrossRef CAS PubMed.
- S. Zhu, Q. Meng, L. Wang, J. Zhang, Y. Song, H. Jin, K. Zhang, H. Sun, H. Wang and B. Yang, Angew. Chem., Int. Ed., 2013, 52, 3953–3957 CrossRef CAS PubMed.
- K. Qu, J. Wang, J. Ren and X. Qu, Chem.–Eur. J., 2013, 19, 7243–7249 CrossRef CAS PubMed.
- Y. Song, C. Zhu, J. Song, H. Li, D. Du and Y. Lin, ACS Appl. Mater. Interfaces, 2017, 9, 7399–7405 CrossRef CAS PubMed.
- Y. Song, S. Zhu, S. Xiang, X. Zhao, J. Zhang, H. Zhang, Y. Fu and B. Yang, Nanoscale, 2014, 6, 4676–4682 RSC.
- H. Qi, M. Teng, M. Liu, S. Liu, J. Li, H. Yu, C. Teng, Z. Huang, H. Liu, Q. Shao, A. Umar, T. Ding, Q. Gao and Z. Guo, J. Colloid Interface Sci., 2019, 539, 332–341 CrossRef CAS PubMed.
Footnotes |
| † Electronic supplementary information (ESI) available. See DOI: 10.1039/c9na00806c |
| ‡ These authors contributed equally. |
| This journal is © The Royal Society of Chemistry 2020 |

