
Rapid and sensitive glycan targeting by lectin-SERS assay†
Nicole M.
Cordina
 a,
Wei
Zhang
ab,
Nicolle H.
Packer
*ab and
Yuling
Wang
ab
a,
Wei
Zhang
ab,
Nicolle H.
Packer
*ab and
Yuling
Wang
ab
aDepartment of Molecular Sciences, Macquarie University, NSW, Australia. E-mail: yuling.wang@mq.edu.au; nicki.packer@mq.edu.au
bARC Centre of Excellence for Nanoscale BioPhotonics, Macquarie University, NSW, Australia
First published on 20th May 2020
Abstract
Glycosylation is an important part of cell signalling that is implicated in many disease states in which glycans play an essential role. Therefore rapid and sensitive differentiation of glycans on proteins is highly desirable. Current technologies for glycan structural analysis normally involve the isolation of glycans from proteins, or enrichment of glycopeptides, and detection by mass spectrometry, which requires relatively large amounts of sample and is not able to be used by non-specialist laboratories. Herein we present a simple and new strategy for targeting the glycans on a protein (with IgG as a model glycoprotein) using surface-enhanced Raman scattering (SERS) coupled to glycan-binding WGA (wheat germ agglutinin) lectin, in a lectin-SERS assay. With one drop (1 μL) of glycoprotein solution, our lectin-SERS assay can detect as low as 10 ng IgG within two hours with high glycan specificity. We extend our technique to examine the surface glycan profiles on two human colorectal cancer cell lines, which show different and unique glycan signatures specific to the target cell lines. Thus, we believe that this method could be potentially used for the real-time and in situ monitoring of glycans on the surface of cells or tissue or in body fluids, and is thus a powerful tool for glycomics research.
Introduction
Glycosylation of proteins on cells is a highly important post-translational modification used for cell signalling and regulation. Changes in glycosylation are implicated in important physiological responses and disease states, including cancer.1 Current approaches for analysis of glycosylation include liquid chromatography and tandem mass spectrometry (LC-MS/MS),2,3 lectin microarrays4–6 and immunocapture techniques.7 While LC-MS/MS is effective for analysis of glycosylation of proteins and cellular fractions, a significant amount of cellular extraction and purification strategies are required for the identification of cell-surface glycans.Lectin (specific sugar-binding protein) microarrays have been developed for the sensitive screening of glycans. Lectin microarrays involve immobilizing a lectin or carbohydrate-binding protein on a chip to capture the target sample, followed by the reading of the fluorescent signal of labelled reagent on each spot, such as with fluorescently labelled antibodies.4–6 This approach enables the high-throughput detection of glycans, without liberation of glycans, which is the major advantage of the lectin array approach. However, lectin microarrays typically suffer from labour-intensive and cumulative procedures such as incubation, blocking, washing, etc.8 Therefore, it would be highly advantageous to develop a rapid and sensitive strategy for glycan recognition in situ.
Gold nanoparticles (AuNPs) have been extensively studied for assay applications due to the sensitivity of their surface plasmon absorption band to the size, aspect ratio, and composition of the particles, and the refractive index of their immediate environment.9 By taking the optical properties of AuNPs, a simple glycosylation assay has been reported for the detection of the binding of high mannose glycoprotein RNase B to the concanavalin A lectin, which is based on AuNP aggregates induced by lectin binding to sugar groups present on the glycoprotein, thus forming a cross-linked AuNP aggregate.10 With this approach, a detection limit for RNase B of 20 μg mL−1 was achieved.6 Although this approach provides a visible and simple mechanism for glycan analysis of oligomannose containing glycoproteins, the sensitivity and quantification of glycans was limited. Additionally, Bertok and coworkers built an electrochemical biosensor based on lectin recognition to detect glycoproteins. The detection limit of glycoprotein was achieved down to 1 aM level with the application of a HS–(CH2)11–NH2 linker and 20 nm AuNPs.11 However, this approach suffers from reliability issues due to the complexity of the procedure and difficulties associated with surface control, such as the electrode cleaning, desorption, polishing, oxidation of the glycan and preparation of the bioreceptive surface on AuNP modified polycrystalline gold electrodes.
Surface-enhanced Raman scattering (SERS) is a physical phenomenon that can enhance the Raman scattering of molecules on the plasmonic surface by a million-fold or even higher.12–17 Since the first discovery of SERS in the 1970s18–20 and the first report of single molecule detection by SERS,21 the method has developed rapidly with the advancement of nanotechnology. SERS nanotags have become a new class of labels and have attracted significant attention for low abundant analyte detection.18–21 Compared to the fluorescent probes/dyes, SERS nanotags have shown the unique advantages in (i) high photostability; (ii) high sensitivity; and (iii) single laser excitation for multiple probes,22–28 as well as the tuneable properties of nanoparticles.29 Typically, SERS nanotags are composed of plasmonic nanoparticles, e.g. AuNPs as the core, small organic molecules as Raman reporters (to indicate the signal from the nanotags), and the affinity-binding ligands for the target molecules.22–28 By combining the SERS nanotags with different sensor platform/assays, various biomarkers for cancers (such as breast cancer, prostate cancer and melanoma) have been tested and detected.22,27,30 However, to the best of our knowledge, there is no report on SERS nanotags functionalized with lectins for glycan analysis of glycosylated protein biomarkers.
Therefore, to take all of the advantages of SERS nanotags for biomarker detection, we propose a new approach for the rapid and sensitive profiling of glycans on proteins by using SERS nanotags conjugated to lectins, and a dot-blot assay (named lectin-SERS assay), which only requires 10 μg in one drop (1 μL) of the glycoproteins. As a proof-of-concept study we used immunoglobulin G (IgG) as a model glycoprotein carrying a low level of glycan target (two sites of glycosylation on the intact antibody) which is recognised by wheat germ agglutinin (WGA). The detection can be achieved within 2 hours, with a detection limit of 10 ng. We further apply our strategy for the glycan profiling of cells, comparing two human colorectal cell lines. Our assay demonstrates that different cell lines, even from the same cancer type, present unique surface glycan signatures. Therefore, this approach provides a powerful and promising tool for glycan profiling in glycomics analysis.31
Experimental
Materials and methods
A 1 mg mL−1 solution of DTSSP was prepared in 5 mM sodium citrate buffer, pH 5.3. Lectin solutions of WGA (100 μg mL−1), were prepared in phosphate buffered saline (PBS), pH 7.4 and 60 μL of each solution was added drop-wise to 60 μL of the DTSSP solutions. The lectin reaction mixtures were incubated at RT for 40 min, with 300 rpm shaking. 20 μL of the lectin–DTSSP solutions were then added to 1 mL of resuspended AuNPs, along with 10 μL of 1 mM MBA Raman reporter. The reaction mixtures were incubated at RT for 40 min (300 rpm shaking). The reaction mixture was stored at 4 °C for further study. The other three lectin-SERS nanotags were prepared following the same procedure but with different Raman reporter molecules (DTNB, TFMBA and MMC) on specific lectins (CTB, PHA-L and AAL) respectively.
Immediately prior to use in a binding experiment, the lectin-functionalised AuNPs were collected by centrifugation (2400g, 8 min) and resuspended in 0.1% (w/v) BSA. After 2 hours of incubation at RT with 300 rpm shaking, the functionalized AuNPs were collected by centrifugation and then resuspended in 10% PBS (v/v).
Cell surface labelling by lectin-SERS nanotags
SW480 and COLO205 cells were cultured in RPMI 1640 complete medium, supplemented with 10% (w/v) fetal bovine serum and 1% (w/v) penicillin–streptomycin. Confluent cells were detached from culture flasks by gentle scraping and collected by centrifugation at 300g. Cells were resuspended in PBS and then 1000 cells of each type were transferred to low-binding Eppendorf microcentrifuge tubes.Lectin-SERS nanotags were blocked with 0.1% (w/v) BSA for 2 h. The nanotags were then collected by centrifugation and resuspended in PBS to 5× the initial concentration. 40 μL of each lectin-SERS nanotag was then added to each type of cell. After 30 min of incubation at 37 °C with shaking at 300 rpm, the cells were collected by centrifugation at 400g for 1 min. The supernatant, containing unbound nanotags, was removed. Cells were washed with 500 μL of PBS three times, then cells were re-dispersed in 60 μL PBS before examination using the Raman microscope.
The morphology and size of AuNPs were characterized by Transmission Electron Microscope (TEM, Philips CM10). The UV-Vis absorption spectra of AuNPs and SERS nanotags were measured by UV-Vis spectrometer (UV-Vis Cary 5000, Agilent). Dynamic light scattering (DLS) was tested with Zetasizer (Malvern, United Kingdom).
Results and discussion
Principle of lectin-SERS assay for glycoprotein detection
We have developed a simple assay for glycoprotein detection and profiling of the attached glycans using lectin-SERS nanotags. As indicated in the schematic illustration of SERS nanotags (Fig. 1), AuNPs were first functionalized with MBA Raman reporter (Ra) molecules by covalent binding (Au–S bond) to form a self-assembled monolayer (SAM) on the AuNPs. A dual-functional linker (DTSSP) was used to conjugate the lectin to the AuNPs. The molecular structure of Raman reporter (MBA; with the distinct peak of 1075 cm−1) and the linker (DTSSP) are shown in Fig. S1 (ESI†). The DTSSP linker contains two amine-reactive N-hydroxysuccinimide (NHS) ester groups linked together via a disulphide bond. The two NHS groups on DTSSP react with amine groups on the surface of proteins, and the disulphide linkage chemisorbs onto the AuNP surface, linking the lectins to the AuNPs to yield lectin-SERS nanotags.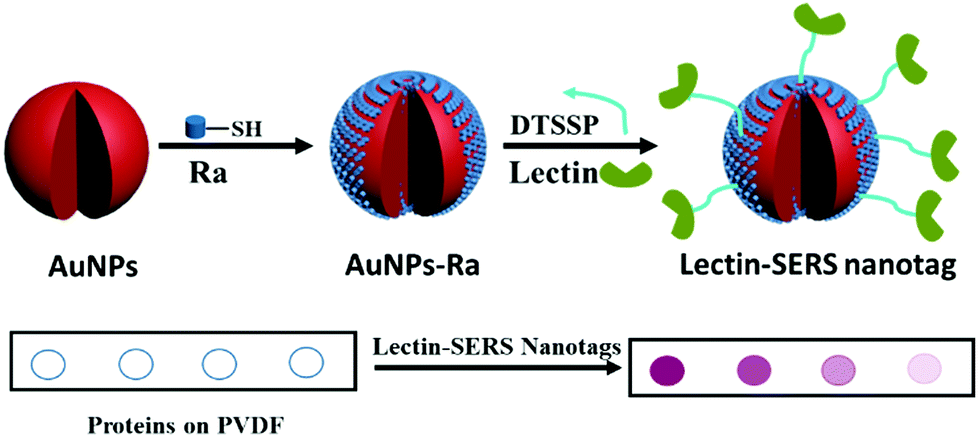 | ||
| Fig. 1 Schematic illustration of the fabrication of lectin-SERS nanotags and the assay for rapid glycoprotein identification and quantification. The Raman reporter MBA binds to the AuNPs surface via a thiol group. Lectin is attached to the AuNPs surface using the DTSSP crosslinker, yielding the lectin-SERS nanotag. An assay is performed by immobilising glycoproteins on a PVDF membrane, which is then incubated with the lectin-SERS nanotags. Binding of the nanotags indicates the presence of the lectin's target glycans on the immobilised protein. This is detected with a Raman microscope, where signal intensity correlates with abundance of the target glycans. | ||
Two different lectins – wheat germ agglutinin (WGA) and cholera toxin B (CTB) were conjugated to MBA-functionalised AuNPs in this work to test their binding to the glycans on the single site on the Fc region of the IgG glycoprotein. WGA binds to both N-acetyl-D-glucosamine (GlcNAc) and sialic acids,33 whereas CTB has been reported to bind selectively to GM1 ganglioside (a glycosphingolipid containing one sialic acid).34 The target carbohydrate species and the corresponding lectins have been listed in Fig. S1 (ESI†). The functionalised AuNPs are referred to as WGA-SERS and CTB-SERS. The lectin-SERS assay is carried out by immobilizing a glycoprotein (in this case IgG) on PVDF membrane (with the volume of 1 μL) and then incubating the membrane with lectin-SERS nanotags for 30 min. The presence of the MBA Raman reporter peak at wavenumber of 1075 cm−1 will indicate the binding of WGA to the glycoprotein, and the intensity (quantitative) of the peak (1075 cm−1) will indicate the amount of glycoprotein. This binding is detected by examining the PVDF membrane using a Raman microscope.
Characterization of lectin-SERS nanotags
The functionalization of WGA to AuNPs was monitored using UV-Vis absorption spectroscopy (Fig. 2A). After the conjugation of the lectin to the AuNPs using the DTSSP linker, a red-shift in the absorption maxima of the AuNPs was observed from 535 nm to 541 nm, which is induced by the change of the reflection index of the AuNPs in a different environment, due to the conjugated MBA and WGA.35 An increase in the hydrodynamic size (DLS, Fig. 2B) was also observed, from 55 nm to 79 nm, which is slightly greater than the anticipated increase of the addition of the DTSSP linker (1.2 nm linear length) and the WGA lectin (7.1 nm, measured from the crystal structure of WGA36).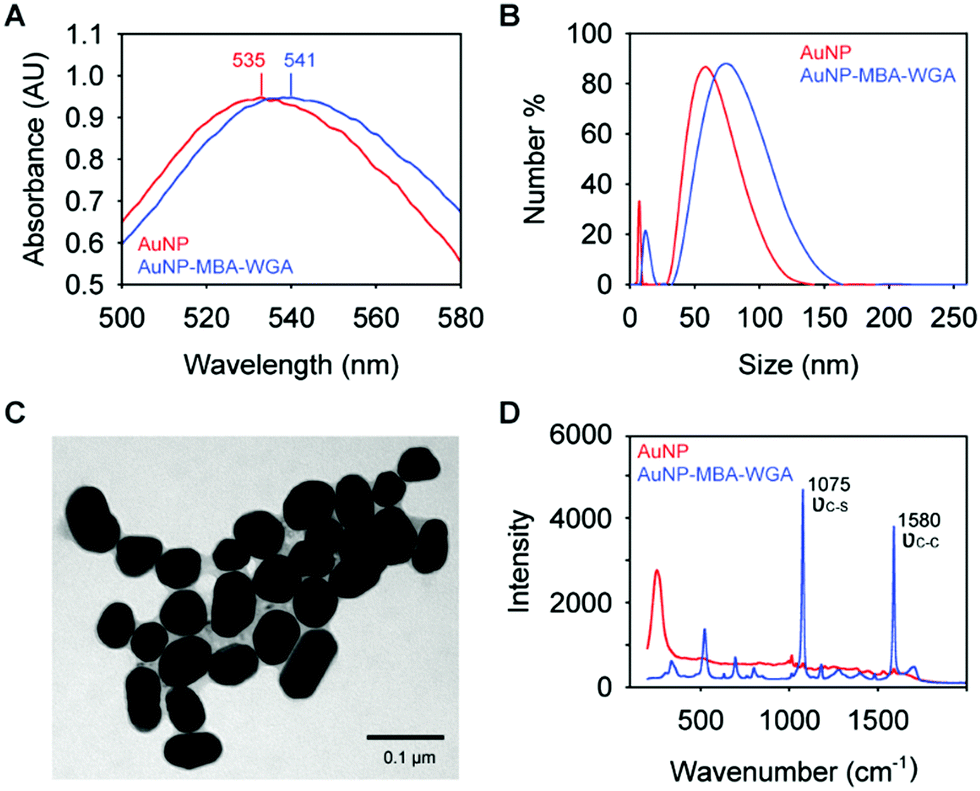 | ||
| Fig. 2 Characterization of lectin-SERS nanotags. (A) UV-Vis absorption spectra of AuNPs and lectin-SERS nanotags, where the absorbance maxima are indicated; (B) size distribution of AuNPs and lectin-SERS nanotags measured by dynamic light scattering; (C) TEM image of lectin-SERS nanotags, and (D) Raman spectra of AuNPs before and after functionalisation, where the peaks assigned to MBA vibrational modes are indicated. | ||
TEM images acquired of AuNPs functionalized with Raman reporter molecules and WGA (Fig. 2C) shows homogeneous particle size, consistent with the narrow distribution of the DLS measurements. We also performed the SERS measurements on unmodified AuNPs and SERS nanotags, as indicated in Fig. 2D. Two distinct peaks at 1075 cm−1 and 1580 cm−1, which are assigned to νC–S and νC–C vibrational modes of the Raman reporter molecule (MBA), were observed on SERS nanotags. In contrast, no signal was detected on AuNPs alone, indicating the successful conjugation of Raman reporter molecules to the AuNPs.
Specificity of lectin-SERS assay
The glycoprotein binding specificity was investigated by testing the interaction of WGA lectin functionalised AuNPs with proteins decorated with different types of glycans. Bovine serum albumin (BSA), RNaseB and IgG standards were applied to a PVDF membrane. RNaseB contains high mannose N-linked glycans, IgG attached N-glycans contain both GlcNAc and some sialic acids (recognised by WGA lectin), and BSA is not glycosylated. As a control, AuNPs which were functionalized with Raman reporter molecules and a ganglioside GM1 glycolipid recognising lectin (CTB-SERS) were also included in this study. Both WGA-SERS and CTB-SERS were incubated with strips of PVDF containing each protein standard. After 30 min of incubation, the membrane strips were visualized by Raman spectroscopic microscopy (Fig. 3A). A spot, indicative of WGA-SERS binding is clearly visible in the blotted IgG spot. No spots were visible on the PVDF membrane with proteins RNaseB and BSA, indicating that the binding observed of the WGA functionalized SERS nanotags to IgG is due to binding interactions between the attached lectin and the relevant glycans on IgG. The average Raman spectrum of each spot on the PVDF membrane is shown in Fig. 3B. Consistent with the visual examination of the membranes, a strong Raman signal was observed from the IgG spot on the membrane incubated with WGA-SERS. SERS images on each spot further demonstrate the specific binding of WGA-SERS on IgG (Fig. 3C). Surprisingly, in the control experiment with GM1 glycolipid-recognising CTB lectin, a faint spot was also visible upon close examination of the IgG on the PVDF membrane, indicating binding of CTB-SERS (Fig. 3D). This may suggest that CTB is able to bind to sugar groups present on glycoproteins as well as those on the glycolipid.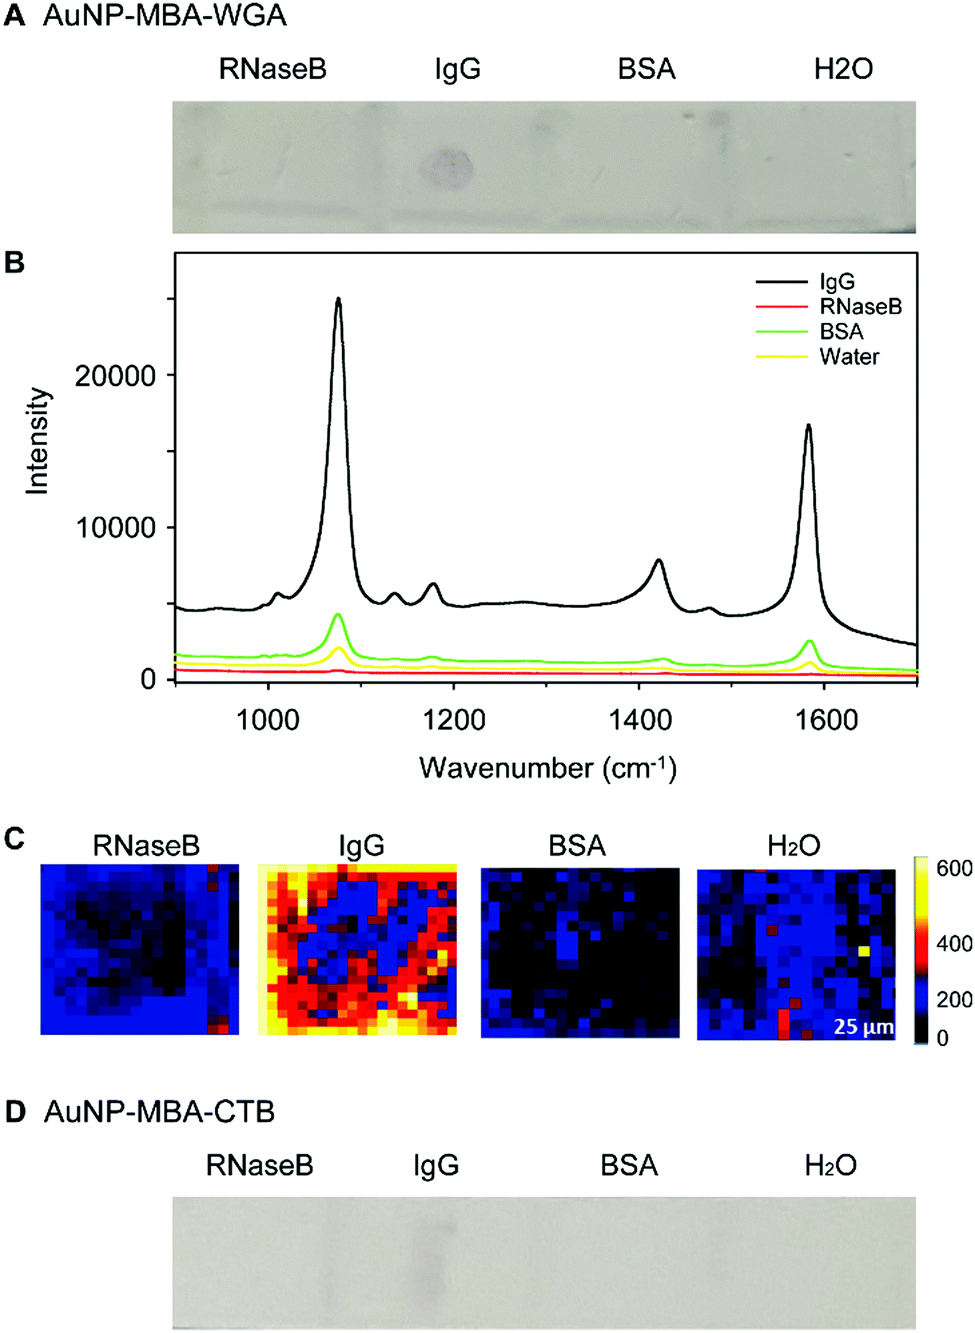 | ||
| Fig. 3 Specificity study: a variety of proteins including BSA, RNaseB and IgG were immobilized on PVDF membrane and then incubated with WGA-SERS nanotags. (A) The PVDF membrane after incubation with WGA-SERS nanotags, average SERS spectra (B) of membrane spots and typical SERS images (C) indicating the binding of WGA-SERS nanotags with IgG. (D) The PVDF membrane after incubation with CTB-SERS nanotags, used as a control. | ||
In order to confirm that the attachment of glycans to our WGA functionalized AuNPs occurred due to lectin–glycoprotein binding and not lectin–nanoparticle interactions, a binding test was performed using unfunctionalised or ‘raw’ AuNPs. A range of different proteins (BSA, RNase B and IgG) were immobilized on PVDF membrane and incubated with the raw AuNPs. It was found that there is no indication of binding of the raw AuNPs to the proteins (Fig. S2, ESI†), demonstrating the negligible non-specific binding of raw AuNPs to protein. It should be noted that although WGA cannot distinguish between N- and O-glycans for same terminal structure, lectins are able to recognise motifs that can be indicative of structural and functional changes in cell signalling.
Sensitivity of lectin-SERS assay
We next sought to determine whether our lectin-SERS nanotags could be used to accurately detect changes in glycan abundance. For this study, 1 μL of a series of IgG dilutions (0–100 μg mL−1 concentration) was blotted onto a PVDF membrane. After incubation with WGA-SERS for 30 min, the PVDF membrane was visualized (Fig. 4A). A clear trend is apparent, where the most concentrated IgG spots are more intensely stained. The intensity of each spot was measured by the scanning Raman microscope (Fig. 4B). The average Raman spectra of each spot was calculated (Fig. 4C) and the Raman intensity at the 1075 cm−1 maxima of the reporter MBA is shown in the bar chart in Fig. 4D. A clearly linear trend is apparent with increasing protein concentration. The sensitivity of the assay was thus determined as 10 ng, which was calculated based on the lowest detectable concentration (10 μg mL−1) and the sample volume of IgG (1 μL).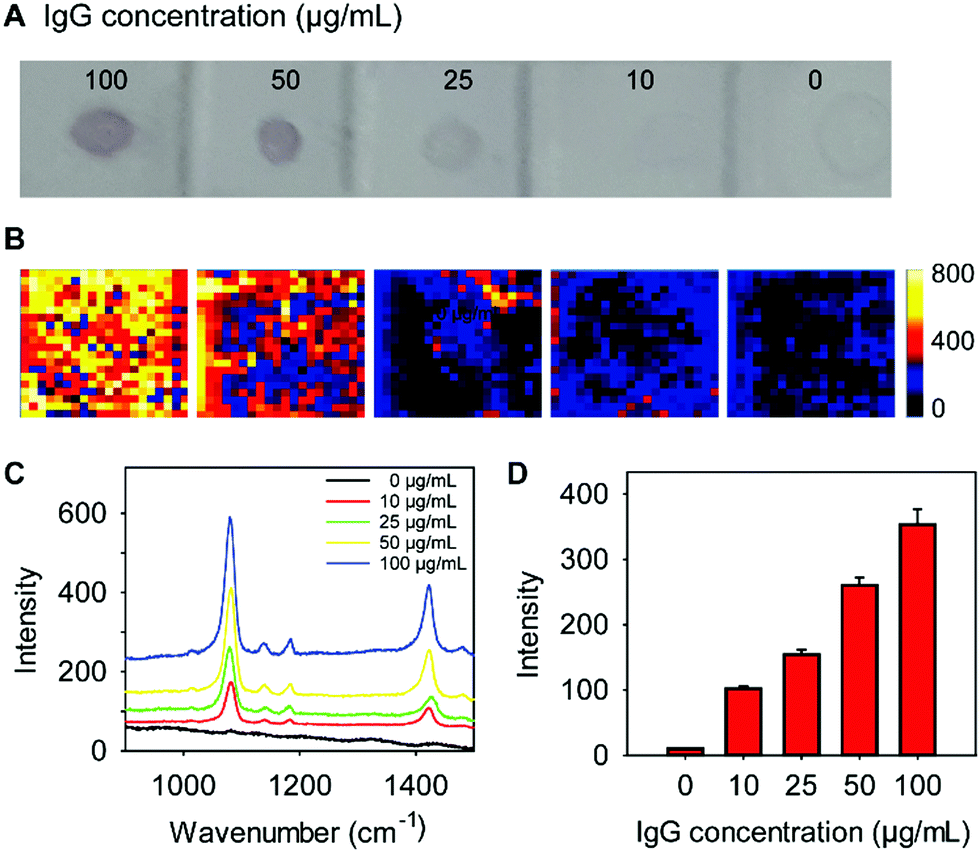 | ||
| Fig. 4 Sensitivity study: 1 μL of different concentrations of IgG solutions were immobilized on a PVDF membrane and then incubated with WGA-SERS nanotags (A). The SERS image (Raman intensity) of each spot is shown in (B) with the average SERS spectra shown in (C). Relationship between SERS intensity and the concentration of IgG (D), where the average of 400 intensity measurements is presented. | ||
These results indicate that not only can lectin-functionalized SERS nanotags specifically detect glycoproteins, they can also be used to quantify the amount of a purified glycoprotein. Lectin-functionalised SERS nanotags therefore have the potential to be applied to perform glycosylation profiling of cell membranes, and to monitor the changes in protein glycosylation in response to stimuli. Since changes in glycosylation are associated with many key biological events (e.g. inflammation, cancer, bacterial binding), the ability to profile glycosylation of cells and tissues, and detect changes in glycosylation makes our lectin-functionalised SERS nanotags and lectin-SERS assay a powerful analytical technique.
Cell surface glycan profiling by lectin-SERS nanotags
We further explored this capability of lectin-SERS nanoparticle binding to different glycan structures for whole live cell surface glycan profiling, without the usual purification or isolation of the glycans from their cell membrane carrier molecules. One thousand cells from two cell lines (SW480 and Colo205) were labelled with four lectin-SERS nanotags (Fig. 5A); CTB, WGA, PHA-L and AAL, which specifically target 4 different glycan structures (ESI,† Table S1) using the four different Raman reporter molecules including MBA, DTNB, TFMBA and MMC. It is interesting that CTB, which reportedly targets the ganglioside glycolipid, GM1, showed high binding to the cell surface indicating that the lectin-SERS nanotags can identify the glycans on either lipid or protein. We further determined the relative lectin binding level by the ratio of Raman peak intensity of the lectin-SERS nanotags on cells (Icell) to the original intensity of the lectin-nanotags (Inanotags) before being used for the cell labelling. The different cell types showed distinct glycan signatures (Fig. 5B), defined by the relative lectin binding level on the cell surface. These different cell surface glycan profiles on various colon cancer cell types is consistent with our previous report on cell surface glycan structure analysis on these cell lines using LC-MS.37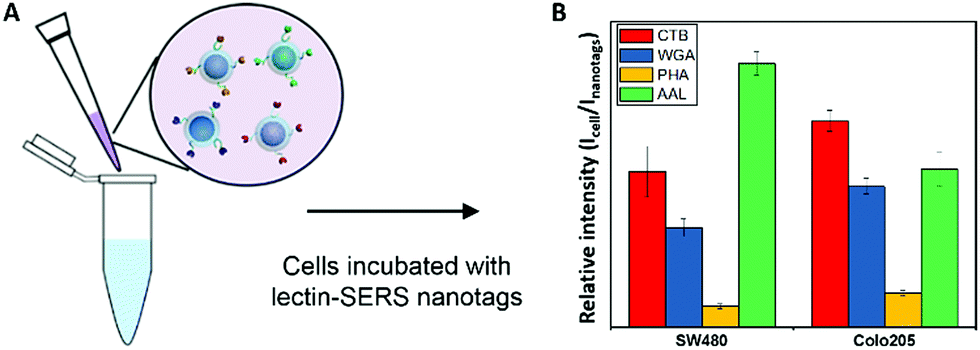 | ||
| Fig. 5 Scheme of labelling cells with lectin-SERS nanotags (A) and glycan signatures on SW480 and Colo205 cells (B) using 4 different lectin-SERS nanotags. | ||
Conclusions
We have demonstrated that our lectin-SERS assay is a rapid and sensitive strategy for the detection of targeted glycans on glycoproteins. The significant advantages of this approach are its sensitivity and simplicity, and that it can detect as little as 10 ng glycoprotein in 1 μL of sample. Cell surface glycan profiling of two different cell lines further demonstrated that this approach has the capacity to read the glycoprofile of live cells based on the interactions of different lectin-SERS nanotags. The described lectin-SERS assay thus promises to be a very powerful tool for the next-generation glycomics by facilitating the rapid fingerprinting of cell surface glycans.Conflicts of interest
There are no conflicts to declare.Acknowledgements
We acknowledge financial support from Australian Research Council (ARC) through its Centre of Excellence for Nanoscale BioPhotonics (CE140100003) and Discovery Project (DP200102004). We would also like to thank the financial support from MQ Research Seeding Grant to Y. W. These grants have significantly contributed to the research described here.References
- M. N. Christiansen, et al. , Proteomics, 2014, 14, 525–546 CrossRef CAS PubMed.
- W. Morelle, et al., Analysis of N- and O-Linked Glycans from Glycoproteins Using MALDI-TOF Mass Spectrometry, in Glycomics: Methods and Protocols, ed. N. H. Packer and N. G. Karlsson, Humana Press, Totowa, NJ, 2009, pp. 3–21 Search PubMed.
- M. Thaysen-Andersen and N. H. Packer, Biochim. Biophys. Acta, Proteins Proteomics, 2014, 1844, 1437–1452 CrossRef CAS PubMed.
- J. Hirabayashi, et al. , Chem. Soc. Rev., 2013, 42, 4443–4458 RSC.
- A. Kuno, et al. , Nat. Methods, 2005, 2, 851 CrossRef CAS PubMed.
- T. Zheng, et al. , J. Am. Chem. Soc., 2005, 127, 9982–9983 CrossRef CAS PubMed.
- M. Pučić, et al. , Mol. Cell. Proteomics, 2011, 10, M111.010090 CrossRef PubMed.
- P. Gemeiner, et al. , Biotechnol. Adv., 2009, 27, 1–15 CrossRef CAS PubMed.
- W. Zhou, et al. , Chem. Rev., 2015, 115, 10575–10636 CrossRef CAS PubMed.
- G. Sánchez-Pomales, et al. , Biotechnol. Bioeng., 2012, 109, 2240–2249 CrossRef PubMed.
- T. Bertok, et al. , Talanta, 2013, 108, 11–18 CrossRef CAS PubMed.
- M. G. Albrecht and J. A. Creighton, J. Am. Chem. Soc., 1977, 99, 5215–5217 CrossRef CAS.
- M. Fleischmann, et al. , Chem. Phys. Lett., 1974, 26, 163–166 CrossRef CAS.
- D. L. Jeanmaire and R. P. Van Duyne, J. Electroanal. Chem. Interfacial Electrochem., 1977, 84, 1–20 CrossRef CAS.
- L. A. Lane, et al. , Chem. Rev., 2015, 115, 10489–10529 CrossRef CAS PubMed.
- S. Nie and S. R. Emory, Science, 1997, 275, 1102–1106 CrossRef CAS PubMed.
- S. Schlücker, Angew. Chem., Int. Ed., 2014, 53, 4756–4795 CrossRef PubMed.
- H. Di, et al. , Anal. Chem., 2017, 89, 5874–5881 CrossRef CAS PubMed.
- X. Tu, et al. , Anal. Chem., 2016, 88, 12363–12370 CrossRef CAS PubMed.
- J. Ye, et al. , Angew. Chem., Int. Ed., 2014, 53, 10386–10389 CrossRef CAS PubMed.
- M. Tabatabaei, et al. , Chem. Sci., 2016, 7, 575–582 RSC.
- K. Kamil Reza, et al. , Small, 2017, 13, 1602902 CrossRef PubMed.
- S. C.-H. Tsao, et al. , Nat. Commun., 2018, 9, 1482 CrossRef PubMed.
- Y. Wang, et al. , Anal. Chem., 2014, 86, 2057–2064 CrossRef CAS PubMed.
- Y. Wang, et al. , Chem. Commun., 2014, 50, 2711–2714 RSC.
- Y. Wang, et al. , ACS Nano, 2010, 4, 4039–4053 CrossRef CAS PubMed.
- Y. Wang, et al. , ACS Nano, 2015, 9, 6354–6362 CrossRef CAS PubMed.
- Y. Wang, et al. , Chem. Commun., 2016, 52, 3560–3563 RSC.
- J. Li, et al. , Analyst, 2017, 142, 4788–4793 RSC.
- Y. Li, et al. , Chem. Commun., 2014, 50, 9907–9909 RSC.
- Y. Wang and J. Irudayaraj, Philos. Trans. R. Soc., B, 2013, 368, 20120026 CrossRef PubMed.
- G. Frens, Nature, Phys. Sci., 1973, 241, 20 CrossRef CAS.
- B. P. Peters, et al. , Biochemistry, 1979, 18, 5505–5511 CrossRef CAS PubMed.
- W. B. Turnbull, et al. , J. Am. Chem. Soc., 2004, 126, 1047–1054 CrossRef CAS PubMed.
- W. Haiss, et al. , Anal. Chem., 2007, 79, 4215–4221 CrossRef CAS PubMed.
- C. S. Wright and J. Jaeger, J. Mol. Biol., 1993, 232, 620–638 CrossRef CAS PubMed.
- J. H. L. Chik, et al. , J. Proteomics, 2014, 108, 146–162 CrossRef CAS PubMed.
Footnote |
| † Electronic supplementary information (ESI) available: List of lectins with the corresponding glycan binding, as well the molecular structure of Raman reporter molecule MBA and DTSSP (linker) have been provided in Table S1 and Fig. S1 respectively. Control experiment demonstrating the lack of binding of unconjugated SERS particles has been provided in Fig. S2. See DOI: 10.1039/c9mo00181f |
| This journal is © The Royal Society of Chemistry 2020 |