
Mass spectrometric analysis of core fucosylation and sequence variation in a human–camelid monoclonal antibody
Lynda J.
Donald
a,
Maureen
Spearman
a,
Neha
Mishra†
a,
Emy
Komatsu
b,
Michael
Butler
ac and
Hélène
Perreault
 *b
*b
aDepartment of Microbiology, University of Manitoba, Winnipeg, Manitoba R3T 2N2, Canada
bDepartment of Chemistry, University of Manitoba, 144 Dysart Road, Winnipeg, Manitoba R3T 2N2, Canada. E-mail: Helene.Perreault@umanitoba.ca
cNational Institute of Bioprocessing Research & Training (NIBRT), Fosters Avenue, Dublin 4, A94 X099, Ireland
First published on 4th March 2020
Abstract
Electrospray mass spectrometry (ESI-MS) was used to measure the masses of an intact dimeric monoclonal antibody (Mab) and assess the fucosylation level. The Mab under study was EG2-hFc, a chimeric human–camelid antibody of about 80 kDa (A. Bell et al., Cancer Lett., 2010, 289(1), 81–90). It was obtained from cell culture with and without a fucosylation inhibitor, and treated with EndoS which cleaves between the two core N-acetyl glucosamine (GlcNAc) residues. It is the first time that this combined approach with a unique mass spectrometer was used to measure 146 Da differences as part of a large intact dimeric antibody. Results showed that in the dimer, both heavy chains were fucosylated on the core GlcNAc of the Fc Asn site equivalent to Asn297. In the presence of the fucosylation inhibitor, fucosylation was lost on both subunits. Following reduction, monomers were analyzed and the masses obtained corroborated the dimer results. Dimeric EG2-hFc Mab treated with PNGase F, to deglycosylate the protein, was also measured by MS for mass comparison. In spite of the success of fucosylation level measurements, the experimental masses of deglycosylated dimers and GlcNAc–Fuc bearing dimers did not correspond to masses of our sequence of reference (A. Bell et al., Cancer Lett., 2010, 289(1), 81–90; http://www.uniprot.org; http://www.expasy.org), which prompted experiments to determine the protein backbone sequence. Digest mixtures from trypsin, GluC, as well as trypsin + GluC proteolysis were analyzed by matrix-assisted laser desorption/ionization (MALDI) MS and MS/MS. A few variations were found relative to the reference sequence, which are discussed in detail herein. These measurements allowed us to build a new “experimental” sequence for the EG2-hFc samples investigated in this work, although there are still ambiguities to be resolved in this new sequence. MALDI-MS/MS also confirmed the fucosylation pattern in the Fc tryptic peptide EEQYNSTYR.
Introduction
Monoclonal antibodies (Mabs) comprise a large portion of biotherapeutic drugs used to treat a variety of diseases including many cancers, autoimmune diseases such as Crohn's and rheumatoid arthritis, and a growing number of other conditions.1–4 Mabs are produced in cultured cells such as Chinese hamster ovary (CHO) cells, to generate proteins with posttranslational modifications similar to those of human cells.5 The most common class of immunoglobulin (Ig) used for Mabs is IgG, a dimer made up of a heavy and a light chain.6,7 The variable (Fv) regions of the heavy and light chains contain the regions specific for antigen binding, while the conserved region (Fc) of the Mab mediates the antibody effector functions to eliminate or inactivate the antigen target. The glycosylation of Mabs on asparagine 297 (Asn297, N297) in the Fc region of the heavy chains can dramatically affect the functionality and pharmacokinetics as a biotherapeutic agent,8,9 and therefore cultures must be maintained under highly controlled conditions to generate Mabs with consistent glycosylation.10–12 The presence of a core fucose on the N-acetylglucosamine (GlcNAc) residue adjacent to the protein link reduces the ability of the Mab to elicit an antibody-dependent cellular cytotoxicity (ADCC) response,13–15 one of the mechanisms by which the Mabs initiate elimination of an antigenic targeted cell. Therefore, it is important to monitor and, if possible, reduce the fucosylation of Mabs used as this specific type of biotherapeutic. Glycodesign of biotherapeutics is increasingly used to enhance the properties and effectiveness through glycoengineering, the use of inhibitors and control of culture conditions.16–23One functional problem of Mabs used in treatment is their large size (typically 150 kDa) which may make penetration into tissues more difficult, thus reducing efficacy.24 Genetic engineering was previously used to produce a truncated hybrid Mab with properties similar to camelid antibodies (produced in bactrian camels, dromedaries, and llamas) which contain heavy chains only, and lack the CH1 domain of the heavy chain that binds to the light chains through disulphide bonds.25 The resulting Mab, EG2-hFc is an 80 kDa chimeric antibody with a camelid fragment variable (Fv) attached by a hinge to a humanized fragment crystallisable (Fc) region.26 The latter region was derived from a cloned portion of human IgG1, but no sequence information was provided.27 We have used the sequences of EG2 and part of IgG1 (P01857) to create a reference EG2-hFc sequence because it was important to know in advance the expected mass of the various components. Fig. 1 shows the reference sequence with the position of the glycosylation sites analogous to the Asn297 site of full-length IgG1. EG2-hFc has also retained, at Asn208, the glycosylation pattern of IgG at its Asn297 site.9,28 In addition, the antigenic target of EG2-hFc, the epidermal growth factor receptor (EGFR), is able to bind through the camelid Fv region (VHH) and Fc receptor binding can occur through the human Fc to afford initiation of the ADCC response.19,29 The smaller size of EG2-hFc may allow better penetration and increased efficacy for the treatment of EGFR expressing cancer cells.26
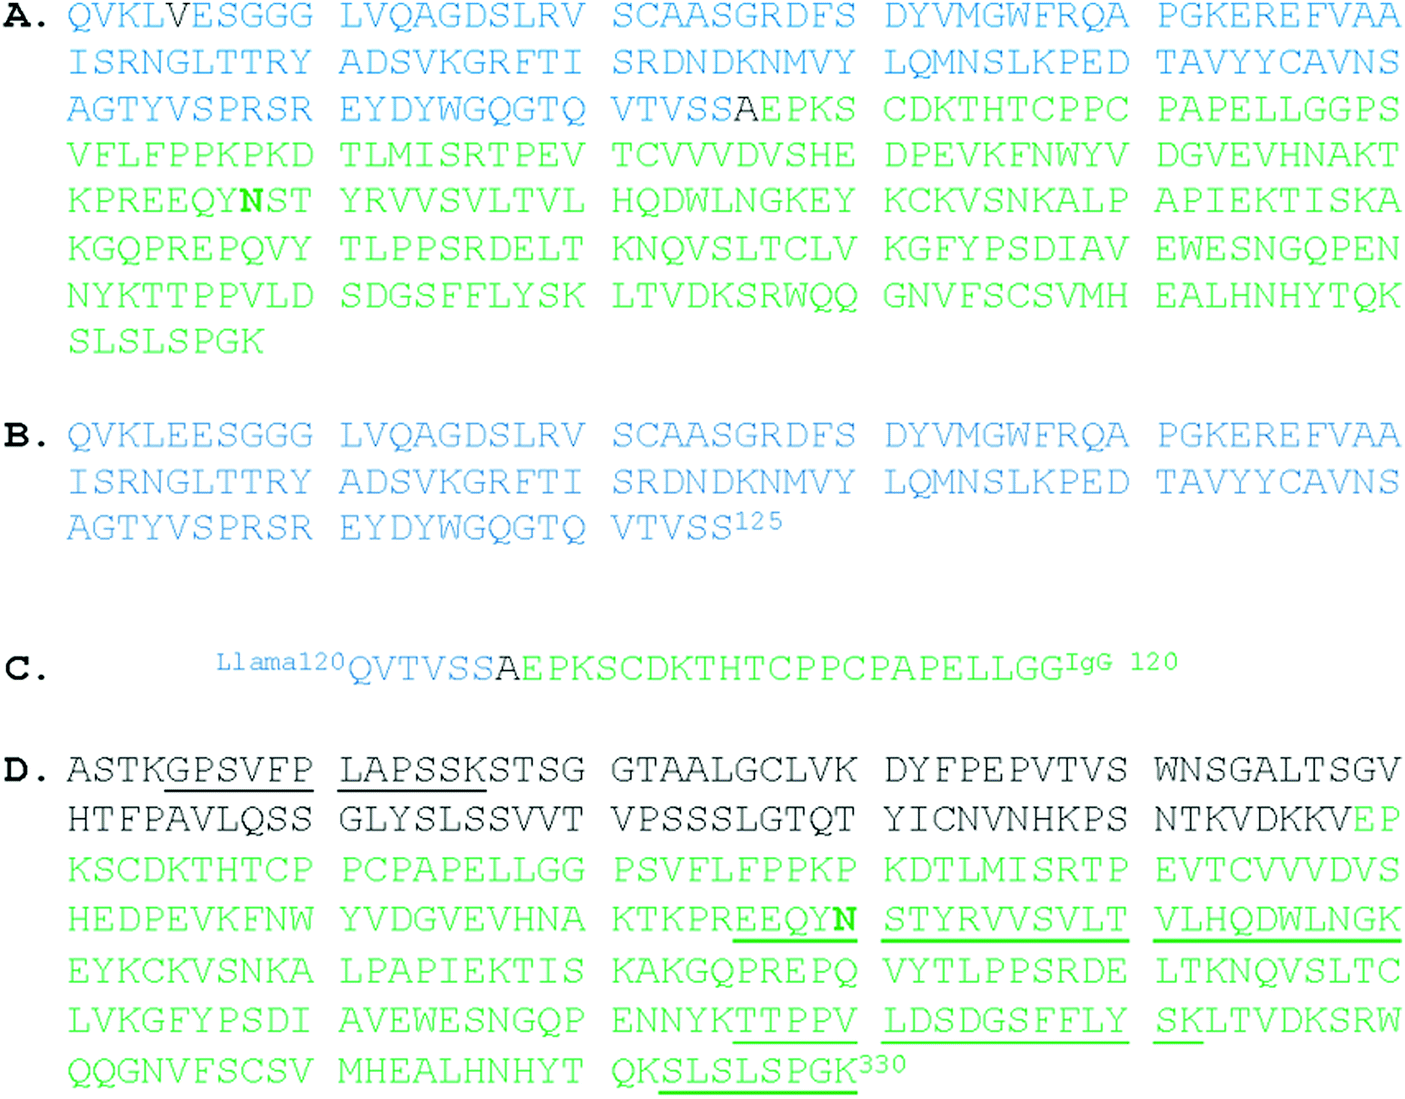 | ||
Fig. 1 Reference sequence of EG2-hFc compiled from the literature. “Asn297” is in bold type. (A) The constructed sequence: Glu5 was revised to Val.26,27 Val97 of IgG1 becomes Ala126 in this hybrid. Calculated mass is 39![[thin space (1/6-em)]](https://www.rsc.org/images/entities/char_2009.gif) 946 Da for the nonglycosylated monomer (compute pI/MW, http://www.expasy.org); (B) N-terminus: amino acids 1–125 (NCBI ABX79392.1 anti-EGFR single domain antibody, partial [Lama glama]);26 (C) PCR primer hFc6, 3′5′ frame 2 translation27 to overlap llama and human sequences at the hinge region, thus creating the hybrid; (D) C-terminus: amino acids 98–330 from IgG1 (UniprotKB|P01857|IGHG1_HUMAN Immunoglobulin heavy constant gamma 1 (http://www.expasy.org)). Reference peptides are underlined (http://www.proteomicsdb.org). 946 Da for the nonglycosylated monomer (compute pI/MW, http://www.expasy.org); (B) N-terminus: amino acids 1–125 (NCBI ABX79392.1 anti-EGFR single domain antibody, partial [Lama glama]);26 (C) PCR primer hFc6, 3′5′ frame 2 translation27 to overlap llama and human sequences at the hinge region, thus creating the hybrid; (D) C-terminus: amino acids 98–330 from IgG1 (UniprotKB|P01857|IGHG1_HUMAN Immunoglobulin heavy constant gamma 1 (http://www.expasy.org)). Reference peptides are underlined (http://www.proteomicsdb.org). | ||
Even though EG2-hFc is smaller than the usual Mabs, the presence of highly variable glycosylation makes the complete protein dimer a difficult study for mass spectrometry measurements. All the glycans can be removed by incubation of the Mab with peptide:N-glycosidase F (PNGase F), an endoglycosidase which leaves a deaminated protein or peptide and a free glycan.30 The mass of the protein, about 80 kDa,26 can be ascertained by running the samples on an SDS-PAGE gel and the glycans can undergo structural analysis through a variety of methods.31 This is an excellent method for recovery, and representative analysis of total glycans using hydrophilic interaction liquid chromatography (HILIC) glycan analysis32 or MS.33 However, both methods give total percent fucosylation, and offer no information on the percentage of fucosylation on individual dimers of the intact protein. Therefore, we have also used a specific endoglycosidase, endoglycosidase S (EndoS) which removes the majority of the glycan leaving only the core GlcNAc ± fucose. This allows MS analysis of the intact protein while removing the microheterogeneity of the glycan.
Intact proteins and their noncovalent complexes can be preserved in the gas phase if suitable conditions can be found.34,35 Electrospray ionization from a volatile buffer produces a mist of ionized droplets that are desolvated and focussed as they pass into the high vacuum conditions of the mass spectrometer. Folded proteins and their complexes usually carry less charge than denatured proteins because they should have less surface available to take up the charge. If a denaturing solvent is used to disrupt their folded conformation, the shape of the spectrum should change to a lower m/z range, enabling an accurate measurement of the mass of a purified protein. Our Manitoba-built time-of-flight mass spectrometer has been used successfully to determine stoichiometry of large complexes such as tetrameric AmpR protein with DNA and a repressor molecule,36 dsRNA and OAS with and without mercaptoethanol adducts,37 and others with high m/z values well beyond the range of most commercial instruments.38
Our primary aim was to develop methodology to differentiate the core fucosylated species (nonfucosylated, monofucosylated and difucosylated) on the full-length dimeric form of the protein. This was necessary to monitor the effects of limiting fucose addition by fucosylation inhibitors and genetic manipulation.39 Previous work has shown that the most abundant form of the dimer has two fucose molecules,9,28 consistent with our analysis. However, detailed analysis indicated that there was a small portion with no fucose and that the major protein species was considerably smaller than that calculated from the reference amino acid sequence illustrated in Fig. 1. Our secondary aim was to identify which amino acids are missing or modified from the reference sequence.
Methods
Preparation of the protein
CHO EG2-hFc cells were maintained in 80 mL cultures in 250 mL baffled shaker flasks with vented caps (VWR International, Mississauga, CA) in BioGro CHO CD media (Biogro Technologies Inc, Winnipeg, Canada) with 25 mM glucose (BD, Sparks, USA). The shaker flasks were held in a humidified incubator at 120 rpm, 5% CO2 and 37 °C. Cells were passaged every 3–4 days for maintenance, and re-seeded at 2.5 × 10⁵ cells per mL. For experiments, cells were removed by centrifugation (1500g for 15 min) at day four. The supernatant was then passed through a 0.2 μM filter in preparation for antibody purification.The EG2-hFc Mab was purified from the culture media using a HiTrapTM Protein A HP 1 mL column (GE Healthcare, Fairfield, CT). Cell culture supernatant was applied to the column, washed with 10 mL PBS (pH 7.4) and then the protein was eluted with 0.1 M glycine–HCl, pH 2.7 (Sigma-Aldrich, St. Louis, MO). The protein solution was neutralized immediately using 1 M Tris–HCl, pH 9.0 (Thermo Fisher Scientific, Waltham, MA) and concentrated using an Amicon Ultra 30 kDa MWCO filter (EMD Millipore, Etobicoke, ON).
Two different enzymatic digests were used to decrease the amount of glycosylation on the protein prior to sample preparation for mass spectrometry analysis. Analysis of the glycans is normally done after a PNGase F (Promega, Wisconsin, USA) digestion on the Protein A column, removing all glycan residues,40,41 and allowing subsequent elution of a fully deglycosylated protein. In order to retain the core GlcNAc and fucose residues, the purified protein was bound to immobilized endoglycosidase S (deGlyIT, Genovis, Cambridge MA) to hydrolyze the β-1,4 linkage between the variable glycans and the core GlcNAc residue.42,43 One preliminary sample of EG2-hFc from another experiment39 was prepared from media containing 40 μM 2-fluoroperacetylated fucose (2FF), a competitive inhibitor of the FUT8 enzyme that normally adds the fucose to the core GlcNAc.44 SDS-PAGE gels were routinely run to ascertain purity and recovery of the protein at each stage of protein preparation.
Analysis of the full-length protein
Intact protein was desalted into 50 mM filtered ammonium bicarbonate using Amicon Ultra 50 kDa MWCO filters (Millipore),45 and recovered at about 50 μM in the same buffer. For electrospray ionisation, protein was diluted to 10–15 μM in 50% methanol/1% acetic acid. Nanospray ionisation was used when the recovered protein was too dilute for electrospray. To create monomeric protein, the desalted protein was incubated with 10 mM dithiothreitol (DTT) for 30 min at 37 °C. All samples were analysed on a novel electrospray mass spectrometer with extended mass range, designed for analysis of noncovalent complexes, constructed in the department of Physics and Astronomy at the University of Manitoba.38 Voltages were adjusted as required to give the best resolution of ions, and only those spectra are shown. Deconvolutions, including Full-Width Half Maximum measurements (FMHM), were calculated using cited charge states. Errors were calculated as half the FWHM measurement. All analyses were done using TOFMA, in-house software developed with the instrument.Analysis of proteolytic digests
These and further samples of the protein were reduced with DTT (10 mM, for 45 min, at 56 °C), alkylated with iodoacetamide (50 mM, for 45 min, at room temperature in the dark), quenched with DTT for 10 min at room temperature, desalted into 0.1 M ammonium bicarbonate at pH 8.0, and then incubated overnight at 37 °C with trypsin, or trypsin plus GluC, or GluC alone (2 μg Promega enzyme/100 μg EG2-hFc). Digested protein was desalted with a C18 SPE column following manufacturer's instructions (Phenomenex, Torrance, CA, USA). The samples were eluted in 80% acetonitrile + 0.1% TFA, mixed 1:1 v:v with DHB matrix (saturated solution of 2,5-dihydroxybenzoic acid in 70:30 water:acetonitrile + 0.1% TFA), and applied to an appropriate metal target. Three different matrix assisted laser desorption/ionisation (MALDI) mass spectrometers were used to analyse the samples. Initial screening of tryptic digests was done on a modified commercial SCIEX instrument,46 with tandem mass spectra on a prototype double quadrupole time-of-flight (Qq-TOF) instrument,47 both located in the Department of Physics and Astronomy, University of Manitoba, with spectral analysis by in-house adapted TOFMA software. This software was developed with instruments in the Department of Physics and Astronomy from about 1990, and has been used in several studies since.36–38,45–47 Subsequent mass spectra were acquired on an UltrafleXtreme TOF–TOF (Bruker Daltonics, Germany) in the Department of Chemistry, University of Manitoba, and analysed using Bruker software. Tandem MS (MS/MS) data were also obtained on the UltrafleXtreme instrument, in positive mode using LIFT™ methodology. Although LC-MS/MS is now more widely used, this type of instrument was not available at the time of analysis, and LC-MS/MS data treatment by search engines would not have necessarily identified subtle amino acid substitutions considered in this work. Instead, manual analysis of our MALDI MS/MS data spectra allowed us to interpret individual spectra and identify the specific amino acid changes.
Results
Fucosylation study on the intact dimers
The electrospray spectrum of the intact EG2-hFc protein treated with EndoS (Fig. 2A) had two quasi-continuous ion envelopes, the higher charge states expected from denatured protein (m/z 2000–3000), and also those in the range associated with non-denatured or folded proteins (m/z 4000–5000). A second aliquot of the protein was treated with PNGase F, to remove the GlcNAc and fucose residues and change Asn208 (Asn297 in IgG1) to aspartic acid (Fig. 2B). Although the protein was prepared the same way as for the EndoS sample, there was no evidence of the kind of spectrum associated with denatured protein but, rather, a clear ion envelope with the lower charge states typical of folded proteins. A third sample, also treated with EndoS, from an experiment where 2FF was added to prevent addition of fucose to the core GlcNAc, had a spectrum very similar to the first sample with two distinct ion envelopes (Fig. 2C).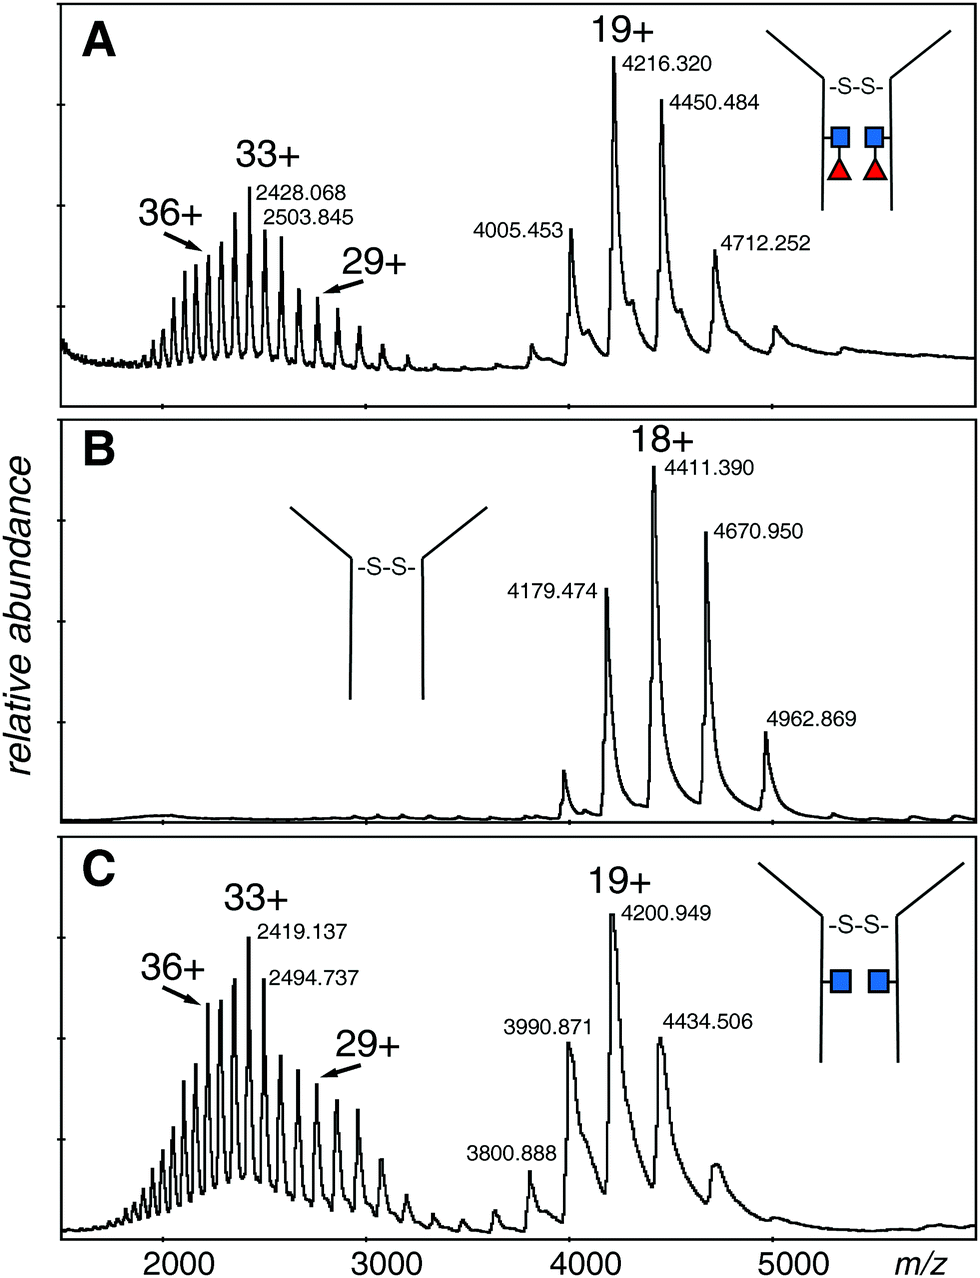 | ||
| Fig. 2 Electrospray spectra of the complete denatured EG2-hFc (A) after EndoS digest. The protein was 10 μM in 50% methanol/1% acetic acid and sprayed at 200 V declustering voltage. Capillary voltage was 3000 V. Deconvolution is shown in Fig. 3A: (B) after PNGase F digestion. The protein, at 10 μM in 50% methanol/1% acetic acid, was sprayed at 150 V declustering voltage, 2127 V capillary voltage. Deconvolution is shown in Fig. 3B: (C) after EndoS digest from media with 2FF. The protein, at 10 μM in 50% methanol/1% acetic acid, was sprayed at 120 V declustering voltage, 3000 V capillary voltage. Deconvolution is shown in Fig. 3C. ■ GlcNAc, ◀ fucose. | ||
The deconvolutions are shown together in Fig. 3, and the data are summarized in Table 1. Deconvolution of the ions in the envelope at higher charge states (29+ to 36+) from the spectrum shown in Fig. 2A (EndoS) revealed more than one mass, but the major species, at 80096 Da, agreed with the “about 80 kDa” cited in the literature.26 Deconvolution of the 17+ to 19+ ions gave a mass of 80098 ± 20 Da for the major species showing that it is from the same protein, but less well resolved. The most prominent minor component of 79848 Da did not fit with the loss of either fucose (146 Da) or GlcNAc (203 Da). The very small minor component was about 79670 Da. For the spectrum shown in Fig. 2B (PNGase F), deconvolution of the 16+ to 20+ ions gave a pattern quite similar to that of the EndoS sample with the exception of lower mass values, a major species at 79397 Da, and a minor one of 79158 Da. For the spectrum shown in Fig. 2C, from a protein expected to have no fucose on the core GlcNAc residues, the deconvolution of the ions of higher charge states has a pattern similar to those shown in Fig. 3A and B, but with intermediate masses, 79798 Da for the major species, and 79552 Da for the less abundant species. There may be other, minor species in the spectra but their contribution to the high baseline interferes with further identifications.
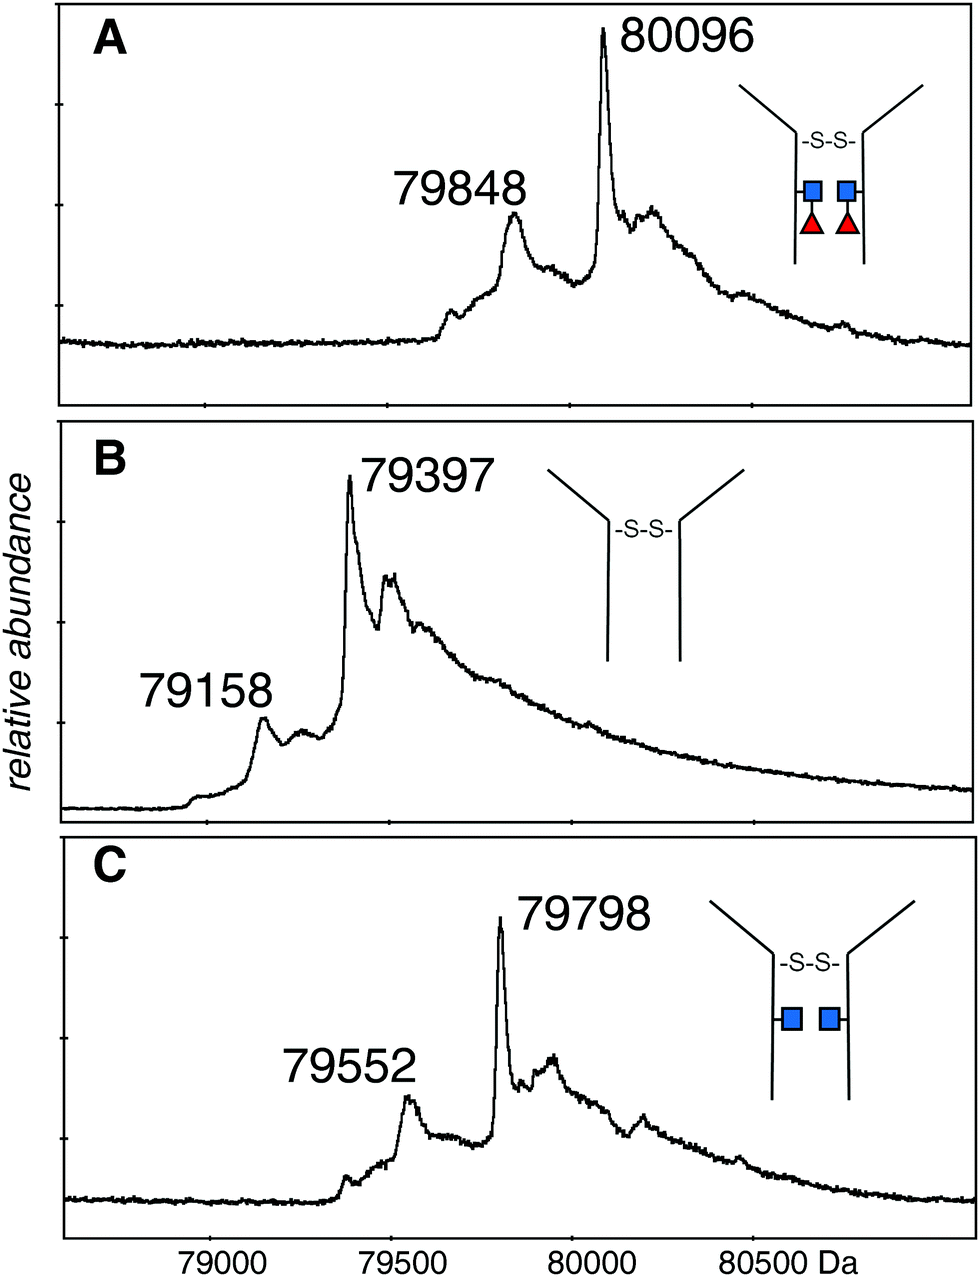 | ||
| Fig. 3 Deconvolutions of the spectra shown in Fig. 2. (A) The 29+ to 36+ ions of the dimeric protein after EndoS digestion: (B) the 16+ to 20+ ions of the dimeric protein after PNGase F digestion: (C) the 29+ to 36+ ions of the dimeric protein after EndoS digest from culture media with 2FF. Detailed analysis, error measurements, and comparison with the expected masses, are in Table 1. ■ GlcNAc, ◀ fucose. | ||
| Enzyme | Inhibitor | Core glycan | Mass of monomer (Da) | Mass of dimer (Da) | Fig. | ||
|---|---|---|---|---|---|---|---|
| Expected | Observed | Expected | Observed | ||||
| PNGase F | — | None, Asn208Asp | 39947 |
39699 ± 7 |
79892 |
79397 ± 15 |
Fig. 2B and 3B |
| 79158 ± 27 |
|||||||
| EndoS | — | None | 39946 |
— | 79890 |
— | |
| 2FF | 1GlcNAc | 40149 |
39905 ± 8 |
80093 |
— | ||
| 39780 ± 17 |
|||||||
| 2FF | 2GlcNAc | n/a | 80296 |
79798 ± 14 |
Fig. 2C and 3C | ||
| 79552 ± 25 |
|||||||
| — | 1GlcNAc, 1fucose | 40295 |
40050 ± 7 |
80239 |
— | ||
| 39929 ± 11 |
|||||||
| 2FF | 2GlcNAc, 1fucose | n/a | 80442 |
— | |||
| — | 2GlcNAc, 2fucose | n/a | 80588 |
80096 ± 14 |
Fig. 2A and 3A | ||
| 79848 ± 30 |
|||||||
|
ca. 79670 |
|||||||
The difference in mass between the major ions shown in Fig. 2A, B and 3A, B (Table 1) was very close to that expected for two GlcNAc and two fucose residues (expected 698 Da, observed 699 Da). Additionally, minor ions differed by nearly the same Δmass (690 Da) and agree with major ions, if one considers the error of measurement. The difference in mass between the most prominent species in samples Fig. 2A, C and 3A, C is 298 Da and 296 Da, close to that expected for two fucose residues. Similar calculations between the pairs of species in Fig. 2B, C and 3B, C is 401 and 394 Da, close to what is expected for two GlcNAc residues. There are more precise methods of measuring the mass of pure GlcNAc and fucose, but these are 203 and 146 Da additions to an 80 kDa protein! The difference in mass between the major and minor species was about the same in all three spectra, and did not fit with either GlcNAc or fucose.
Fucose on the monomers
In order to measure the mass of the monomers, the samples were incubated with DTT to reduce the disulfide bond. Although reduction conditions were gentle, there was significant loss of sample due to precipitation; however, it was possible to acquire reasonable spectra for the monomeric forms of all three samples. The spectra of all three proteins were quite similar with 12+ to 14+ ions of clusters of protein species, but no spectrum showed the higher charge states expected from denatured samples. The major species of the EndoS treated sample was 40050 Da, with a second measurable species at 39929 Da (Fig. 4 and Table 1). The PNGase F treated sample (not shown) had one major species at 39699 Da with many sodium adducts, but further attempts at desalting left insufficient protein for measurement. The difference in mass between the two samples was close to that expected for one GlcNAc and one fucose residue (expected 349 Da, observed 351 Da). The major species for the EndoS + 2FF monomer was 39905 Da, with a minor one of 39780 Da (not shown). Comparison of this sample with the other two was consistent with a loss of fucose and retention of the GlcNAc residue (see Table 1).
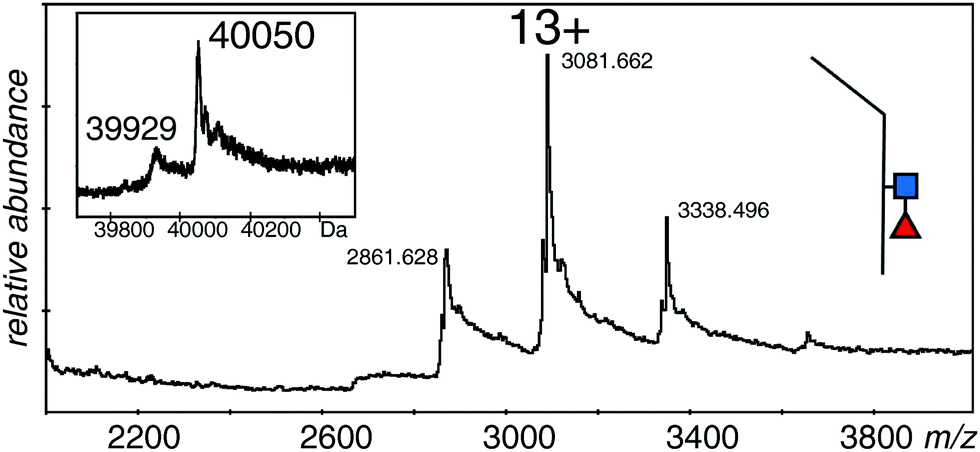 | ||
| Fig. 4 Electrospray spectrum of the same sample shown in Fig. 2A after DTT treatment. The protein was at 10 μM in 50% methanol/1% acetic acid and sprayed at 220 V declustering voltage and 2611 V capillary voltage. Inset is the deconvolution of the 12+ to 14+ ions. ■ GlcNAc, ◀ fucose. | ||
These measurements showed that the spectrum in Fig. 2A was from a protein with GlcNAc and fucose residues on both halves of the dimer, although the observed mass is almost 500 Da smaller than expected from the reference sequence in Fig. 1. The protein with no fucose on the core (Fig. 2C), and the one lacking any core glycans (Fig. 2B) were similarly about 500 Da smaller than expected from the calculated values. The measureable minor component in each case is about 250 Da smaller than the major one, a value that could be explained by a pair of lysine residues, and borne out by the measurements of the monomers. An extra, optional, lysine could easily be lost from the C-terminus of the protein,48 but this does not take into account the 500 Da discrepancy in the total mass of the dimer, and half that amount in the total mass of the monomers. Preliminary experiments had verified the sequence of the initial tryptic peptide and the unique glycosylation site, but afforded little information on the rest of the protein. Thus we digested the protein with trypsin alone, with GluC alone, and with a mixture of GluC and trypsin.
The results of the three kinds of digests are shown, together with our experimentally determined protein sequence, in Fig. 5. Three of the five referenced tryptic peptide sequences of P01857, (underlined in Fig. 1D) were confirmed by MS/MS analysis. The ions matching peptide 204–212, with the unique glycosylation site, are illustrated in Fig. 6. The missing reference peptides were located at each end of the P01857 protein – the first and last peptides of IgG1. The first is located in the part of IgG1 replaced by the EG2 sequence, and there was no ion matching that expected for the final tryptic peptide, although there was an ion from the GluC digest that might represent that larger, final peptide for which there was insufficient material for further analysis.
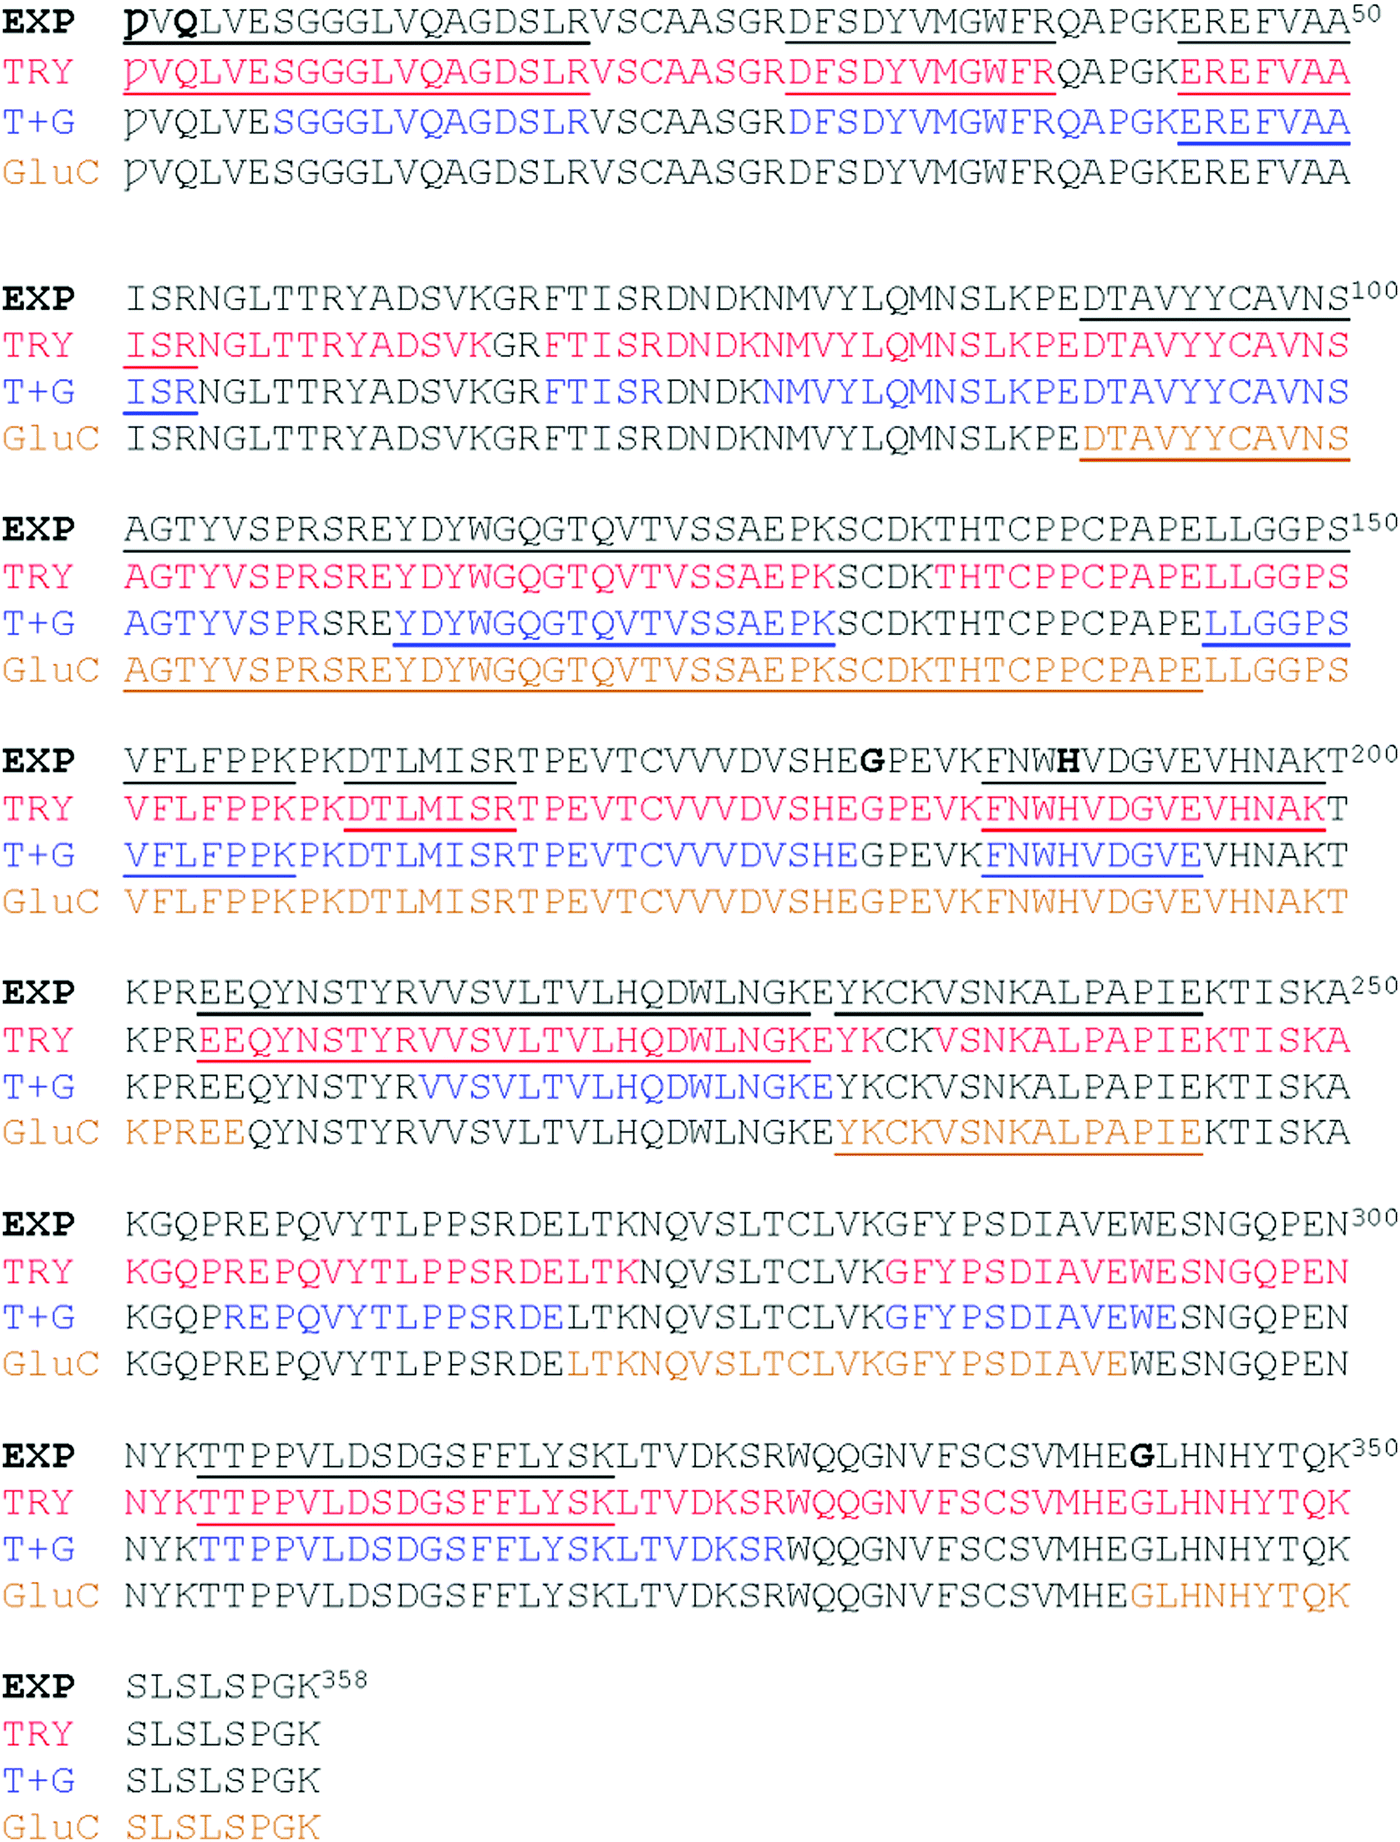 | ||
| Fig. 5 Summary of the MALDI analyses: EXP the experimental sequence. TRY peptides identified by tryptic fragments. T + C, peptides identified in digest using trypsin and GluC (some of these are tryptic only fragments), GluC peptides identified in the GluC digest. Peptides sequenced by MS/MS are underlined by protease and in the experimental sequence. Calculated mass of the monomer is 39831 Da. | ||
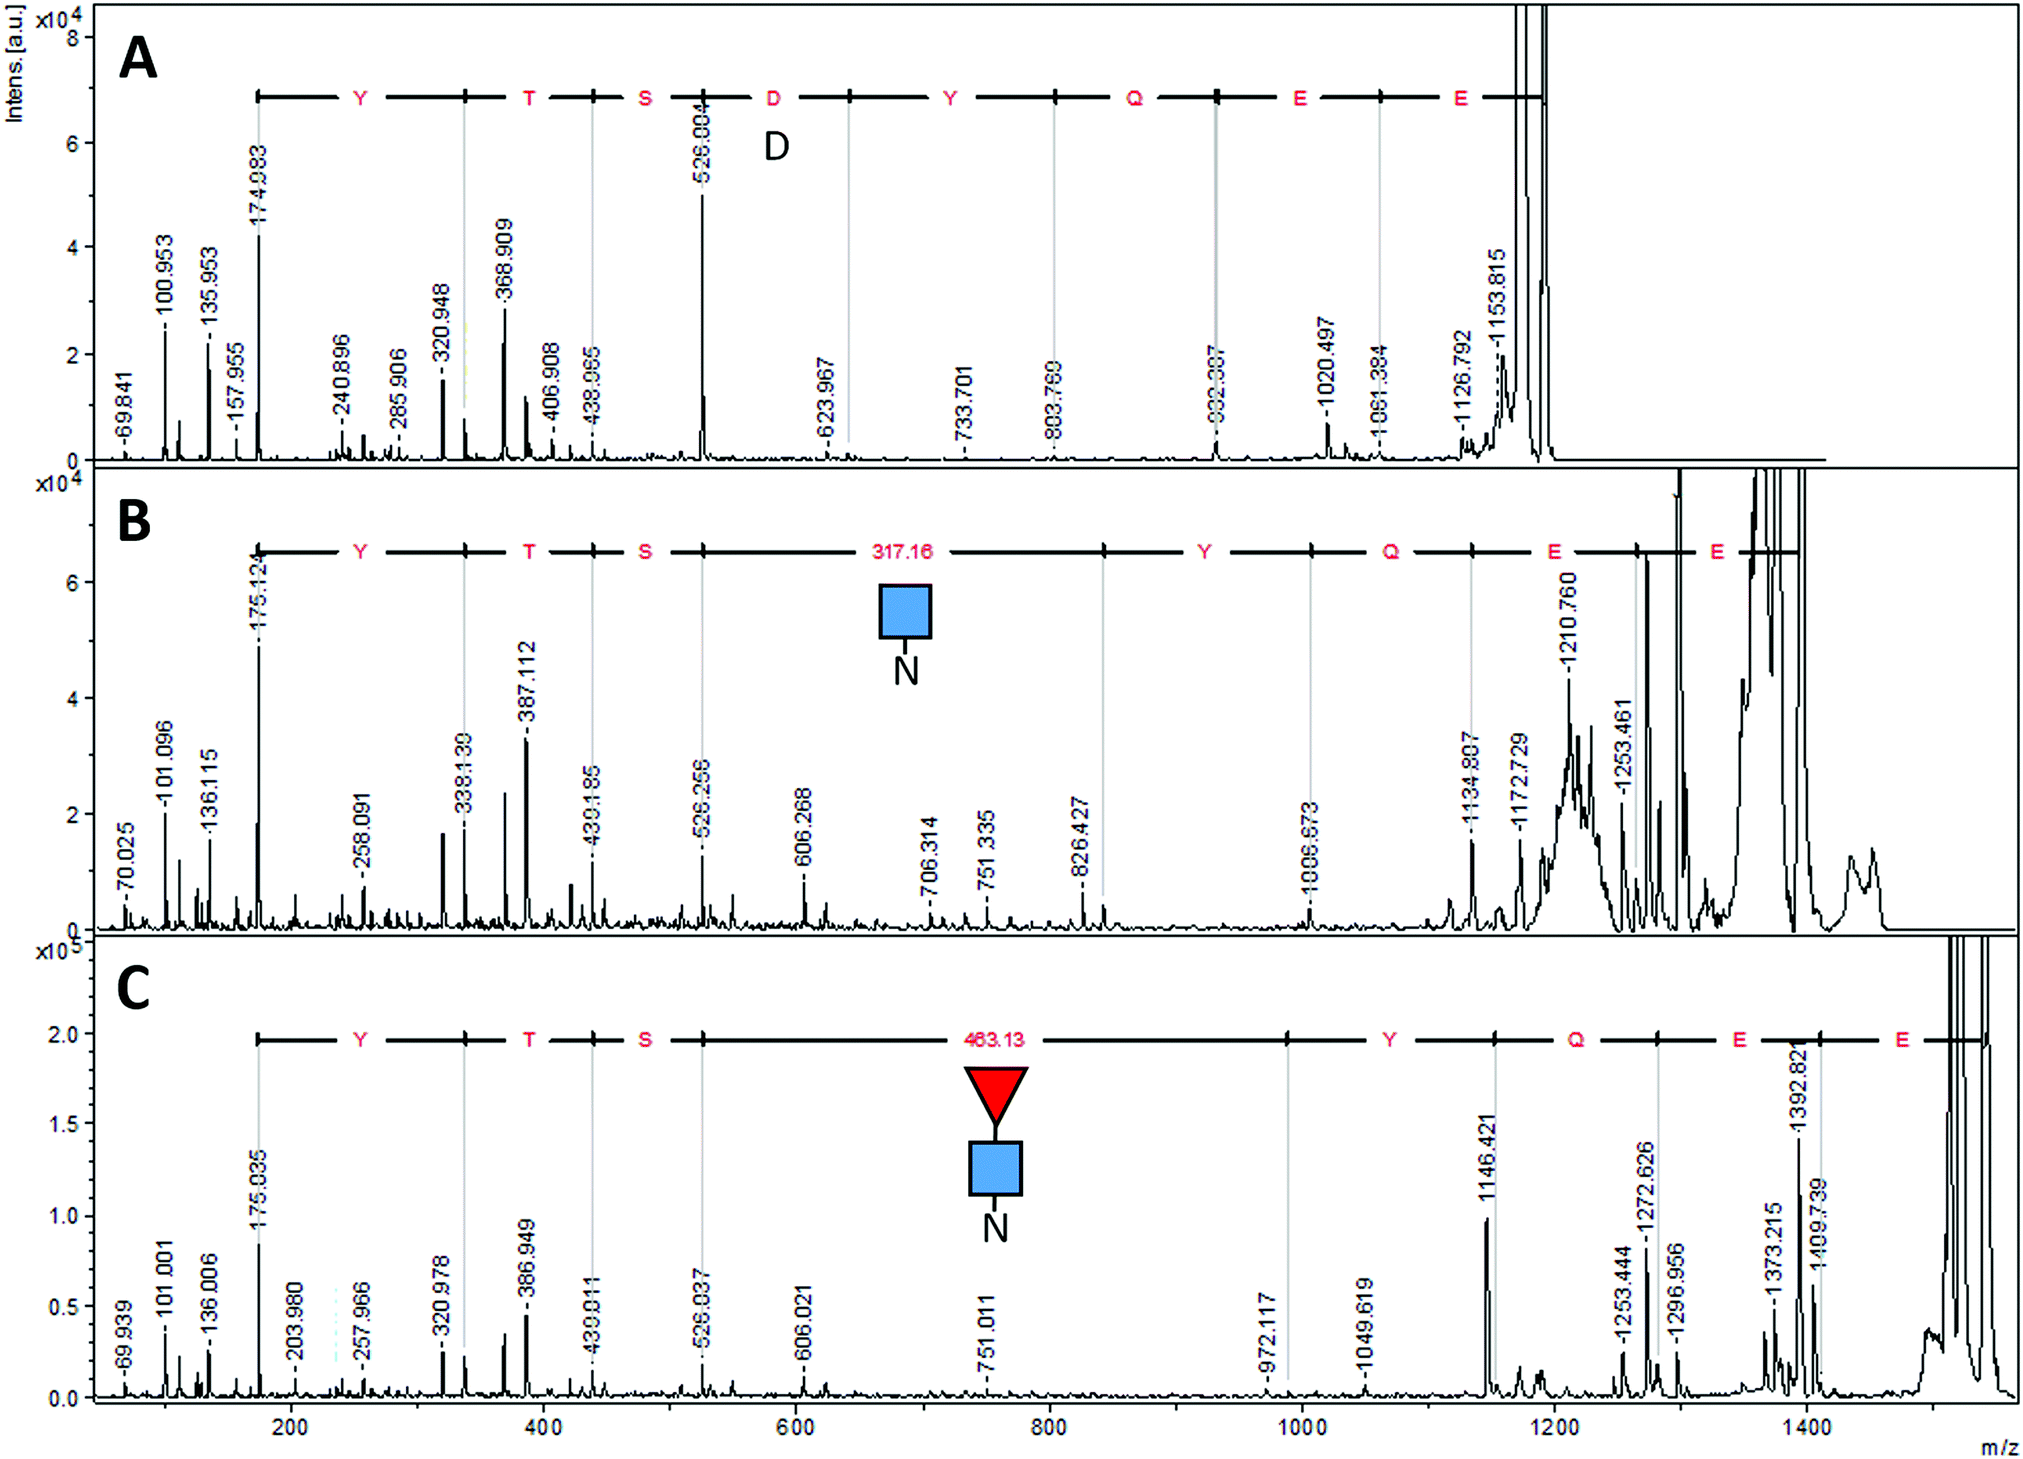 | ||
| Fig. 6 MALDI-MS/MS spectra of different forms of EG2-hFc's tryptic peptide EEQYNSTYR. (A) After PNGase F deglycosylation, (B) with only GlcNAc attached, (C) with GlcNAc–Fuc attached. The Δm/z values of 317.16 and 463.13 correspond to Asn + GlcNAc and Asn + GlcNAc–Fuc, respectively. Ions at m/z 175 are y1 ions of arginine (R). Sequencing was performed using the series of y fragments in each case. ■ GlcNAc, ◀ fucose, N asparagine, D aspartic acid. | ||
We found six laboratory-determined differences (Fig. 5) from the reference sequence given in Fig. 1: Gln1 is pyroglutamate (Ƿ), Lys3 is Gln, Val126 is Ala, Asp181 is Gly, Tyr189 is His and Ala342 is Gly. The first pair of changes is in the initial peptide, where an abundant ion at m/z 1895.982 did not match any predicted from the published sequence. This was fortuitous, because MS/MS revealed it to be the first 19 amino acids of the protein, with the last y ion and all the b ions 17 Da too small, most likely from deamidation of the first glutamine residue to pyroglutamic acid.49,50 If amino acid three was lysine, the measured ion should have been at m/z 1896.019, and we would expect to observe another tryptic digest ion at m/z 1557.824. Thus, we believe the initial sequence of most of the hybrid protein is pVQLVESGGGLVQAGDSLR where Ƿ represents pyroglutamate. However, the expected ion at m/z 1913.009 was also present at about 10% of the abundance of the ion at m/z 1895.982, indicating that the conversion to pyroglutamate was incomplete. The Val126Ala and Tyr189His were identified by overlapping fragments, and then confirmed by MS/MS analysis. The Asp181Gly and Ala342Gly were inferred by overlapping fragments, but the ions that fit with our expected sequences were of insufficient abundance for successful MS/MS analysis. There were no ions matching those expected for peptides having Asp at position 181 or Ala at position 342.
The peptide EEQYNSTR with Asn208, (analogous to Asn297 of IgG) could have been present without glycosylation (at m/z 1189.513), with GlcNAc (at m/z 1392.592), and with both GlcNAc and fucose (at m/z 1538.650). In the sample prepared with EndoS, the ion at m/z 1538.650 was present at high abundance, and there was a very small amount of an ion at m/z 1392.610, evidence that some small amount of the protein was missing the fucose. In the sample prepared with PNGase F, there was no ion at m/z 1189.513 but rather a prominent ion at m/z 1190.510. Fig. 6 shows the fragmentation patterns of three forms of the tryptic peptide EEQYNSTYR, characteristic of EG2-hFc. The top MS/MS spectrum (A) was obtained after PNGase F and tryptic treatments, denoting the sequence EEQYDSTYR. The second spectrum (B) shows an m/z 50–626 range similar to that of (A), while the higher m/z peaks are shifted upwards by 203, the residual mass of GlcNAc. In (C), this increment is larger as it corresponds to GlcNAc–Fucose, following Endo S and tryptic digestion. In (B) and (C), the higher m/z portions feature the characteristic (peptide − 16)+, (peptide + 1)+ and (peptide + 84)+ ions of glycopeptide MS/MS spectra,51 where peptide = mass of nonglycosylated peptide, which is 1188 in this case for EEQYNSTYR. The peptide−16, +1 and +84 ions appear at m/z 1172, 1189 and 1272 in both spectra.
Discussion
Core fucosylation of the glycan at Asn297 of the Fc region has a significant effect on the functionality of Mabs in their ability to remove target antigens. For example, low fucosylation is optimal for Mabs for ADCC13,15 for the elimination of cancer cells.2 Therefore, it is important that we fully understand factors which influence fucosylation in the metabolic pathway within the endoplasmic reticulum, in order to manipulate levels of fucosylation to suit the specific function of the Mab as a biotherapeutic. Glycosylation inhibitors such as 2FF,21 kifunensine and castanospermine19 and genetic manipulation to divert fucose into a dead end rhamnose pathway22 have been effective in reducing core fucosylation. New evidence using 2FF inhibition of fucosylation suggests that some core monofucosylated Mabs can occur as cultures are treated with increasing concentrations of 2FF.39 However, there is little information available on how core fucosylation of Mabs is influenced by culture conditions, and whether monoglycosylation can occur and its functionality and efficacy compared to afucosylated and bifucosylated Mabs. Recent work has found that pCO2, manganese and media hold duration decreases fucosylation.52 Understanding factors that affect fucosylation requires structural analysis which goes beyond determining only glycan structure and levels of fucosylation, and analyzes the protein with the core GlcNAc and fucose intact.Another approach had been developed for fucosylation studies on Mabs. Upton et al. were interested in the core afucosylation levels of HerceptinTM Fc glycans, which they were able to correlate with receptor binding affinity studies by surface plasmon resonance (SPR) and ADCC.53 Their approach consisted of treating intact HerceptinTM with IdeS enzyme, releasing two separate truncated Fc chains with the glycans of interest. These were then treated with endoglycosidase EndoS, leaving either GlcNAc or GlcNAcFuc on each chain, as measured by mass spectrometry.53 A similar process was applied in Industry, showing a high level of interest for fucosylation in the scientific community.54 Although this approach is effective at quantifying total fucosylation or afucosylation levels, it cannot specifically determine if, within each antibody molecule, both chains are fucosylated or not. We believe that our method of measuring the mass on the intact Mab after EndoS treatment brings in this level of specificity as demonstrated by our results (Fig. 2 and 3).
Mass spectrometry technology is at the forefront of Mab analysis, after starting with simple experiments to determine biotin additions on a small Mab,55 to antibody–drug conjugates where a mass difference of 20 Da could be detected on the fully glycosylated Mab.56 Instrument development using commercial standards of IgG has shown the potential applications of microfluidics,57 variable temperature58 and OrbitrapTM MS56 to the characterization of intact antibodies. Electrospray ionization has been particularly useful in determining the mass and structure of intact proteins and non-covalent complexes.35,59–61
It would have been possible to perform the type of experiments reported here on a commercial high resolution ESI-MS instrument with a restricted m/z range, e.g. up to 4000. For example, Jacobs et al. developed a high resolution method for the quantitative study of glycosylation of intact Mabs and IgG from whole serum, using nano liquid chromatography chip technology on a Q-TOF instrument.62 Chip ESI led to multiply charged intact antibodies on a m/z range of 2000–3200 for the specific analyses of TrastuzumabTM and BevacizumabTM62.
This is the first mass spectrometry analysis of a Mab where the primary purpose was to measure the fucosylation on the intact EG2-hFc dimer. We have analyzed the protein with no glycan (PNGase F-treated), and also an EndoS-treated protein which removes most of the terminal glycan, leaving only the GlcNAc core with or without the core fucose. The EndoS-treated protein has been derived from Mab protein produced under normal conditions which has a high fucosylation index (70–80%),11,19 or in the presence of a fucosylation inhibitor (40 μM 2FF) which produces a nonfucosylated protein.39 Our experiments went beyond measuring only the fucosylation level of intact EG2-hFc, and allowed us to assess differences in protein folding because there were well-defined ion species up to m/z 5500. Our results suggest that the absence of glycosylation prevents the natural unfolding process that was expected to happen in the presence of acid.
The first step in examining any protein should be to determine its nominal mass, which is not always exactly as expected from the provided amino acid sequence, and we were interested in measuring a mass difference of one or two fucose residues on the “about 80 kDa” protein.26 Thus, we used a methanol/acetic acid mixture to disrupt the secondary structure of the protein. This was not expected to affect the glycans, as glycopeptides analysis by MALDI-MS has previously shown intact glycan structures in the Fc region of EG2-hFc.33 We expected to see a single ion envelope at high charge state, such as shown by the ions in the lower m/z region in Fig. 2A and C. The presence of ions at lower charge state from those samples that had retained some part of the core glycan were continuous with the higher charge state ions. Those ions could be explained as not quite denatured, or more folded because the reduced surface area of a folded protein cannot hold as much charge as a typical denatured protein. However, the sample treated with PNGase F (Fig. 2B) had a spectrum typical of a folded protein, and no amount of dilution or rough treatment changed the spectrum. A reasonable explanation could be that the PNGase F-treated protein is not properly folded, but rather collapsed, so that the acid/methanol mixture is ineffective for solvating or unfolding it. Davis et al.63 reported that fully deglycosylated immunoglobulin superfamily I (IgSFI) tended to aggregate although it still bound ligand and antibody. Preparation of antibody for crystallisation studies was successful when cells were made sensitive to Endo H, but the use of PNGase F was reported to cause aggregation.64 Folding studies on a mono-N-glycosylated immune cell receptor has shown that the core GlcNAc is a major contributor to its stability, stability that is enhanced when more of the glycan is present.65 Therefore, although PNGase F treatment is ideal for the preparation of the glycans, the residual protein is probably not properly folded. An EndoS preparation would leave at least the core GlcNAc, and a protein with more of its natural structure.
There are at least three different isoforms of EG2-hFc; the variable N-terminus, the variable C-terminus, and the variation in the core glycosylation. None of these fully explained the difference between the measured mass of the nonglycosylated monomer and that calculated from either the reference sequence, (mass 39946 Da, Fig. 1), or the experimentally determined sequence (mass 39831 Da, Fig. 4). The new calculated mass of a dimer with 2GlcNAc and 2fucose, (80358 Da) is still 262 Da larger than the measured mass (Table 1). With the exception of the small dipeptide GR (213.1226 Da), there was apparently complete coverage of the protein when we used the three digestion approaches. Loss of a C-terminal Lys residue has been observed and is considered common,48 but we cannot prove that the apparently lost lysine is the one shown in the sequence as residue 358. Additionally, the final tryptic peptide, one of the key reference peptides for P01857, was not observed, and, except for a weak ion of unconfirmed sequence from the GluC digest, there was no evidence for its presence, suggesting some C-terminal proteolysis beyond the loss of lysine. IgG1 has been shown to have at least three different C-termini, at Pro, Gly, and Lys66 although these variants do not quite account for the 262 Da of missing sequence in our EG2-hFc. There is a great deal of heterogeneity in both the N- and C-termini of many Mabs, but these did not impact the potency or efficacy of the Mabs used clinically,67 so the final peptide is probably not important to the functionality of EG2-hFc. We did not anticipate such variability in the protein itself, variation that we are unable to explain completely at the present time.
Conclusion
The main focus of this study was to assess the fucosylation pattern of intact Mab EG2-hFc (MW 80 kDa). We chose not to dissociate the Fc chains of the Mab in order to determine if fucosylation occurred on both chains, neither chain, or only on one of the chains. Owing to ESI-MS measurements it was possible to determine that fucosylation takes place on both Fc glycans for most EG2-hFc molecules, while a very small percentage exhibited fucosylation on one chain only. The measurement of fucosylation and measurement of the exact mass of the protein would be possible on most commercial ESI instruments, but assessment of the naturally folded structures would require an instrument such as we used.Conflicts of interest
There are no conflicts to declare.Acknowledgements
This work was supported by grants from the Natural Sciences and Engineering Research Council of Canada, Discovery Grants, (RGPIN-2017-00502; H. P. and RGPIN/05922-2016; MB) and a Strategic Network (MabNet) (NETGP/380070-2008; MB). The authors wish to acknowledge the members of the late Professor K. G. Standing's group for help with the ESI-MS measurements.References
- V. Bruno, G. Battaglia and F. Nicoletti, Neurol. Sci., 2011, 31(Suppl. 3), 283–288 CrossRef PubMed.
- A. M. Scott, J. P. Allison and J. D. Wolchok, Cancer immunity, 2012, 12, 14 Search PubMed.
- P. J. Rosenfeld, D. M. Brown, J. S. Heier, D. S. Boyer, P. K. Kaiser, C. Y. Chung, R. Y. Kim and M. S. Group, N. Engl. J. Med., 2006, 355, 1419–1431 CrossRef CAS PubMed.
- H. M. van Dullemen, S. J. van Deventer, D. W. Hommes, H. A. Bijl, J. Jansen, G. N. Tytgat and J. Woody, Gastroenterology, 1995, 109, 129–135 CrossRef CAS.
- Y. Durocher and M. Butler, Curr. Opin. Biotechnol., 2009, 20, 700–707 CrossRef CAS PubMed.
- H. W. Schroeder, Jr. and L. Cavacini, J. Allergy Clin. Immunol., 2010, 125, S41–S52 CrossRef PubMed.
- V. Irani, A. J. Guy, D. Andrew, J. G. Beeson, P. A. Ramsland and J. S. Richards, Mol. Immunol., 2015, 67, 171–182 CrossRef CAS PubMed.
- R. Jefferis, Arch. Biochem. Biophys., 2012, 526, 159–166 CrossRef CAS PubMed.
- L. Liu, J. Pharm. Sci., 2015, 104, 1866–1884 CrossRef CAS PubMed.
- H. Aghamohseni, M. Spearman, K. Ohadi, K. Braasch, M. Moo-Young, M. Butler and H. M. Budman, J. Ind. Microbiol. Biotechnol., 2017, 44, 1005–1020 CrossRef CAS PubMed.
- C. Villacres, V. S. Tayi, E. Lattova, H. Perreault and M. Butler, Biotechnol. J., 2015, 10, 1051–1066 CrossRef CAS PubMed.
- Y. Fan, I. Jimenez Del Val, C. Muller, J. Wagtberg Sen, S. K. Rasmussen, C. Kontoravdi, D. Weilguny and M. R. Andersen, Biotechnol. Bioeng., 2015, 112, 521–535 CrossRef CAS PubMed.
- R. L. Shields, J. Lai, R. Keck, L. Y. O'Connell, K. Hong, Y. G. Meng, S. H. Weikert and L. G. Presta, J. Biol. Chem., 2002, 277, 26733–26740 CrossRef CAS PubMed.
- S. Chung, V. Quarmby, X. Gao, Y. Ying, L. Lin, C. Reed, C. Fong, W. Lau, Z. J. Qiu, A. Shen, M. Vanderlaan and A. Song, mAbs, 2012, 4, 326–340 CrossRef PubMed.
- T. Shinkawa, K. Nakamura, N. Yamane, E. Shoji-Hosaka, Y. Kanda, M. Sakurada, K. Uchida, H. Anazawa, M. Satoh, M. Yamasaki, N. Hanai and K. Shitara, J. Biol. Chem., 2003, 278, 3466–3473 CrossRef CAS PubMed.
- N. Yamane-Ohnuki, S. Kinoshita, M. Inoue-Urakubo, M. Kusunoki, S. Iida, R. Nakano, M. Wakitani, R. Niwa, M. Sakurada, K. Uchida, K. Shitara and M. Satoh, Biotechnol. Bioeng., 2004, 87, 614–622 CrossRef CAS PubMed.
- M. J. Buettner, S. R. Shah, C. T. Saeui, R. Ariss and K. J. Yarema, Front. Immunol., 2018, 9, 2485 CrossRef PubMed.
- C. Raymond, A. Robotham, M. Spearman, M. Butler, J. Kelly and Y. Durocher, mAbs, 2015, 7, 571–583 CrossRef CAS PubMed.
- N. Krahn, M. Spearman, M. Meier, J. Dorion-Thibaudeau, M. McDougall, T. R. Patel, G. De Crescenzo, Y. Durocher, J. Stetefeld and M. Butler, Eur. J. Pharm. Sci., 2017, 96, 428–439 CrossRef CAS PubMed.
- Q. Wang, C. Y. Chung, J. N. Rosenberg, G. Yu and M. J. Betenbaugh, Methods Mol. Biol., 2018, 1850, 237–257 CrossRef CAS PubMed.
- G. Dekkers, R. Plomp, C. A. Koeleman, R. Visser, H. H. von Horsten, V. Sandig, T. Rispens, M. Wuhrer and G. Vidarsson, Sci. Rep., 2016, 6, 36964 CrossRef CAS PubMed.
- H. H. von Horsten, C. Ogorek, V. Blanchard, C. Demmler, C. Giese, K. Winkler, M. Kaup, M. Berger, I. Jordan and V. Sandig, Glycobiology, 2010, 20, 1607–1618 CrossRef CAS PubMed.
- G. Roy, T. Martin, A. Barnes, J. Wang, R. B. Jimenez, M. Rice, L. Li, H. Feng, S. Zhang, R. Chaerkady, H. Wu, M. Marelli, D. Hatton, J. Zhu and M. A. Bowen, mAbs, 2018, 10, 416–430 CrossRef CAS PubMed.
- E. Cruz and V. Kayser, Biol.: Targets Ther., 2019, 13, 33–51 CAS.
- M. M. Harmsen and H. J. De Haard, Appl. Microbiol. Biotechnol., 2007, 77, 13–22 CrossRef CAS PubMed.
- A. Bell, Z. J. Wang, M. Arbabi-Ghahroudi, T. A. Chang, Y. Durocher, U. Trojahn, J. Baardsnes, M. L. Jaramillo, S. Li, T. N. Baral, M. O'Connor-McCourt, R. Mackenzie and J. Zhang, Cancer Lett., 2010, 289, 81–90 CrossRef CAS PubMed.
- J. Zhang, X. Liu, A. Bell, R. To, T. N. Baral, A. Azizi, J. Li, B. Cass and Y. Durocher, Protein Expression Purif., 2009, 65, 77–82 CrossRef CAS PubMed.
- B. Liu, M. Spearman, J. Doering, E. Lattova, H. Perreault and M. Butler, J. Biotechnol., 2014, 170, 17–27 CrossRef CAS PubMed.
- C. D'Eall, R. A. Pon, M. A. Rossotti, N. Krahn, M. Spearman, D. Callaghan, H. van Faassen, G. Hussack, J. Stetefeld, M. Butler, Y. Durocher, J. Zhang, K. A. Henry and J. Tanha, Immunol. Cell Biol., 2019, 97, 526–537 CrossRef PubMed.
- P. Kuhn, A. L. Tarentino, T. H. Plummer, Jr. and P. Van Roey, Biochemistry, 1994, 33, 11699–11706 CrossRef CAS PubMed.
- M. Spearman, E. Bodnar, H. Perreault and M. Butler, Pharm. Bioprocess., 2014, 2, 449–468 CrossRef.
- L. Royle, C. M. Radcliffe, R. A. Dwek and P. M. Rudd, Methods Mol. Biol., 2006, 347, 125–143 CAS.
- E. Bodnar, T. F. Nascimento, L. Girard, E. Komatsu, P. Lopez, A. G. G. de Oliveira, R. Roy, T. Smythe, Y. Zogbi, M. Spearman, V. S. Tayi, M. Butler and H. Perreault, Can. J. Chem., 2015, 93, 754–763 CrossRef CAS.
- A. C. Leney and A. J. R. Heck, J. Am. Soc. Mass Spectrom, 2017, 28, 5–13 CrossRef CAS PubMed.
- C. V. Robinson, Proc. Natl. Acad. Sci. U. S. A., 2019, 116, 2814–2820 CrossRef CAS PubMed.
- G. Vadlamani, M. D. Thomas, T. R. Patel, L. J. Donald, T. M. Reeve, J. Stetefeld, K. G. Standing, D. J. Vocadlo and B. L. Mark, J. Biol. Chem., 2015, 290, 2630–2643 CrossRef CAS PubMed.
- H. Meng, S. Deo, S. Xiong, E. Dzananovic, L. J. Donald, C. W. van Dijk and S. A. McKenna, J. Mol. Biol., 2012, 422, 635–649 CrossRef CAS PubMed.
- V. I. Kozlovski, L. J. Donald, V. M. Collado, V. Spicer, A. V. Loboda, I. V. Chernushevich, W. Ens and K. G. Standing, Int. J. Mass Spectrom., 2011, 308, 118–125 CrossRef CAS.
- N. Mishra, M. Spearman, L. Donald, H. Perreault and M. Butler, J. Biotechnol., 2020 DOI:10.1016/j.btecx.2020.100015.
- V. S. Tayi and M. Butler, Biotechnol. J., 2018, 13, e1700381 CrossRef PubMed.
- V. S. Tayi and M. Butler, J. Biol. Methods, 2015, 2, e19 CrossRef.
- M. Collin, O. Shannon and L. Bjorck, Proc. Natl. Acad. Sci. U. S. A., 2008, 105, 4265–4270 CrossRef PubMed.
- X. Tong, T. Li, J. Orwenyo, C. Toonstra and L. X. Wang, Bioorg. Med. Chem., 2018, 26, 1347–1355 CrossRef CAS PubMed.
- C. D. Rillahan, A. Antonopoulos, C. T. Lefort, R. Sonon, P. Azadi, K. Ley, A. Dell, S. M. Haslam and J. C. Paulson, Nat. Chem. Biol., 2012, 8, 661–668 CrossRef CAS PubMed.
- L. J. Donald, H. W. Duckworth and K. G. I. Standing, in Cell Biology: A Laboratory Handbook, ed. J. Celis, Elsevier Science Inc., San Diego, 2rd edn, 2006 Search PubMed.
- A. V. Loboda, S. Ackloo and I. V. Chernushevich, Rapid Commun. Mass Spectrom., 2003, 17, 2508–2516 CrossRef CAS PubMed.
- A. V. Loboda, A. N. Krutchinsky, M. Bromirski, W. Ens and K. G. Standing, Rapid Commun. Mass Spectrom., 2000, 14, 1047–1057 CrossRef CAS PubMed.
- R. J. Harris, J. Chromatogr. A, 1995, 705, 129–134 CrossRef CAS PubMed.
- S. Saito, K. Yano, S. Sharma, H. E. McMahon and S. Shimasaki, Protein Sci., 2008, 17, 362–370 CrossRef CAS PubMed.
- O. V. Krokhin, W. Ens and K. G. Standing, Rapid Commun. Mass Spectrom., 2003, 17, 2528–2534 CrossRef CAS PubMed.
- O. Krokhin, W. Ens, K. G. Standing, J. Wilkins and H. Perreault, Rapid Commun. Mass Spectrom., 2004, 18, 2020–2030 CrossRef CAS PubMed.
- A. Nguyen Dang, M. Mun, C. M. Rose, P. Ahyow, A. Meier, W. Sandoval and I. H. Yuk, Biotechnol. Bioeng., 2019, 116, 831–845 CAS.
- R. Upton, L. Bell, C. Guy, P. Caldwell, S. Estdale, P. E. Barran and D. Firth, Anal. Chem., 2016, 88, 10259–10265 CrossRef CAS PubMed.
- N. S. Ranbaduge, H. Y. Shion, Y. Q. Yu and W. Chen, Proceedings of the 66th ASMS Conference on Mass Spectrometry and Allied Topics, San Diego, CA, 2018.
- K. L. Bennett, S. V. Smith, R. M. Lambrecht, R. J. Truscott and M. M. Sheil, Bioconjugate Chem., 1996, 7, 16–22 CrossRef CAS PubMed.
- J. He, D. Su, C. Ng, L. Liu, S. F. Yu, T. H. Pillow, G. Del Rosario, M. Darwish, B. C. Lee, R. Ohri, H. Zhou, X. Wang, J. Lu, S. Kaur and K. Xu, Anal. Chem., 2017, 89, 5476–5483 CrossRef CAS PubMed.
- G. T. Roman and J. P. Murphy, The Analyst, 2017, 142, 1073–1083 RSC.
- C. J. Brown, D. W. Woodall, T. J. El-Baba and D. E. Clemmer, J. Am. Soc. Mass Spectrom, 2019, 30, 2438–2445 CrossRef CAS PubMed.
- S. Ambrose, N. G. Housden, K. Gupta, J. Fan, P. White, H. Y. Yen, J. Marcoux, C. Kleanthous, J. T. S. Hopper and C. V. Robinson, Angew. Chem., Int. Ed., 2017, 56, 14463–14468 CrossRef CAS PubMed.
- K. Rajabi, A. E. Ashcroft and S. E. Radford, Methods, 2015, 89, 13–21 CrossRef CAS PubMed.
- B. T. Chait, M. Cadene, P. D. Olinares, M. P. Rout and Y. Shi, J. Am. Soc. Mass Spectrom, 2016, 27, 952–965 CrossRef CAS PubMed.
- J. F. Jacobs, R. A. Wevers, D. J. Lefeber and M. van Scherpenzeel, Clin. Chim. Acta, 2016, 461, 90–97 CrossRef CAS PubMed.
- S. J. Davis, E. A. Davies, A. N. Barclay, S. Daenke, D. L. Bodian, E. Y. Jones, D. I. Stuart, T. D. Butters, R. A. Dwek and P. A. van der Merwe, J. Biol. Chem., 1995, 270, 369–375 CrossRef PubMed.
- V. T. Chang, M. Crispin, A. R. Aricescu, D. J. Harvey, J. E. Nettleship, J. A. Fennelly, C. Yu, K. S. Boles, E. J. Evans, D. I. Stuart, R. A. Dwek, E. Y. Jones, R. J. Owens and S. J. Davis, Structure, 2007, 15, 267–273 CrossRef CAS PubMed.
- S. R. Hanson, E. K. Culyba, T. L. Hsu, C. H. Wong, J. W. Kelly and E. T. Powers, Proc. Natl. Acad. Sci. U. S. A., 2009, 106, 3131–3136 CrossRef CAS PubMed.
- K. A. Johnson, K. Paisley-Flango, B. S. Tangarone, T. J. Porter and J. C. Rouse, Anal. Biochem., 2007, 360, 75–83 CrossRef CAS PubMed.
- K. Brorson and A. Y. Jia, Curr. Opin. Biotechnol., 2014, 30, 140–146 CrossRef CAS PubMed.
Footnote |
| † Current address: Horizon Discovery, 8100 Beach Drive, Waterbeach, CB25 9TL, UK. |
| This journal is © The Royal Society of Chemistry 2020 |