
pH-Response of polycation/Ti3C2Tx MXene layer-by-layer assemblies for use as resistive sensors†
Ian J.
Echols
a,
Hyosung
An
a,
Xiaofei
Zhao
a,
Evan M.
Prehn
b,
Zeyi
Tan
b,
Miladin
Radovic
*b,
Micah J.
Green
 *ab and
Jodie L.
Lutkenhaus
*ab
*ab and
Jodie L.
Lutkenhaus
*ab
aArtie McFerrin Department of Chemical Engineering, Texas A&M University, College Station, TX, USA. E-mail: Jodie.lutkenhaus@tamu.edu; Micah.green@tamu.edu
bDepartment of Materials Science and Engineering, Texas A&M University, College Station, TX, USA. E-mail: Mradovic@tamu.edu
First published on 11th December 2019
Abstract
The importance and widespread need for accurate pH monitoring necessitates the fabrication of new pH sensors with high sensitivity that can be used in a variety of environments. However, typical pH sensors have certain limitations (e.g., glass electrodes are fragile and require consistent upkeep, colorimetric pH strips are single use and inaccurate). Herein, we examine the pH-response of multilayers consisting of Ti3C2Tx nanosheets and polycations fabricated using layer-by-layer (LbL) assembly. The MXene sheets themselves are pH-responsive due to their hydroxyl surface groups, and this effect may be amplified with the choice of an appropriate polycation. Specifically, the performance of multilayers assembled with the strong electrolyte poly (diallyldimethylammonium) (PDADMA) or pH-sensitive branched polyethylenimine (BPEI) is compared. As expected, the use of a pH-sensitive constituent leads to a 464% increase in pH sensitivity (116 kΩ pH−1 unit vs. 25 kΩ pH−1 unit) as compared to PDADMA. This is due to the conformational changes that BPEI undergoes with (de)protonation as pH changes. Further comparisons with reduced graphene oxide (rGO), which is far less pH responsive, confirm the unique pH responsivity of MXene nanosheets themselves. The ability to enhance response to particular stimuli by changing the constituent polycation demonstrates promise for future use of MXenes in resistive sensors for a variety of stimuli.
 Jodie L. Lutkenhaus | Jodie L. Lutkenhaus is the William and Ruth Neely Faculty Fellow and Professor in the Artie McFerrin Department of Chemical Engineering at Texas A&M University. Lutkenhaus received her B.S. in 2002 from The University of Texas at Austin and her PhD in 2007 from Massachusetts Institute of Technology. Lutkenhaus then studied as a post-doctoral researcher at The University of Massachusetts Amherst. Current research areas include polyelectrolyte complexes, redox-active polymers, sensors, and energy storage. She has been recognized as a World Economic Forum Young Scientist and a Kavli Fellow. Lutkenhaus is the Deputy Editor of ACS Applied Polymer Materials. |
Design, System, ApplicationMXenes, a family of two-dimensional metal carbides, have drawn increasing interest for use as sensors due to their metal-like conductivity and surface functional groups. In this work, we employed layer-by-layer (LbL) assembly to fabricate uniform polycation/MXene thin films with different polycations. We then exposed the fabricated films to environments of varying pH to determine the usable range and pH response of the films. This resulted in a pH range limited by the oxidative stability of the MXenes and a linear increase in resistance with pH over the usable range. By comparing thin films assembled with either a pH-insensitive or a pH-sensitive polycation, we were able to determine both the pH sensitivity of the MXene itself and the benefits of a pH-sensitive polycation. These results were further compared to similar films containing reduced graphene oxide instead of MXenes. This work demonstrates the ability to enhance sensitivity of MXene based films by using a pH sensitive polycation and generates promise for tailoring future LbL polycation/MXene sensors to specific analytes such as VOC's and biomolecules. |
1. Introduction
The ability to measure and regulate pH is necessary for a variety of applications including soil and water quality control, wound healing, and pH-sensitive reaction media.1–5 Due to the wide range of environments in which pH sensing is required, a variety of pH sensor-types are needed. The two most commonly used methods of measuring pH values are glass electrodes and single-use pH strips.6 However, these two methods both have shortcomings. The former is fragile and unreliable for highly basic or acidic solutions.7 Additionally, the sensitivity is limited by the Nernstian response (59.5 mV pH−1) and is temperature sensitive by the same relationship.8,9 The latter, while easy to use, does not provide precise pH values as it relies on a colorimetric response.10 While new types of potentiometric sensors are still popularly explored as pH sensors, they share the temperature-dependent response of glass electrodes and are typically benchmarked by a Nernstian response, although some exceptions exist.11–15An alternative approach explored herein is resistive sensors. This sensor type relies on a change in electrical properties in response to environmental stimuli. As such, materials used in the fabrication of resistive sensors are ideally highly conductive and have functional surface groups that can interact with the surrounding environment. One such material that satisfies both requirements is Ti3C2Tx, a 2D-nanomaterial in the MXene family. As the most commonly used MXene to date, Ti3C2Tx nanosheets have demonstrated a conductivity of 240![[thin space (1/6-em)]](https://www.rsc.org/images/entities/char_2009.gif) 000 S m−1 and have numerous hydroxyl surface groups.16,17
000 S m−1 and have numerous hydroxyl surface groups.16,17
MXenes with the chemical formula Mn+1XnTz are obtained by the selective etching of the ‘A’ element from a MAX phase material, in which A is a group 13 or 14 transition metal, M is a transition metal, X is either carbon or nitrogen, T is a surface terminal group (e.g., –OH, –O, and –F), and n is 1, 2, or 3.18–20 MXenes have been used for a variety of applications including energy storage, catalysis, membrane separation, and sensing.21–34 These applications are possible due to the intercalation of ions between the 2D nanosheets, high conductivity, abundance of hydroxyl sites, and high surface to volume ratio.21,35–38
However, a major drawback of MXenes is their proclivity to oxidation when exposed to water.39–42 Oxidation of Ti3C2Tx to TiO2 leads to noticeable degradation in conductivity, flocculation of the colloidal dispersion, and -ultimately- complete conversion to TiO2.39,40 This greatly impedes the shelf life of MXenes and their longevity in devices. Our team has demonstrated that anti-oxidants (e.g., sodium L-ascorbate (NaAsc)) mitigate the effects of oxidation for Ti3C2Tx.43 Adding an antioxidant enables the retention of Ti3C2Tx conductivity in MXene films for at least three weeks.43 This considerable increase in shelf life enables the use of MXenes in different applications. The new-found stability motivates us to investigate the resistive pH-response of Ti3C2Tx nanosheets when assembled with various polycations into thin films.
The colloidal pH-response of MXenes in a dispersion has been explored, but the changes in electrical properties in response to pH have not been explored in depth.3,44–46 For example, Natu et al. reported on the acid- and base-induced crumpling of Ti3C2Tx.44,45 Natu et al. also demonstrated a pH dependence of both zeta potential and hydrodynamic size for Ti3C2Tx.44 This is attributed to the (de)protonation of the hydroxyl surface groups of the MXene and creates promise for use of Ti3C2Tx for pH sensing. Recently, drop-cast Ti3C2Tx films and quantum dots have successfully been used to fabricate potentiometric and photoluminescent pH sensors, supporting the pH sensitivity of Ti3C2Tx.3,46
Here, we explore the layer-by-layer (LbL) assembly of Ti3C2Tx nanosheets with two different polycations and observe the resistive response of the resulting multilayers to aqueous solutions of various pH values. LbL assembly is selected as the processing method because it forms conformal coatings that have already demonstrated utility as strain and humidity sensors.25,26 This potentially allows for the fabrication of thin films on a variety of substrates including glass, polyethylene terephthalate (PET), polydimethylsiloxane (PDMS), fibers, and fabrics, regardless of topography.26 Cai et al. recently showed the benefits of LbL assembly over direct mixing when fabricating thin films, in which ordered structures obtained using LbL assembly prevented restacking of MXene nanosheets and improved recoverability of the sensors.24
Two polycations are explored in this work: poly(diallyldimethylammonium) (PDADMA) and branched polyethylenimine (BPEI). As PDADMA is a “strong” electrolyte, its linear charge density does not fluctuate with pH.47 Therefore, it is assumed that the resulting resistive response of PDADMA/Ti3C2Tx assemblies is attributed solely to the MXene itself. We compare this to sensors containing BPEI, which is considered a pH-sensitive “weak” polyelectrolyte,15 instead of PDADMA. As demonstrated for polyaniline-based pH sensors, we expect that BPEI will contribute to pH sensitivity due to (de)protonation of its amine groups.48 BPEI bears three amine groups, which each have unique pKa values (4.5 for primary amine, 6.7 for secondary amine, and 11.6 for tertiary amine). In LbL assemblies (all-polymer, no MXenes), varying pH leads to conformational changes for BPEI, resulting in changes in the thin film thickness.49–51 This is due to chain elongation of BPEI at low pH, resulting in minimal contribution of the polymer to film thickness. The opposite occurs at high pH. For BPEI/Ti3C2Tx assemblies, we hypothesized that pH would influence both the MXenes (by changing the MXene surface chemistry) and the BPEI layers (by changing the chain conformation), manifesting in compounded changes in resistance. Finally, the results are compared to LbL assemblies containing reduced graphene oxide (rGO) in place of the MXene as a control. As rGO has fewer hydroxyl functional groups as compared to Ti3C2Tx MXene, rGO is expected to have negligible influence on pH sensitivity. Ideally, comparing PDADMA/Ti3C2Tx and PDADMA/rGO assemblies will highlight the pH sensitivity of the MXene. On the other hand, comparing PDADMA/Ti3C2Tx and BPEI/Ti3C2Tx assemblies will demonstrate the added pH sensitivity of BPEI as compared to PDADMA.
2. Experimental
2.1 Materials
Titanium (Ti, 44 μm particle size, 99.5% purity), titanium carbide powders (TiC, 2–3 μm particle size, 99.5% purity), aluminium (Al, 44 μm particle size, 99.5% purity), hydroiodic acid (HI, 55%), lithium fluoride (LiF, >98% purity), and silver conductive adhesive paste (sheet resistance <0.025 Ω/□ at 0.001 in thick) were acquired from Alfa Aesar. Slide glass (75 × 25 × 1 mm), 5 MHz Ti/Au quartz crystal substrates, acetone (>99.5%), and isopropyl alcohol (IPA, 99% purity) were obtained from VWR. Poly(diallyldimethyl ammonium chloride) (PDADMAC, MW = 200000 to 350000 g mol−1, 20 wt% in water), branched polyethyleneimine (BPEI, MW = 25000 g mol−1, MN = 10000 g mol−1), dimethyl sulfoxide (DMSO, ReagentPlus, >99.5%), hydrochloric acid (HCl, ACS reagent, 37% w/w), sodium hydroxide (NaOH), potassium permanganate (KMnO4), sodium nitrate (NaNO3), and sodium L-ascorbate (NaAsc) were purchased from Sigma-Aldrich. Type E polytetrafluoroethylene (PTFE) and 18 American Wire gauge (awg) 19 Strands (silver plated copper wire) were purchased from WesBell Electronics, Inc. Sulfuric acid (H2SO4, 95–98%), potassium hydroxide (KOH), and hydrogen peroxide (H2O2, 30%) were purchased from BDH. Graphite (SP-1) was purchased from Bay Carbon. Melinex ST505 (polyethylene terephthalate substrates) was purchased from Tekra. Si wafers were purchased from University Wafer. 18.2 MΩ cm (Milli-Q) water was obtained using a Milli-Q integral water purification system for Ultrapure Water. All materials were used as received.
2.2 Nanomaterial synthesis
Ti3AlC2 MAX powder and Ti3C2Tx were synthesized following a previously reported procedure.26 The procedure is described in detail in the ESI.† Ti3C2Tx dispersion concentration was determined by vacuum filtration of a known volume of dispersion. NaAsc dissolved in water was added to the dispersion to obtain a final concentration of 0.5 mg mL−1 of Ti3C2Tx and 1 mg mL−1 of NaAsc. Atomic force microscopy (Bruker Dimension Icon AFM) of drop-cast Ti3C2Tx verified the lateral size and thickness of a typical nanosheet (Fig. S1a and c†). A lateral size of 0.6 to 2.3 μm was observed along with a sheet thickness of 1 nm, which is in agreement with a single layer of Ti3C2Tx.52 From dynamic light scattering (DLS, Malvern Zetasizer Nano ZS), the hydrodynamic radius of Ti3C2Tx was measured to be 304 nm (Fig. S2a†). Zeta potential of the Ti3C2Tx dispersion was −46.1 mV (Fig. S2b†).A batch of 0.5 mg mL−1 GO dispersion was synthesized following previous reports and the modified Hummers' method, see ESI.†53,54 This method resulted in nanosheets with a lateral size of 0.3 to 0.7 μm and a sheet thickness of 0.9 nm (Fig. S1b and d†). While the nanosheet thicknesses of both nanomaterials were similar, there was visible aggregation of the GO nanosheets.
2.3 Sensor assembly
Polycation/Ti3C2Tx multilayers on slide glass, Si, PET, and quartz crystal substrates were prepared using LbL assembly following previous reports.25,26 Glass and PET substrates were cut to dimensions of 50 × 12.5 × 1 mm. Glass substrates were cleaned using bath sonication in IPA for 15 minutes followed by washes with acetone and water. PET, Si, and quartz crystal substrates were cleaned using water and IPA. Four lines of tape (1 mm × 20 mm) were placed on the PET substrates to create a U-shaped pathway. The cleaned substrates were then plasma treated (Harrick PDC-32G) for 3 minutes. As shown in Fig. 1, the plasma treated substrates were submerged in a 1 mg mL−1 solution of the polycation, either pH 7.8 PDADMAC or pH 5 BPEI, for 15 minutes. PDADMA was used at its natural pH, and the pH of BPEI was adjusted using 0.05 M aliquots of HCl. The substrates were then submerged in Milli-Q water for 1 minute. This was repeated twice, and the substrates were then dried with compressed air. The substrates were then submerged in the 0.5 mg mL−1 Ti3C2Tx dispersion for 15 minutes, followed by the same washing and drying steps. This constituted one layer pair (LP) and was repeated up to five times. Coated PET substrates were subsequently cut into four strips (0.31 cm × 2.5 cm). Silver-coated copper wires were placed at the opposite ends of the ‘U' and attached using silver paste. The paste was then dried for 6 hours in a vacuum oven at room temperature to obtain the resistive sensors. The final path length of the sensor was 4.1 cm with a width of 0.11 cm. The coated surface area was about 0.58 cm2.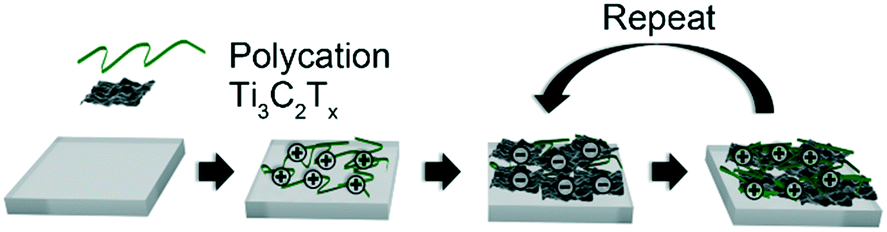 | ||
| Fig. 1 Schematic of layer-by-layer assembly procedure used to make thin films. A substrate (gray) is alternately exposed to solutions and dispersion of polycation and Ti3C2Tx nanosheets, respectively. Each cycle constitutes a layer pair (LP), and the process was repeated until the desired number of LPs was attained. | ||
Due to the hydrophilic nature and ease of processability of graphene oxide (GO), rGO-based multilayers were prepared by the chemical reduction of GO-based multilayers.54 HI vapor was used to reduce GO-based multilayers following a previously reported procedure.54 1 mL of 55% HI (aq.) was added to a glass petri dish along with the GO-based multilayer. The petri dish was covered with a secondary petri dish to prevent loss of HI vapor and then heated for 8 minutes at 90 °C. The reduced film was washed with ethanol and made into sensors as described previously.
Ti3C2Tx-only films were prepared by spray-coating onto PET substrates, combining the procedures of Zhao et al. and De et al.54,55 A 0.5 mg mL−1 dispersion of Ti3C2Tx was sprayed onto the substrate while maintaining a vertical distance of 15 cm and nozzle pressure of 80 psi. This continued for 8 minutes with constant movement (1 cm s−1) over the substrate. The spray-coated substrate was then fabricated into sensors.
2.4 Characterization
X-ray powder diffraction (XRD, Bruker D8 powder X-ray diffractometer fitted with LynxEye detector), scanning electron microscopy (SEM, JEOL JSM-7500F), and X-ray photoelectron spectroscopy (XPS, Omicron XPS/UPS system with Argus detector) were used for characterization. Samples consisted of freeze-dried MXenes and LbL sensors before and after testing. Samples were dried under vacuum at room temperature for three days prior to XPS measurements to prevent outgassing and were then used as-is. AFM samples were prepared by drop casting dilute nanomaterial dispersions onto mica.Growth profiles were obtained for all multilayers fabricated. Measurements for GO multilayers were taken prior to reduction. Film thickness and root mean square (RMS) roughness (Rq) were measured using profilometry (KLA Tencor D-100) for LbL films on glass substrates. Thickness was verified using ellipsometry (LSE Stokes Ellipsometer) for LbL films on Si substrates. Absorbance was measured using spectrophotometry (Shimadzu SolidSpec-3700 UV-vis-NIR) of LbL films on glass. A quartz crystal microbalance (QCM, MAXTEK RQCM Research) was used to measure film composition from coatings on 5 MHz Ti/Au quartz crystal substrates. Frequency was measured after every deposition, and mass deposited was calculated from the change in frequency using the Sauerbrey equation.56
2.5 pH response testing
Once sensors were prepared, they were submerged in Milli-Q water for 24 hours to allow the multilayers to equilibrate. This time was increased to 120 hours for rGO-based multilayers.57 After swelling, the sensor was submerged in 150 mL of Milli-Q water. pH and resistance were recorded using a commercial pH probe (Beckman Model 350 pH/Temp/mV Meter) and a multimeter (Dawson DDM645, DC Voltage 1000 V), respectively. pH was adjusted from pH 3 to pH 7 using 0.05 M solutions of HCl and NaOH, and resistance was recorded in situ after a minimum of 10 minutes to allow the readings adequate time to equilibrate. The figure of merit, pH sensitivity, was calculated by two means: as the change in resistance over the change in pH (eqn (1)) or as the percent change in resistance over the change in pH (eqn (2)). Each equation normalizes the resistance against the resistance at pH 3.All measurements were taken at room temperature.
 | (1) |
 | (2) |
3. Results and discussion
3.1 MXene characterization
Fig. 2a shows XRD patterns of the parent MAX phase, Ti3AlC2, and the Ti3C2Tx nanosheets. Typical (002) MAX phase and (002) MXene peaks were observed at 2θ ∼ 10° and 2θ ∼ 7°, respectively.43 The decrease in the (002) peak angle was due to the larger interlayer spacing after the successful removal of Al from Ti3AlC2, which indicated successful etching. The SEM image in Fig. 2b displays the morphology of the nanosheets as opposed to the typical ‘accordion’ structure of Ti3C2Tx clay.58 The small white dots on the sheet are TiO2 which formed due to the minor oxidation of Ti3C2Tx during the synthesis and freeze-drying processes. Colloidal stability of the MXene and GO dispersions was verified by the Tyndall effect (Fig. 2c and d).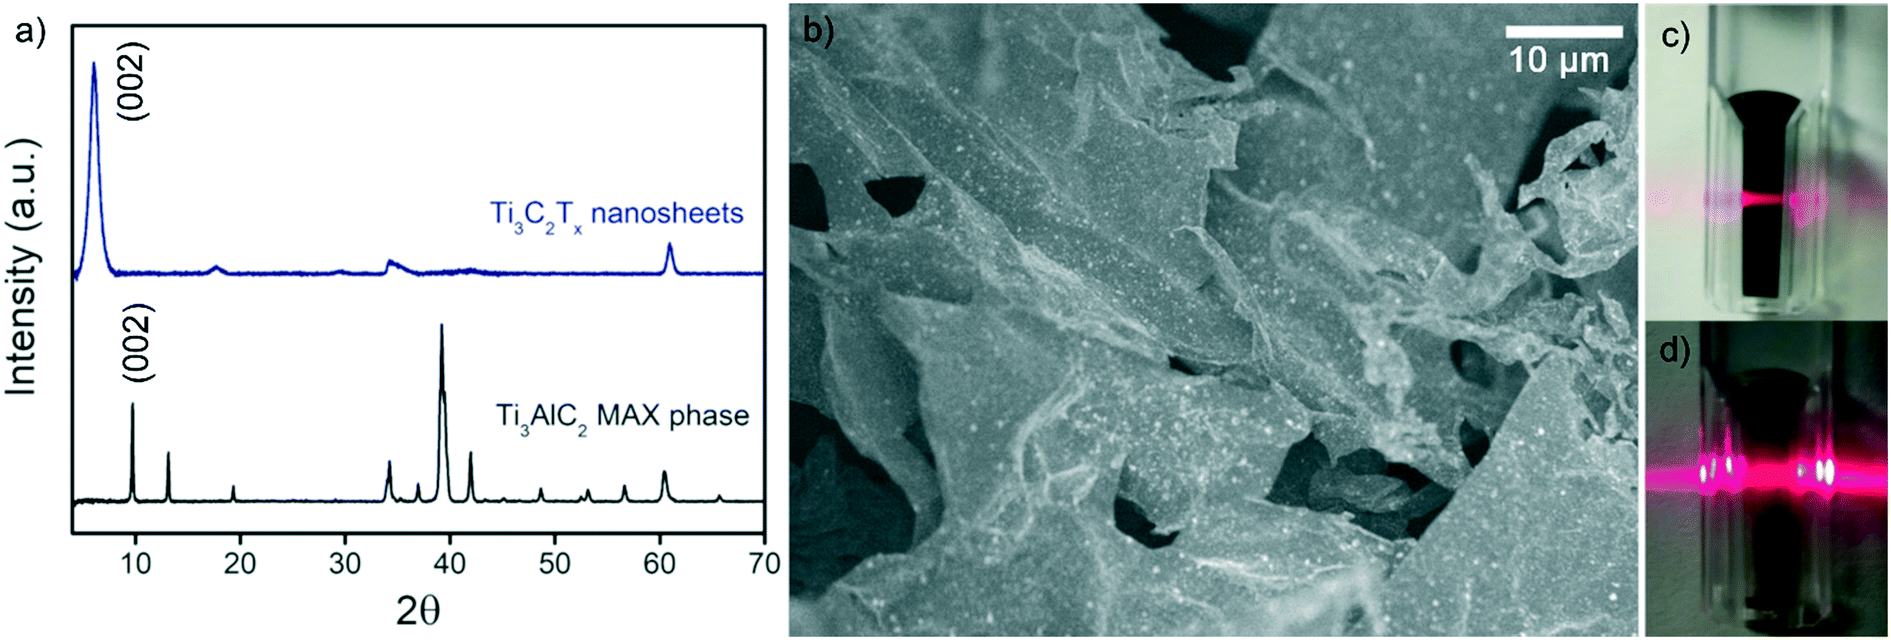 | ||
| Fig. 2 (a) XRD of Ti3C2Tx nanosheets and Ti3AlC2 MAX phase. (b) SEM image of Ti3C2Tx nanosheets. Digital images of colloidal solutions of (c) Ti3C2Tx and (d) GO demonstrating the Tyndall effect. | ||
XPS verified the composition of the Ti3C2Tx MXenes. A survey scan (Fig. S3†) indicated the presence of the expected Ti 2p, C 1s, O 1s, and F 1s peaks associated with Ti3C2Tx. Peak fitting for each of these components is shown in Fig. S4,† and binding energy, atomic percent (at%), and full width half maximum (FWHM) are summarized in Table S1.† For Ti 2p, the Ti2+ (456.1 eV, 461.5 eV) and Ti3+ (457.9 eV, 463 eV) components correspond to the functional surface groups of the MXene (–OH, –O, and –F).43,59 The peaks at 455.2 and 460.3 eV correspond to Ti–C. Together, these peaks indicate the successful etching of the MAX phase into Ti3C2Tx. The C–OH peak (288.0 eV) of the C 1s spectra is present due to the interaction of NaAsc with the nanosheets, indicating the presence of NaAsc.43 The TiO2 peak (529.7 eV) of the O 1s spectra occurs due to the oxidation of Ti3C2Tx. The degree of oxidation is limited (11 at% of the Ti 2p spectra) and verifies the anti-oxidant properties of NaAsc, consistent with our previous findings.43 The amount of oxidation of the native Ti3C2Tx MXene will vary depending on storage time and conditions.
3.2 Layer-by-layer growth
Successful layer growth of the polycation/Ti3C2Tx multilayer was verified by thickness and absorbance observations. As more layer pairs (LPs) were successfully deposited, the thickness and absorbance of the multilayers underwent a linear increase. This was first verified using profilometry to measure thickness and roughness of the multilayers from one to five LPs on glass substrates (Fig. 3a). (PDADMA/Ti3C2Tx)y films grew as 8.8 nm per LP, whereas (BPEI/Ti3C2Tx)y films grew as 4.2 nm per LP. (The subscript “y” indicates the number of LPs.) From the observed MXene sheet thickness from AFM, approximately 9 and 4 sheets were deposited per LP for sensors with PDADMA and BPEI, respectively, excluding the polyelectrolyte contribution.52 The profilometric root-mean-square film roughness (Rq) was measured as well (Fig. 3b). The Rq values (∼20 nm for MXene multilayers containing PDADMA and ∼10 nm for MXene multilayers containing BPEI) indicate successful assembly of relatively smooth thin films.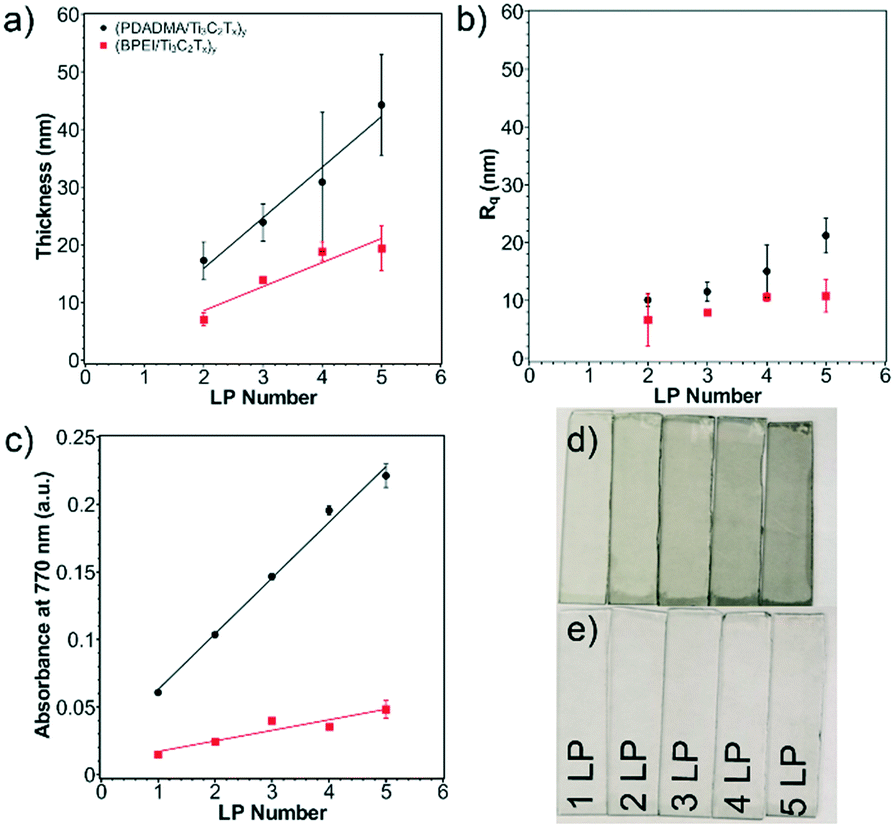 | ||
| Fig. 3 (a) Profilometric thickness, (b) profilometric roughness, and (c) UV-vis absorbance at 770 nm of Ti3C2Tx multilayers. Thickness grew as 8.8 nm per LP and 4.2 nm per LP for (PDADMA/Ti3C2Tx)y and (BPEI/Ti3C2Tx)y, respectively. Absorbance at 770 nm grew as 0.04 a.u. per LP and 0.01 a.u. per LP for (PDADMA/Ti3C2Tx)y and (BPEI/Ti3C2Tx)y, respectively. Digital images of (d) (PDADMA/Ti3C2Tx)y and (e) (BPEI/Ti3C2Tx)y multilayers. | ||
The linear growth was verified using ellipsometry on silicon substrates (Fig. S5a†). Despite lower growth rates as compared to profilometry measurements (3.1 nm per LP from ellipsometry vs. 8.8 nm per LP from profilometry in the case of (PDADMA/Ti3C2Tx)y multilayers), the linear growth profile of the films was confirmed. The difference in the magnitude of layer growth can be attributed to the indirect measurement method of ellipsometry and the interference of the MXene with the polarized light source.
Linear growth was additionally verified using spectrophotometry on coated glass substrates (Fig. 3c and S6a and b†). Digital images of the multilayers are shown in Fig. 3d and e. The absorbance of note was taken at 770 nm following previous reports.25 Absorbance of the films at 770 nm grew as 0.04 a.u. per LP for (PDADMA/Ti3C2Tx)y films and 0.01 a.u. per LP for (BPEI/Ti3C2Tx)y films. Subsequently, the linear increase in absorbance was then correlated with the thickness to create an empirical relationship between the two. This enabled later thickness measurements for substrates on which profilometry was not possible (e.g., PET substrates). QCM measurements on the Ti/Au quartz crystal were used to determine the mass composition of the polycation/Ti3C2Tx multilayers (Fig. S5c†). From this, a mass composition of 5.5% PDADMA and 94.5% Ti3C2Tx was calculated for (PDADMA/Ti3C2Tx)y multilayers. (BPEI/Ti3C2Tx)y multilayers were determined to consist of 9.3 wt% BPEI and 90.7 wt% Ti3C2Tx. In both cases, Ti3C2Tx dominates the growth of the film, verifying the assumption that layer growth can be primarily attributed to the MXene sheets.
3.3 pH response
Sensors utilized assemblies of 5 LPs, corresponding to a sensor thicknesses of 44 nm for (PDADMA/Ti3C2Tx)5 and 19 nm for (BPEI/Ti3C2Tx)5. 5 LP films were chosen to ensure lateral percolation of Ti3C2Tx. Kim et al. recently demonstrated that thinner films resulted in enhanced sensor performance.31 As such, films above 5 LP were not considered. Additionally, there is a trade-off between fabrication time and LP number that resulted in thicker films being impractical.To determine the viable range for pH response testing, a wide pH range (3–10) was first examined (Fig. S7a†). There was a drastic increase in resistance as the Ti3C2Tx multilayers were exposed to basic conditions. The increase is attributed to the rapid oxidation of Ti3C2Tx, which resulted in a noticeable color change upon exposure to basic conditions (pH ∼10) for 24 hours (Fig. S7c†). While this may seem an extended period, all films were exposed to a neutral environment (Milli-Q water) for 24 hours prior to testing to allow for swelling of the multilayers and did not undergo any notable color change. Given the increased rate of oxidation in basic environments, the pH range tested was restricted to pH 3 to pH 7.
Sensor performance was quantified by the pH sensitivity. A representative (PDADMA/Ti3C2Tx)5 sensor was tested first to determine the contribution of Ti3C2Tx to the pH response (Fig. 4a). The initial resistance of the film when exposed to pH 3 was 118 kΩ. As pH increased from 3 to 7, the resistance increased as 23 kΩ pH−1 (19.4 % pH−1). When decreasing pH back to pH 3, there was slight hysteresis – a typical observation for resistive sensors.7 Due to the hysteresis, the cycles were split based on whether pH was increasing or decreasing to determine repeatability (e.g., pH 3 → pH 7 and pH 7 → pH 3). While the sensitivity increases to 28 kΩ pH−1 by the third cycle, there is good overlap in response for pH 3 → pH 7 in Cycles 1 and 3. Using a 95% confidence interval, the sensitivity of the film was determined to be 24.8 ± 2.6 kΩ pH−1. Profilometric thickness was measured before and after pH response tests to determine recoverability of thickness. Thickness changed from 40.6 ± 10.9 nm to 43.7 ± 9.6 nm, suggesting the reversibility of the response.
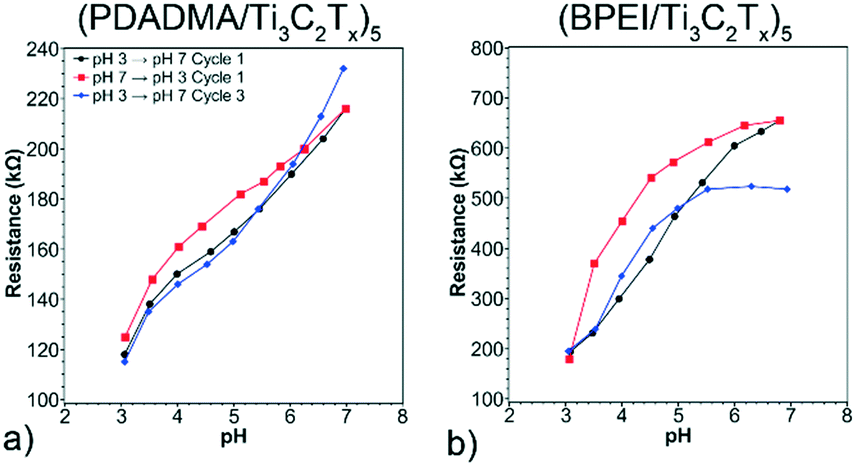 | ||
| Fig. 4 pH Response of (a) (PDADMA/Ti3C2Tx)5 and (b) (BPEI/Ti3C2Tx)5 sensors. The pH sensitivity was 24.8 ± 2.6 kΩ pH−1 for (a). The pH sensitivity was 115.7 ± 20.8 kΩ pH−1 for (b). | ||
A representative (BPEI/Ti3C2Tx)5 sensor was then examined to determine if a pH sensitive polycation would enhance sensitivity. The initial resistance of this film at pH 3 was 194 kΩ. The higher value of initial resistance as compared to (PDADMA/Ti3C2Tx)5 sensors is likely due to differences in thicknesses of the two films. Resistance is inversely proportional to thickness. As with the previous sensors, there was noticeable hysteresis when comparing response curves for increasing and decreasing pH. In this case, the initial pH sensitivity pH 3 → 7 was 132 kΩ pH−1 (68.1% pH−1), increasing to 141 kΩ pH−1 by the third cycle. This pH sensitivity is five times higher as compared to that of (PDADMA/Ti3C2Tx)5 sensors due to the further thickness changes caused by conformational changes of BPEI with pH. Additionally, the overlap for pH 3 → pH 7 in Cycles 1 and 3 is comparable to that for (PDADMA/Ti3C2Tx)5. This indicates cyclability of the sensors up to three cycles in both cases. Using a 95% confidence interval, the sensitivity of the film was determined to be 115.7 ± 20.8 kΩ pH−1. As with the previous sensor composition, profilometric thickness was measured before and after pH response testing. In this case, thickness changed from 22.7 ± 8.8 nm to 20.3 ± 2.9 nm, which indicates the reversibility of the response.
Given the proclivity of Ti3C2Tx to oxidize, SEM and XPS were used to characterize the sensors before and after pH response testing to determine the extent of oxidation. Oxidation of the films was first demonstrated using SEM as there was noticeable TiO2 on the surface of the sensors after pH response testing (Fig. 5c and d) that was not present on as-prepared sensors (Fig. 5a and b).
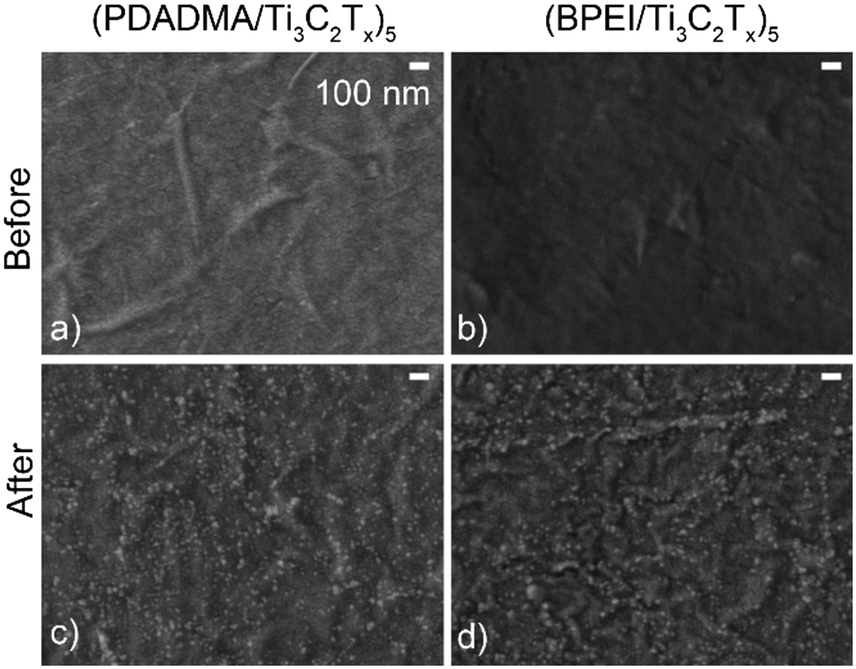 | ||
| Fig. 5 SEM images of (a and c) (PDADMA/Ti3C2Tx)5 and (b and d) (BPEI/Ti3C2Tx)5 films before (a and b) and after (c and d) pH response tests. The scale bar in (a) applies to the other panels as well. | ||
XPS survey scans (Fig. S8†) confirmed the presence of Ti 2p, C 1s, O 1s, and F 1s before and after pH response tests. Formation of TiO2 was verified by peak fitting of the Ti 2p XPS spectra for both sensors before and after testing (Fig. 6). For both sensor compositions, there is a notable peak that forms at 458.7 eV, which is indicative of considerable oxidation (∼1% to ∼50% TiO2 component at% of the Ti 2p spectra). Deconvolution of the other components (Fig. S9 and S10†) supports the claim that oxidation occurred. For C 1s, there is a notable decrease in the C–Ti–Tx component peaks. For F 1s, the C–Ti–Fx peak becomes noticeably smaller and much closer in area to the AlFx peak. All XPS peak fitting results for the sensors are presented in Tables S2–S5† along with the full width half maximums (FWHM) and component at%. This oxidation likely contributed to resistance drift in the sensors from cycle to cycle.
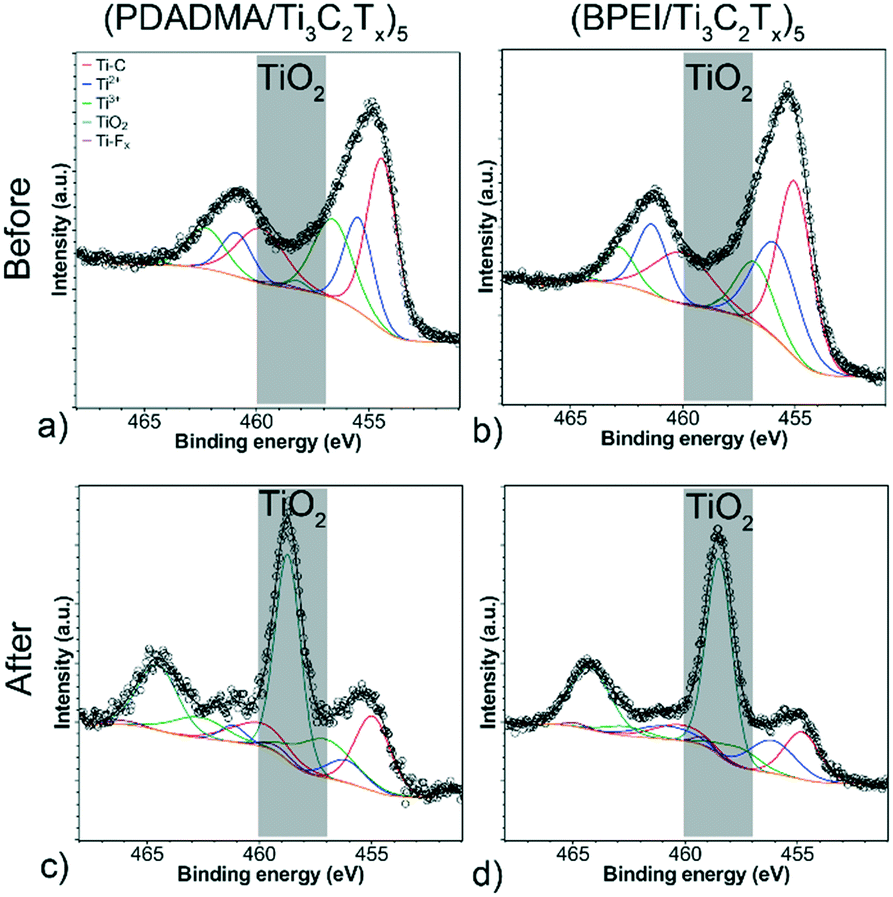 | ||
| Fig. 6 Deconvoluted Ti 2p XPS spectra of (a and c) (PDADMA/Ti3C2Tx)5 and (b and d) (BPEI/Ti3C2Tx)5 before (a and b) and after (c and d) pH response tests. | ||
The response for (PDADMA/Ti3C2Tx)5 sensors is attributed to (de)protonation of the hydroxyl surface groups of Ti3C2Tx. Due to changes in the net surface charge of the Ti3C2Tx nanosheets and the changes in the degree of protonation of the hydroxyl surface groups, the magnitude of electrostatic attraction/repulsion and the available number of charge carrier sites will vary, causing the observed changes in resistance. This mechanism is similar to that of graphene where H3O+ and OH− adsorb to surface sites.7 Recently, Natu et al. showed a linear decrease in zeta potential with pH over the pH range 2 to 7.44 The linear change in zeta potential supports the moderately linear pH response we observed and is in line with the proposed mechanism.
The increase in sensitivity for (BPEI/Ti3C2Tx)5 sensors is attributed to BPEI conformational changes with pH. Unlike PDADMA, BPEI is highly pH sensitive. As the exposure pH increases above the pKa values of BPEI, the degree of protonation of the amine groups will decrease, leading to decreased electrostatic repulsion. In sum, this results in a more coil-like conformation for BPEI chains at more basic pH values.60 We speculate that this will cause the distance between nanosheets to increase, causing the observed increase in resistance.25 This compounds with the resistance changes incurred by the Ti3C2Tx nanosheets, leading to the enhanced sensitivity.
The performance of sensors assembled with Ti3C2Tx without the treatment of NaAsc was evaluated to determine the effect of the added antioxidant (Fig. S11†). The pH responsivity for the first cycle was 72 kΩ pH−1 for (PDADMA/Ti3C2Tx)5 and 120 kΩ pH−1 for (BPEI/Ti3C2Tx)5 when Ti3C2Tx was not treated with NaAsc. While the pH sensitivity of the untreated (PDADMA/Ti3C2Tx)5 sensor was higher than that of the treated (PDADMA/Ti3C2Tx)5 sensor, the initial resistance was significantly higher (almost double) and the cyclability from pH 3 → pH 7 for cycle 1 to cycle 3 was considerably worse. In the case of untreated (BPEI/Ti3C2Tx)5, the pH sensitivity was similar to that of treated (BPEI/Ti3C2Tx)5. However, the initial resistance was an order of magnitude higher, and cyclability issues were also apparent.
The higher initial resistances of sensors assembled without the NaAsc treatment are attributed to oxidation of the untreated sensors prior to testing and during equilibration. The poor cyclability issues are likely caused by accelerated oxidation during testing, in which there was no residual NaAsc within the film. This leads to the conclusion that NaAsc can mitigate oxidation of the sensors (but not completely) and that Ti3C2Tx sensors treated with an antioxidant such as NaAsc are preferred.
Pure Ti3C2Tx sensors were assembled as a comparison as well. These were prepared by spraying a Ti3C2Tx dispersion onto PET to yield a film 98 nm thick. However, these sensors exhibited poor surface adhesion, similar to issues previously observed for pure Ti3C2Tx films.26 Due to the poor adhesion, spray-assembled sensors of pure Ti3C2Tx nanosheets were not tested further.
3.4 Comparison to rGO-based multilayers
Due to its similar dimensions and high conductivity, rGO-based multilayers were used as a comparison against the Ti3C2Tx-based multilayers. rGO films were prepared using GO followed by chemical reduction. (PDADMA/GO)5 and (BPEI/GO)5 films had thicknesses of 620 nm and 670 nm respectively (Fig. S12†). The obtained thicknesses and roughnesses were considerably higher than that of their Ti3C2Tx counterparts. This is due to the aggregation of GO nanosheets leading to more nanosheets being deposited per LP in a less uniform manner (Fig. S1b†).To compare against Ti3C2Tx-based sensors, rGO-based sensors were tested over the same pH range (Fig. S13†). The initial resistance of these sensors was an order of magnitude lower than that of the Ti3C2Tx counterparts, which we attributed to the higher thicknesses of the rGO-based sensors. As with Ti3C2Tx-based multilayer sensors, there was noticeable hysteresis when comparing cycles in which pH increased vs. decreased. For (BPEI/rGO) sensors, there were noticeable noise issues with the first cycle. As the noise issues were resolved by the second cycle, the first cycle was discarded and all other cycles were renumbered.
The overall responses of both types of rGO-based sensors were nonlinear and exhibited a significantly lower resistance change (<3 kΩ) over the entire tested pH range. Assuming a linear response (despite the obvious nonlinearity), the pH sensitivity of both rGO-based sensors was estimated as 0.6 kΩ pH−1. This was significantly lower than that of Ti3C2Tx-based sensors, but still in line with the expectation that Ti3C2Tx would be more pH-sensitive as compared to rGO because Ti3C2Tx has significantly more hydroxyl functional groups.
3.5 Comparison to resistive sensors in literature
We compare our Ti3C2Tx-based pH sensors to other resistive sensors in the literature (Table 1). To allow for comparison to all tabulated sensors, we also normalized the pH sensitivity for the Ti3C2Tx-based sensors by surface area (eqn (3)).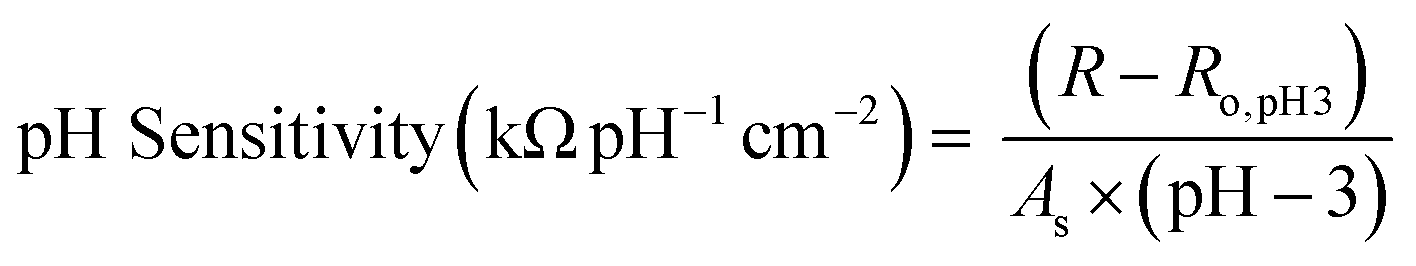 | (3) |
| Material | pH sensitivity | pH range | Reference |
|---|---|---|---|
| SWNT–PANI/PVA | 20 kΩ cm−2 pH−1 | 1–10 | 62 |
| p-SWNT–PSS/PANI | 4.56 kΩ cm−2 pH−1 acidic region | 0.95–12 | 61 |
| 20.66 kΩ cm−2 pH−1 basic region | |||
| Graphene | 2 kΩ pH−1 | 4–10 | 63 |
| MWNT | 65 Ω pH−1 | 5–9 | 64 |
| ES-PANI/PVB | 0.28 MΩ pH−1 | 1–8 | 65 |
| Pd | 5% pH−1 | 4–10 | 66 |
| MWCNT/Ni | 1% pH−1 | 2–10 | 67 |
| (PDADMA/rGO)5 | 0.6 kΩ pH−1 | 3–7 | This work |
| (BPEI/rGO)5 | 0.6 kΩ pH−1 | 3–7 | This work |
| (PDADMA/Ti3C2Tx)5 | 23 kΩ pH−1 | 3–7 | This work |
| 40 kΩ cm−2 pH−1 | |||
| 19.4% pH−1 | |||
| (BPEI/Ti3C2Tx)5 | 132 kΩ pH−1 | 3–7 | This work |
| 228 kΩ cm−2 pH−1 | |||
| 68.1% pH−1 |
There is variation in the literature on how pH sensitivity is reported, so we report our values here in these three ways (eqn (1)–(3)). pH sensitivities for (PDADMA/Ti3C2Tx)5 were 28 kΩ pH−1, 44 kΩ pH−1 cm−2, and 19.4% pH−1. pH sensitivities for (BPEI/Ti3C2Tx)5 are 132 kΩ pH−1, 228 kΩ pH−1 cm−2, and 68.1% pH−1. As compared to the other resistive sensors,61–67 the pH range of our Ti3C2Tx-based LbL sensors is generally narrower and restricted to acidic conditions. This is due to the hastened oxidation of Ti3C2Tx in basic environments.
Despite their smaller pH range, Ti3C2Tx-based LbL sensors exhibit considerably higher pH sensitivities as compared to other resistive sensors.61–64,66,67 As compared to single-walled carbon nanotube composites, the pH sensitivity is an order of magnitude higher.61,62 Both (PDADMA/Ti3C2Tx)5 and (BPEI/Ti3C2Tx)5 outperformed graphene-based sensors by one and two orders of magnitude, respectively.63 While the ES-PANI/PVB sensor had a higher reported sensitivity, the response was logarithmic and the same order of magnitude as (BPEI/Ti3C2Tx)5 sensors.59 Due to the logarithmic response, the actual sensitivity varies depending on what pH range the sensitivity is calculated over. As such, it is difficult to directly compare. We attribute our higher pH sensitivities to the abundance of surface functional groups on Ti3C2Tx and to the use of a pH-sensitive polymer.17,68,69 The proposed mechanism of pH sensitivity of graphene and other graphenic based sensors relies on interaction of the surface of graphene with OH− and H3O+ ions.7 As such, if there are more surface sites to interact with these ions, it is expected that the pH sensitivity will be higher. Cai et al. also demonstrated the benefits of the LbL structure on resistive sensor performance as compared to sensors with randomly oriented structures.24 As such, it is expected that sensors fabricated using LbL assembly will exhibit higher sensitivities than those assembled using less ordered assembly methods.63,64,66,67
4. Conclusions
LbL assembly was used to fabricate highly pH sensitive Ti3C2Tx-based resistive sensors. This assembly method allowed for controlled and linear growth of sensors with low thicknesses and roughnesses, as well as improved surface adhesion at low polymer loadings (<10%). Due to possible increases in spacing between nanosheets with increasing pH, an increase in intersheet resistance occurs, which may lead to the observed pH sensitivity of the MXene based films.25,70 The resulting resistive sensors demonstrated pH sensitivities higher than that of LbL rGO-based sensors and other resistive sensors in literature in the pH 3–pH 7 range due to the high pH sensitivity of Ti3C2Tx. The ability to enhance pH sensitivity by using a pH-sensitive polymer such as BPEI demonstrated the possibility of tuning Ti3C2Tx-based multilayers for specific applications by changing the constituent polycation. This creates promise for the application of MXene multilayers in sensing a variety of analytes. However, there are still noticeable issues with oxidation, despite the improvements associated with inclusion of an antioxidant, that we aim to mitigate in future work. This issue limited the overall cyclability of the sensor, but might be mitigated in the future using a stronger small molecule antioxidant or a polymer that prevents oxidation.Conflicts of interest
There are no conflicts to declare.Acknowledgements
This work was supported by the US National Science Foundation (grant CMMI-1760859). Dr. Touseef Habib and Dr. Smit Shah are acknowledged for their assistance in synthesizing Ti3C2Tx dispersions. Dr. Wanmei Sun is acknowledged for synthesizing GO dispersions. Use of the TAMU Materials and Characterization Facility and assistance of Dr. Yordanos Bisrat and Dr. Jing Wu are acknowledged.References
- M. Schirrmann, R. Gebbers, E. Kramer and J. Seidel, Sensors, 2011, 11, 573–598 CrossRef CAS PubMed.
- S. Zhuiykov, Sens. Actuators, B, 2012, 161, 1–20 CrossRef CAS.
- X. Chen, X. Sun, W. Xu, G. Pan, D. Zhou, J. Zhu, H. Wang, X. Bai, B. Dong and H. Song, Nanoscale, 2018, 10, 1111–1118 RSC.
- B. Melai, P. Salvo, N. Calisi, L. Moni, A. Bonini, C. Paoletti, T. Lomonaco, V. Mollica, R. Fuoco and F. D. Francesco, 2016 38th Annual Internation Conference of the IEEE Engineering in Medicine and Biology Society, IEEE, U. S. A., 2016 Search PubMed.
- J. I. Horiuchi, T. Shimizu, K. Tada, T. Kanno and M. Kobayashi, Bioresour. Technol., 2002, 82, 209–213 CrossRef CAS PubMed.
- P. Salvo, B. Melai, N. Calisi, C. Paoletti, F. Bellagambi, A. Kirchhain, M. G. Trivella, R. Fuoco and F. Di Francesco, Sens. Actuators, B, 2018, 256, 976–991 CrossRef CAS.
- Y. Qin, H.-J. Kwon, M. M. R. Howlader and M. J. Deen, RSC Adv., 2015, 5, 69086–69109 RSC.
- W. Nernst, Z. Phys. Chem., 1889, 4U, 129 Search PubMed.
- O. Knopfmacher, A. Tarasov, W. Fu, M. Wipf, B. Niesen, M. Calame and C. Schönenberger, Nano Lett., 2010, 10, 2268–2274 CrossRef CAS PubMed.
- D. B. L. Terci and A. V. Rossi, Quim. Nova, 2002, 25, 684–688 CrossRef.
- B. Lakard, O. Segut, S. Lakard, G. Herlem and T. Gharbi, Sens. Actuators, B, 2007, 122, 101–108 CrossRef CAS.
- P. K. Ang, W. Chen, A. T. S. Wee and K. P. Loh, J. Appl. Chem. Sci., 2008, 130, 14392–14393 CAS.
- A. Das, D. H. Ko, C.-H. Chen, L.-B. Chang, C.-S. Lai, F.-C. Chu, L. Chow and R.-M. Lin, Sens. Actuators, B, 2014, 205, 199–205 CrossRef CAS.
- T.-M. Pan, C.-W. Wang, S. Mondal and S.-T. Pang, Electrochim. Acta, 2018, 261, 482–490 CrossRef CAS.
- N. Kumar, J. Kumar and S. Panda, RSC Adv., 2016, 6, 10810–10815 RSC.
- Z. Ling, C. E. Ren, M.-Q. Zhao, J. Yang, J. M. Giammarco, J. Qiu, M. W. Barsoum and Y. Gogotsi, Proc. Natl. Acad. Sci. U. S. A., 2014, 111, 16676–16681 CrossRef CAS PubMed.
- M. Naguib, M. Kurtoglu, V. Presser, J. Lu, J. Niu, M. Heon, L. Hultman, Y. Gogotsi and M. W. Barsoum, Adv. Mater., 2011, 23, 4248–4253 CrossRef CAS PubMed.
- J. Halim, S. Kota, M. R. Lukatskaya, M. Naguib, M.-Q. Zhao, E. J. Moon, J. Pitock, J. Nanda, S. J. May, Y. Gogotsi and M. W. Barsoum, Adv. Funct. Mater., 2016, 26, 3118–3127 CrossRef CAS.
- M. Wu, B. Wang, Q. Hu, L. Wang and A. Zhou, Materials, 2018, 11, 2112 CrossRef PubMed.
- W. Sun, S. A. Shah, Y. Chen, Z. Tan, H. Gao, T. Habib, M. Radovic and M. J. Green, J. Mater. Chem. A, 2017, 5, 21663–21668 RSC.
- M. R. Lukatskaya, O. Mashtalir, C. E. Ren, Y. Dall'Agnese, P. Rozier, P. L. Taberna, M. Naguib, P. Simon, M. W. Barsoum and Y. Gogotsi, Science, 2013, 341, 1502–1505 CrossRef CAS PubMed.
- Z. W. Seh, K. D. Fredrickson, B. Anasori, J. Kibsgaard, A. L. Strickler, M. R. Lukatskaya, Y. Gogotsi, T. F. Jaramillo and A. Vojvodic, ACS Energy Lett., 2016, 1, 589–594 CrossRef CAS.
- L. Ding, Y. Wei, L. Li, T. Zhang, H. Wang, J. Xue, L.-X. Ding, S. Wang, J. Caro and Y. Gogotsi, Nat. Commun., 2018, 9, 155 CrossRef PubMed.
- Y. Cai, J. Shen, G. Ge, Y. Zhang, W. Jin, W. Huang, J. Shao, J. Yang and X. Dong, ACS Nano, 2018, 12, 56–62 CrossRef CAS PubMed.
- H. An, T. Habib, S. Shah, H. Gao, A. Patel, I. Echols, X. Zhao, M. Radovic, M. J. Green and J. L. Lutkenhaus, ACS Appl. Nano Mater., 2019, 2, 948–955 CrossRef CAS.
- H. An, T. Habib, S. Shah, H. Gao, M. Radovic, M. J. Green and J. L. Lutkenhaus, Sci. Adv., 2018, 4(3), 1–8 Search PubMed.
- T. Y. Ma, J. L. Cao, M. Jaroniec and S. Z. Qiao, Angew. Chem., Int. Ed., 2016, 55, 1138–1142 CrossRef CAS PubMed.
- X. Peng, Y. Zhang, D. Lu, Y. Guo and S. Guo, Sens. Actuators, B, 2019, 286, 222–229 CrossRef CAS.
- H. Tang, Q. Hu, M. Zheng, Y. Chi, X. Qin, H. Pang and Q. Xu, Prog. Nat. Sci.: Mater. Int., 2018, 28, 133–147 CrossRef CAS.
- Z. Zhou, W. Panatdasirisuk, T. S. Mathis, B. Anasori, C. Lu, X. Zhang, Z. Liao, Y. Gogotsi and S. Yang, Nanoscale, 2018, 10, 6005–6013 RSC.
- S. J. Kim, H.-J. Koh, C. E. Ren, O. Kwon, K. Maleski, S.-Y. Cho, B. Anasori, C.-K. Kim, Y.-K. Choi, J. Kim, Y. Gogotsi and H.-T. Jung, ACS Nano, 2018, 12, 986–993 CrossRef CAS PubMed.
- W. Yuan, K. Yang, H. Peng, F. Li and F. Yin, J. Mater. Chem. A, 2018, 6, 18116–18124 RSC.
- E. Lee, A. VahidMohammadi, B. C. Prorok, Y. S. Yoon, M. Beidaghi and D.-J. Kim, ACS Appl. Mater. Interfaces, 2017, 9, 37184–37190 CrossRef CAS PubMed.
- H.-J. Koh, S. J. Kim, K. Maleski, S.-Y. Cho, Y.-J. Kim, C. W. Ahn, Y. Gogotsi and H.-T. Jung, ACS Sens., 2019, 4, 1365–1372 CrossRef CAS PubMed.
- Q. Gao, J. Come, M. Naguib, S. Jesse, Y. Gogotsi and N. Balke, Faraday Discuss., 2017, 199, 393–403 RSC.
- C. Eames and M. S. Islam, J. Appl. Chem. Sci., 2014, 136, 16270–16276 CAS.
- Z. Wei, Z. Peigen, T. Wubian, Q. Xia, Z. Yamei and S. ZhengMing, Mater. Chem. Phys., 2018, 206, 270–276 CrossRef CAS.
- M. Ghidiu, S. Kota, J. Halim, A. W. Sherwood, N. Nedfors, J. Rosen, V. N. Mochalin and M. W. Barsoum, Chem. Mater., 2017, 29, 1099–1106 CrossRef CAS.
- T. Habib, X. Zhao, S. A. Shah, Y. Chen, W. Sun, H. An, J. L. Lutkenhaus, M. Radovic and M. J. Green, npj 2D Mater. Appl., 2019, 3, 8 CrossRef.
- C. J. Zhang, S. Pinilla, N. McEvoy, C. P. Cullen, B. Anasori, E. Long, S.-H. Park, A. Seral-Ascaso, A. Shmeliov, D. Krishnan, C. Morant, X. Liu, G. S. Duesberg, Y. Gogotsi and V. Nicolosi, Chem. Mater., 2017, 29, 4848–4856 CrossRef CAS.
- R. Lotfi, M. Naguib, D. E. Yilmaz, J. Nanda and A. C. T. van Duin, J. Mater. Chem. A, 2018, 6, 12733–12743 RSC.
- S. Huang and V. N. Mochalin, Inorg. Chem., 2019, 58, 1958–1966 CrossRef CAS PubMed.
- X. Zhao, A. Vashisth, E. Prehn, W. Sun, S. A. Shah, T. Habib, Y. Chen, Z. Tan, J. L. Lutkenhaus, M. Radovic and M. J. Green, Matter, 2019, 1, 513–526 CrossRef.
- V. Natu, M. Sokol, L. Verger and M. W. Barsoum, J. Phys. Chem. C, 2018, 122, 27745–27753 CrossRef CAS.
- V. Natu, M. Clites, E. Pomerantseva and M. W. Barsoum, Mater. Res. Lett., 2018, 6, 230–235 CrossRef CAS.
- R. Zhang, J. Liu and Y. Li, ACS Sens., 2019, 4, 2058–2064 CrossRef CAS PubMed.
- S. U. Hong, R. Malaisamy and M. L. Bruening, J. Membr. Sci., 2006, 283, 366–372 CrossRef CAS.
- Y. Lei, W. Zhao, Y. Zhang, Q. Jiang, J.-H. He, A. J. Baeumner, O. S. Wolfbeis, Z. L. Wang, K. N. Salama and H. N. Alshareef, Small, 2019, 15, 1901190 CrossRef PubMed.
- H. Zhang, C. Wang, G. Zhu and N. S. Zacharia, ACS Appl. Mater. Interfaces, 2016, 8, 26258–26265 CrossRef CAS PubMed.
- Y.-C. Li, J. Schulz and J. C. Grunlan, ACS Appl. Mater. Interfaces, 2009, 1, 2338–2347 CrossRef CAS PubMed.
- Z. Rezvani Amin, M. Rahimizadeh, H. Eshghi, A. Dehshahri and M. Ramezani, Iran. J. Basic Med. Sci., 2013, 16, 150–156 Search PubMed.
- M. Ghidiu, M. R. Lukatskaya, M.-Q. Zhao, Y. Gogotsi and M. W. Barsoum, Nature, 2014, 516, 78 CrossRef CAS PubMed.
- W. S. Hummers and R. E. Offeman, J. Appl. Chem. Sci., 1958, 80, 1339–1339 CAS.
- S. De and J. L. Lutkenhaus, Green Chem., 2018, 20, 506–514 RSC.
- M.-Q. Zhao, N. Trainor, C. E. Ren, M. Torelli, B. Anasori and Y. Gogotsi, Adv. Mater. Technol., 2019, 1800639 CrossRef.
- G. Sauerbrey, Z. Phys. A: Hadrons Nucl., 1959, 155, 206–222 CrossRef CAS.
- S. Zheng, Q. Tu, J. J. Urban, S. Li and B. Mi, ACS Nano, 2017, 11, 6440–6450 CrossRef CAS PubMed.
- M. Naguib, V. N. Mochalin, M. W. Barsoum and Y. Gogotsi, Adv. Mater., 2014, 26, 992–1005 CrossRef CAS PubMed.
- S. A. Shah, T. Habib, H. Gao, P. Gao, W. Sun, M. J. Green and M. Radovic, Chem. Commun., 2017, 53, 400–403 RSC.
- K. A. Curtis, D. Miller, P. Millard, S. Basu, F. Horkay and P. L. Chandran, PLoS One, 2016, 11, e0158147 CrossRef PubMed.
- K. J. Loh, J. Kim, J. P. Lynch, N. W. S. Kam and N. A. Kotov, Smart Mater. Struct., 2007, 16, 429 CrossRef CAS.
- K. J. Loh, J. P. Lynch and N. A. Kotov, Proc. SPIE 6529, Sensors and Smart Structures Technologies for Civil, Mechanical, and Aerospace Systems, SPIE, U. S. A., 2007 Search PubMed.
- N. Lei, P. Li, W. Xue and J. Xu, Meas. Sci. Technol., 2011, 22, 107002 CrossRef.
- K. F. Lei, K.-F. Lee and S.-I. Yang, Microelectron. Eng., 2012, 100, 1–5 CrossRef CAS.
- H. D. Nguyen, T. H. Nguyen, N. V. Hoang, N. N. Le, T. N. N. Nguyen, D. C. T. Doan and M. C. Dang, Adv. Nat. Sci.: Nanosci. Nanotechnol., 2014, 5, 045001 Search PubMed.
- Y. T. Lee, E. Lee, J. M. Lee and W. Lee, Curr. Appl. Phys., 2009, 9, e218–e221 CrossRef.
- D. Jung, M.-E. Han and G. S. Lee, Mater. Lett., 2014, 116, 57–60 CrossRef CAS.
- M. Hu, T. Hu, Z. Li, Y. Yang, R. Cheng, J. Yang, C. Cui and X. Wang, ACS Nano, 2018, 12, 3578–3586 CrossRef CAS PubMed.
- A. Qian, J. Y. Seo, H. Shi, J. Y. Lee and C.-H. Chung, ChemSusChem, 2018, 11, 3719–3723 CrossRef CAS PubMed.
- G. Ge, Y. Cai, Q. Dong, Y. Zhang, J. Shao, W. Huang and X. Dong, Nanoscale, 2018, 10, 10033–10040 RSC.
Footnote |
| † Electronic supplementary information (ESI) available. See DOI: 10.1039/c9me00142e |
| This journal is © The Royal Society of Chemistry 2020 |