
Automatic mutual information noise omission (AMINO): generating order parameters for molecular systems
Pavan
Ravindra†
ab,
Zachary
Smith†
 cd and
Pratyush
Tiwary
*ad
cd and
Pratyush
Tiwary
*ad
aDepartment of Chemistry and Biochemistry, University of Maryland, College Park, 20742, USA. E-mail: ptiwary@umd.edu
bDepartment of Computer Science, University of Maryland, College Park, 20742, USA
cBiophysics Program, University of Maryland, College Park, 20742, USA
dInstitute for Physical Science and Technology, University of Maryland, College Park, 20742, USA
First published on 14th November 2019
Abstract
Molecular dynamics (MD) simulations generate valuable all-atom resolution trajectories of complex systems, but analyzing this high-dimensional data as well as reaching practical timescales, even with powerful supercomputers, remain open problems. As such, many specialized sampling and reaction coordinate construction methods exist that alleviate these problems. However, these methods typically don't work directly on all atomic coordinates, and still require previous knowledge of the important distinguishing features of the system, known as order parameters (OPs). Here we present AMINO, an automated method that generates such OPs by screening through a very large dictionary of OPs, such as all heavy atom contacts in a biomolecule. AMINO uses ideas from information theory to learn OPs that can then serve as an input for designing a reaction coordinate which can then be used in many enhanced sampling methods. Here we outline its key theoretical underpinnings, and apply it to systems of increasing complexity. Our applications include a problem of tremendous pharmaceutical and engineering relevance, namely, calculating the binding affinity of a protein–ligand system when all that is known is the structure of the bound system. Our calculations are performed in a human-free fashion, obtaining very accurate results compared to long unbiased MD simulations on the Anton supercomputer, but in orders of magnitude less computer time. We thus expect AMINO to be useful for the calculation of thermodynamics and kinetics in the study of diverse molecular systems.
 Pratyush Tiwary | Pratyush Tiwary is an Assistant Professor at the University of Maryland, College Park in the Department of Chemistry and Biochemistry and the Institute for Physical Science and Technology. He received his PhD in Materials Science from Caltech, working with Axel van de Walle, and undergraduate degree in Metallurgical Engineering from the Indian Institute of Technology, Varanasi. He has been a postdoc at Columbia University and at ETH Zurich, where he worked with Bruce Berne and Michele Parrinello respectively. His work has been recognized through Doctoral New Investigator Award from ACS Petroleum Research Fund, Future of Biochemistry award from the journal Biochemistry, and in the Emerging Investigator special collection by the Journal of Chemical Physics. |
Design, System, ApplicationMolecular dynamics (MD) simulations are a popular workhorse for design of complex materials with all-atom resolution. However, they are plagued by the curse of dimensionality limiting their usefulness in practical problems. Here we present a new algorithm named automatic mutual information noise omission (AMINO). This method screens for order parameter redundancy for MD simulations and automatically selects minimal set of order parameters. As we present it here, AMINO can be used to select order parameters for use in other established algorithms, such as reaction coordinate construction. AMINO automates and accelerates enhanced sampling workflows, and we hope it will prove useful in improving results for known systems as well as exploring newer, less well-defined systems. Here we illustrate it for calculating protein-ligand binding free energy but expect its usefulness to be widespread for the design of diverse molecular systems. |
1 Introduction
Molecular dynamics (MD) has become a routine tool for simulating and understanding the various structural, thermodynamic and kinetic properties of complex real-world molecular systems. MD simulations make it possible to study these systems comprising millions of atoms reaching timescales of microseconds and beyond, while maintaining all-atom spatial and femtosecond temporal resolutions. In spite of this staggering success of MD over the decades, one is faced with two central and inter-connected problems. First, these long simulations with the aforementioned high spatial and temporal resolution can easily produce an overwhelming amount of data (easily into terabytes). How do we make sense of this data? Second, even these long simulations are not long enough, as currently, in spite of the best available supercomputing resources, MD can reach at best a microsecond in practical wall-clock time. Thus specialized so-called “enhanced sampling” algorithms1,2 have been developed that allow us to reach much longer timescales of seconds, minutes and beyond in a statistically accurate manner.While these two challenges to MD might appear disconnected, they share a commonality – namely, the need for dimensionality reduction. The complex, often bewildering dynamics that seem to happen in an extremely high-dimensional configuration space, can often be reduced to certain key variables that capture the underlying physics or chemistry. The other remaining variables are then either irrelevant or can simply be mapped into noise. These key variables, which we refer to as “order parameters (OP)” can then serve to form a data-efficient low-dimensional picture of complicated molecular systems and processes. These OPs serve as internal coordinates that are useful as a basis set for the description of the processes of interest.3 Through one of many available methods,4–14 they can then also be mixed into an even lower-dimensional reaction coordinate (RC). An exact reaction coordinate would arguably be given by normal lines to the isocommittor planes,11,15 although other definitions for reaction coordinate optimality have also been proposed.5,16 However, finding such a RC is not the objective here. Therefore, we use OP to describe basis functions describing a transition and RC to describe approximations of the committor function (in this case linear combinations of OPs). While these methods are able to evaluate the relative importance of OPs, evaluating a set of OPs with size in the hundreds to thousands is computationally infeasible and warrants the need for pre-selection of a smaller OP set. By then enhancing fluctuations along this RC, enhanced sampling methods such as metadynamics17 and umbrella sampling18 can tackle the second challenge mentioned above, i.e. assessing processes that happen far slower than the capabilities of unbiased MD. From the above discussion it should thus be clear that the proper selection of OPs is crucial for analysis and enhancing of MD simulations.6,17
In this work we propose a new fairly automated computational scheme for the selection of such OPs. Previously, selection of OPs has relied purely on biophysical intuition or knowledge of the system and processes of interest.6 However, for novel systems of interest, there may not be enough information about the system to make claims about which OPs are relevant to a particular chemical process. Creating a robust, flexible algorithm to screen for OP redundancy is thus a problem of great interest to the field of MD simulations. Selecting noisy OPs that are not pertinent to the process of interest or OPs that provide redundant information can slow down calculations or even yield misleading results. For instance consider the case where the selected OPs are used to construct a RC for metadynamics simulation (or other biased simulations).17 Providing redundant, correlated or noisy OPs can lead to an inefficient biasing protocol that might end up being even slower than unbiased MD. While the developed formalism and algorithms should be quite generally applicable to a variety of real-world molecular systems, here we consider as an illustrative test-case the calculation of absolute binding affinity of a protein–ligand system in explicit water.
Our algorithm, which we name “Automatic Mutual Information Noise Omission (AMINO)”, uses a mutual information-based distance metric to find a set of minimally redundant OPs from a much larger set, and then uses K-medoids clustering with this distance metric, together with ideas from rate-distortion theory19 to find representative OPs from each cluster that provide maximum information about the given system. We demonstrate the effectiveness of our method on an analytical model system and the much larger FKBP–BUT protein–ligand system. In both examples we begin with absolutely no prior information on the system other than an initial set of coordinates for each atom. We apply AMINO to generate a set of OPs from an unbiased trajectory of the system, then we generate a reaction coordinate using SGOOP to run metadynamics, enhancing the dissociation process and accurately calculating the absolute binding free energy.
This work contributes to the field of automated enhanced sampling by discovering basis functions, or OPs, which may be used in RC calculation methods.20–22 These RC methods excel at discovering a low dimensional representation of the system given a set of basis functions but will have lowered performance and risk sub-optimal RC discovery when too many basis functions are provided. AMINO is the first step in a pipeline from high dimensional phase space to low dimensional RCs and reduces the computational load that RC methods would face when using hundreds to thousands of input OPs. We believe that the current work is arguably one of the first illustrations of a fully automated pipeline where starting with a known protein data bank (PDB) structure of a bound protein–ligand system, a force-field, and a short MD run exploring the bound pose (but not necessarily showing dissociation), one obtains basis functions or order parameters. The OPs generated by AMINO can be used in any other procedure of choice for generating reaction coordinate, such as TICA,4 RAVE,7 or VAC,8 followed by use in an enhanced sampling protocol, not limited to metadynamics, which may be used to obtain binding free energy in an order of magnitude speed-up relative to unbiased MD. The OPs identified by AMINO also form a most concise dimensionality reduction of an otherwise gargantuan MD trajectory. Selecting OPs has been a major barrier toward creating a fully automated enhanced sampling procedure, and now, AMINO can serve as an automated protocol for selecting OPs on an information theoretic basis. We thus expect AMINO to be useful to a wide range of practitioners of molecular simulations.
2 Theory
We start this section by summarizing the key steps in our algorithm, and then gradually go through every step in detail. Our goal is to construct clusters of similar OPs and choose a single OP from each cluster that best describes its parent cluster as a whole. The number of clusters or equivalently the number of OPs is learned on-the-fly through a formalism based on rate-distortion theory. The key input to our algorithm is a large set of OPs and their time series in a short unbiased trajectory. Note that AMINO does not need temporal information on the OPs, as such the time series could be coming from independent unbiased simulations, appropriately reweighted biased simulations, or could even be temporally scrambled. Given this input, AMINO involves the following sequential procedure:1. Cluster the input OPs using a mutual information variant that serves as a distance metric. The idea here is that not all OPs carry significantly different information, and with an appropriate distance function, we can identify groups of OPs carrying similar information.
2. Select a single OP from each cluster to best describe all of the OPs within the cluster. This OP is thus most representative of the information carried by all OPs in the cluster that it belongs to.
3. Finally, determine the appropriate total number of clusters, or equivalently the number of OPs to use to describe the entire set of OPs that AMINO started out with.
In step 1, we use a mutual information-based distance function to measure the similarity of any two OPs.23,24 In step 2, we apply a variation on the well-known K-means clustering algorithm,25 and finally in step 3, apply a recent implementation of rate-distortion theory to clustering in order to find the ideal number of clusters or OPs.26
2.1 A distance function based on mutual information
Any clustering procedure requires a relevant distance metric. In Cartesian coordinate systems, the most commonly used metric is the Euclidean distance between two points.25 However, there is no easily identifiable low-dimensional space that OPs lie upon in which the Euclidean distance between two OPs would shed meaningful information about the similarity of the OPs. Thus, we need to define a new metric where the distance between two OPs would correlate with how similar they are to each other in terms of information they carry.More rigorously speaking, a useful distance metric for this setting satisfies all of the relevant properties of any other distance metric in addition to requirements specific to this system. Together these requirements are detailed below for a distance metric D(X,Y) for any given pair of OPs X and Y.
1. Non-negativity: D(X,Y) ≥ 0.
2. Symmetry: D(X,Y) = D(Y,X)
3. OPs X,Y that are close to each other, as determined by small D(X,Y), should be “redundant”. This would mean that knowledge of one OP's time series provides substantial information about the time series of the other OP. In the clustering scheme, these parameters should be clustered together so that only one of the two is likely to be chosen for the final set.
4. OPs X,Y that are far from each other, as determined by large D(X,Y), should be relatively independent. This would mean that they are not redundant and should not be clustered together.
The mutual information based distance metric proposed by Aghagolzadeh and co-workers satisfies all of the above requirements.23 This distance function is a variant of mutual information normalized over the range [0, 1].
In the continuous setting,
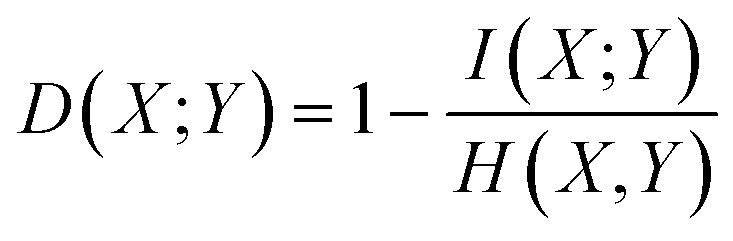 | (1) |
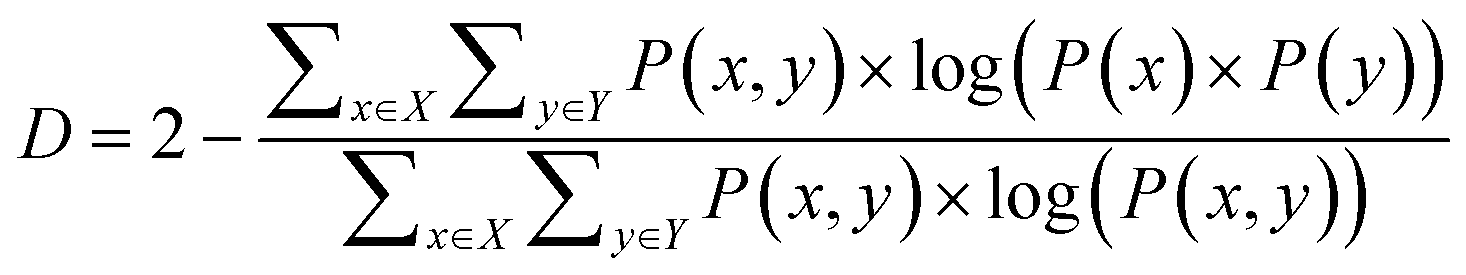 | (2) |
Eqn (1) and (2) are equivalent formulations of the mutual information-based distance between two OPs X and Y. Inspection of eqn (2) gives an intuitive reasoning about the meaning of D. The denominator of the fraction component of eqn (2) contains the joint probability distribution of X and Y while the numerator is the joint probability distribution assuming independence between X and Y. The core purpose of this equation is to compute how different the true join probability distribution is from the independence assumption.
Clustering using the mutual information-based distance metric results in clusters of OPs with low mutual distances, where knowing the time series of a single OP in a cluster would give significant information about the trajectories of the other OPs in the cluster. Any two OPs from different clusters, however, would be fairly independent, and knowledge of either OP's time series would provide little information about the other time series.
2.2 Dissimilarity matrix and clustering
Now that we have defined a suitable distance metric in sec. 2.1, we are ready to complete the first step in AMINO, namely clustering of different OPs by how similar or dissimilar they are. K-medoids clustering, an approach similar to K-means clustering but with centroids restricted to members of the input data set, provides a powerful approach to group a set of data points into k clusters for some provided number of clusters k. We stress that K-medoids clustering must be provided with the number of clusters k and that determining the optimal k for a given set of data is a separate (yet extremely important) concern. In sec. 3, we discuss this problem in detail along with our solution to it.The use of K-medoids clustering instead of the common K-means algorithm is necessary for clustering OPs. Since OPs do not naturally lie on a coordinate system, there is no manifold to embed centroids in. Therefore, centroids must be members of the input data set which already have distances calculated from their mutual information.
Pseudocode for both K-means and K-medoids clustering is provided as algorithms 1 and 2 respectively. As a result of using K-medoids clustering, we lose the ability of K-means to transition from a centroid of one cluster to another. In other words, centroids can become “stuck” within dense clusters of OPs. The resulting k clusters may fail to accurately represent clusters that are not captured by the initial set of randomly-generated starting centroids.
| Algorithm 1 K-Means clustering |
|---|
| 1: function KMEANSCLUSTER(S,k) ▷ where S – set of data points to be clustered, k – number of clusters |
| 2: μ: = random set of k unique elements |
| 3: repeat |
| 4: fori in Sdo |
| 5: ci: = nearest centroid in μ |
| 6: end for |
| 7: for each cluster jdo |
| 8: μj = mean of all points assigned to cluster |
| 9: end for |
| 10: untilμ converges to a single set |
| 11: returnμ |
| 12: end function |
| Algorithm 2 K-Medoids clustering |
|---|
| 1: function KMEDOIDSCLUSTER(S;k) ▷ where S – set of data points to be clustered, k – number of clusters |
| 2: μ: = random set of k unique elements from S |
| 3: repeat |
| 4: fori in Sdo |
| 5: ci: = nearest centroid in μ |
| 6: end for |
| 7: for each cluster jdo |
| 8: μj = elements that best describes j (eqn (3)) |
| 9: end for |
| 10: untilμ converges to a single set |
| 11: returnμ |
| 12: end function |
To surmount this problem, we begin our K-medoids clustering scheme with a non-randomly chosen set of OPs to act as the vector of initial centroids. These centroids are chosen as to maximize the dissimilarity between the selected OPs. We achieve this by constructing a dissimilarity matrix A of k OPs that tracks the distance between every pair of OPs within its set. This procedure is summarized in algorithm 3, and we now describe it in detail.
| Algorithm 3 Dissimilarity matrix construction |
|---|
| 1: function BUILDMATRIX(S;k) ▷ where S – set of data points, k – size of dissimilarity matrix |
| 2: M initialized to empty k × k matrix |
| 3: fori in Sdo |
| 4: if size (M) < kthen |
| 5: Add i to M and update M |
| 6: else |
| 7: n: = row of M with smallest product |
| 8: row: = [D(i,j) for (j ∈ M where j ≠ n)] |
| 9: if product (n) < product(row) then |
| 10: Replace n in M with i |
| 11: end if |
| 12: end if |
| 13: end for |
| 14: returnM |
| 15: end function |
For any dissimilarity matrix A of size k × k, which is defined for a given set of k OPs, x1,…,xk, we set any element in the matrix Ai,j![[triple bond, length as m-dash]](https://www.rsc.org/images/entities/char_e002.gif) D(xi,xj). As a result of this definition a few noteworthy properties arise:
D(xi,xj). As a result of this definition a few noteworthy properties arise:
1. A is a hollow matrix with all diagonal terms 0, since D(xi,xi) = 0 ∀i.
2. A is a symmetric matrix, since D(xi,xj) = D(xj,xi) ∀i.
3. The geometric mean (eqn (3)) of all non-diagonal elements of a row corresponding to an OP gives a measure of how “dissimilar” the OP is to the rest of the set of OPs described by the dissimilarity matrix.
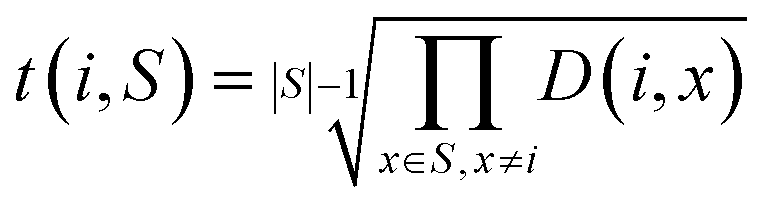 | (3) |
We choose the geometric mean over the arithmetic mean so that OPs that are very similar to other OPs as per the dissimilarity matrix are strongly favored against. As an example, consider the case where two identical OPs are in the full set of OPs. These two OPs would have a distance of 0, yet if the arithmetic mean were to be used, both of these OPs may be included in the dissimilarity matrix if they are very different from the other dissimilarity matrix OPs. However, the geometric mean of the rows corresponding to these OPs would be 0 as long as they are both included, so this procedure would strongly favor removing one of them, which is exactly what we seek.
When considering whether an OP should be added to the dissimilarity matrix, t(i,S) from eqn (3) can be used to determine whether the candidate OP should replace an existing OP. Refer to the pseudocode in algorithm 3 for a description of how the dissimilarity matrix is constructed. It should be noted that this approach is a so-called greedy algorithm27 and is not guaranteed to find the k most dissimilar OPs. However, this approach does generate a set of OPs that is extremely likely to have higher internal dissimilarity than a randomly chosen set of the provided OPs. Thus, these OPs serve as a good starting point for clustering in the constrained centroid context.
To reiterate, we begin with a very large set S of OPs. To determine the k best OPs to describe S for some k, we start by constructing a dissimilarity matrix of size k for the set S (algorithm 3). We then use the resulting k OPs as the starting centroids for K-medoids clustering (algorithm 2), and the final set of OPs that the solution converges to is the final set of OPs for the given k. The approach described up to this point relies on a user input for k, the number of output OPs. However, the procedure we have outlined thus far makes no claims about what the best k is for a given set S. To estimate the optimal k, which is the final aspect of AMINO, we turn to rate-distortion theory.19,26
2.3 Jump method for determining number of clusters
Sugar and James introduced a method for finding the ideal number of clusters for a given dataset using rate-distortion theory.19,26 A pseudocode outline of their approach is provided in algorithm 4. The basis for their approach is that once a distortion function is constructed for a data set (a function that captures the error in using some subset of the full dictionary of order parameters to describe the full set), the maximal jump in distortion alone is not the best factor in determining the ideal number of clusters. However, with a proper selection of negative exponent (where p is the dimensionality of the system) applied to the distortion function, the largest jump in such an exponentiated distortion corresponds to the optimal number of clusters k for the data set. We now explain and quantify this intuitive idea.
| Algorithm 4 Jump method to find k |
|---|
| 1: function JUMPMETHOD(d,p) ▷ where d – array of distortions, p – dimentionality of system |
| 2: Y: = −p/2 |
| 3: ci: = dYi |
| 4: ji: = ci − ci−1 |
| 5: returni with largest j |
| 6: end function |
In order to apply this approach, a distortion function for a set of centers describing a dataset must be defined. In Euclidean spaces, the root-mean-square-deviation (RMSD) of distances is typically used.28 In a similar fashion using a RMSD built on the distance metric for OPs we just defined (sec. 2.1), a distortion function dk for a set of OPs S with centroids c1, c2, …, ck can be written as follows:
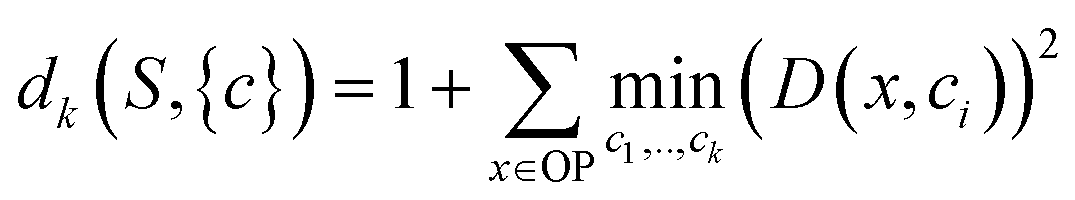 | (4) |
For each value of k being tested, k OPs are selected using the clustering procedure detailed in sec. 2.2. Then, the distortion is calculated as specified in eqn (4). This distortion represents how well the k OPs characterize the entire set of OPs. Then, using eqn (5), we find the value of k that maximizes the jump in the distortion with a negative exponent applied:
| J(k) = d−Yk − d−Yk−1 | (5) |
 | (6) |
 , a conservative selection is made by choosing the largest k for which a maximal jump is seen in any of these dimensions. Thus, by testing multiple values of Y, a value for k, the number of clusters, is chosen. Thankfully, as will be shown in the Results section, most selections of Y yield fairly consistent results for the best k, demonstrating the robustness of AMINO with respect to the precise choice of p.
3 Results
We now provide examples demonstrating clearly how AMINO works as well as its potential usefulness. The examples are systematically constructed, including an analytical model potential and binding free energy calculation for a drug fragment and FKBP protein. In the analytical system, we know the true “best” set of OPs beforehand, as they were used to generate the data. To these we then add a large number of decoy OPs and then use AMINO to see if we recover the true OPs. For the protein–ligand system, we consider all possible protein–ligand carbon atom contacts, and then apply AMINO. We use the OPs from AMINO as an input in the RC optimization method SGOOP. SGOOP uses a Maximum Caliber framework to construct transition matrices and calculates the associated eigenspectra. SGOOP selects the RC with the maximum gap between consecutive eigenvalues, called the spectral gap, which maximizes the timescale separation between fast and slow process in the system yielding a RC that is a good proxy for the committor.5,6 The RC from SGOOP is then used in metadynamics simulations for binding free energy estimation. We emphasize that the output of AMINO should be useful for RC methods other than SGOOP, and sampling protocols other than well-tempered metadynamics used in this work.3.1 Analytical model system
1. 10 independently sampled random values A, B, C, D, E, F, G, H, I and J from different distributions with varying numbers of local maxima, all spanning the range [−1, 1]. These are our true OPs and everything else from here onward for this system is a decoy OP.
2. 110 versions of one of the random values with random noise added. For clarity, take the example “noisy” OP A1A + q1, where q1 is a randomly sampled value in the range [−0.05, 0.05]. The noise qi of each noisy version is independent from the noise qj of any other noisy version.
The end goal is that AMINO should be able to return the original 10 values, and noisy versions should not be returned. Although A and Ai give the same amount of information about each other, Ai gives less information about Aj than A does (for some i ≠ j), since both Ai and Aj were derived from A, but their added noises are uncorrelated. This is not true for scalar multiples, since knowing any scalar multiple of an OP is equivalent to knowing the original OP itself.
| Number of clusters k | Dissimilarity matrix OPs |
|---|---|
| 9 | A 13, B1, C4, D4, E13,G3, H2, I11, J1 |
| 10 | A 11, B8, C6, D4, E8, F8,G12, H2, I9, J1 |
| 11 | A 9, B1, C4, D3, E12, F5,G8, H2, I3, J1, J8 |
| Number of clusters k | Post-clustering OPs |
|---|---|
| 9 | A, B, C, D, E, G, H, I, J |
| 10 | A, B, C, D, E, F, G, H, I, J |
| 11 | A, B, C, D, E, F, G, H, I, J, J3 |
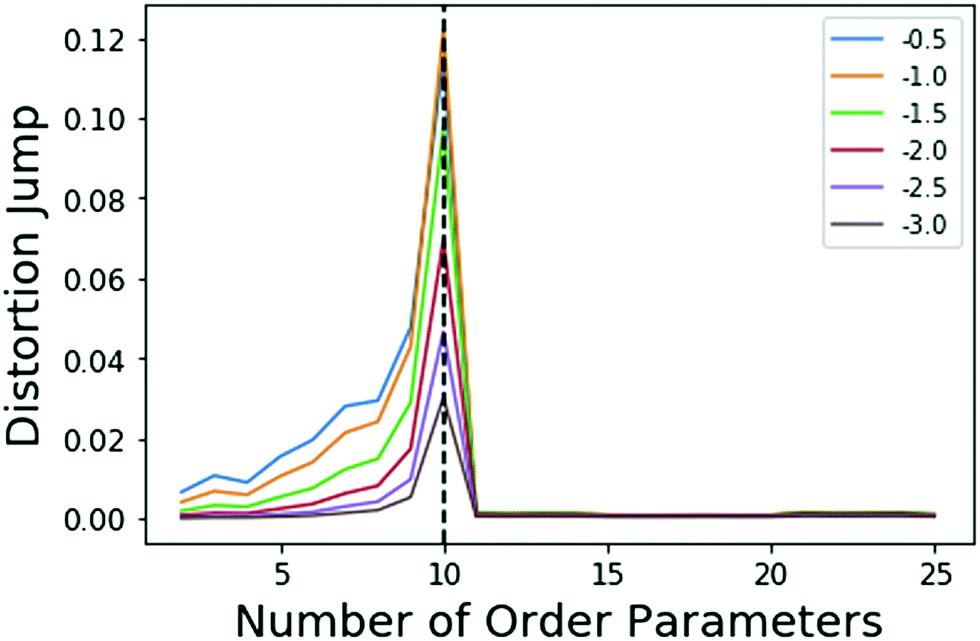 | ||
| Fig. 1 Jumps in distortion with various negative exponents Y (indicated with different colors) applied for the model system. The black dashed line shows the location for maximum jump at 10 OPs, which is robust with choice of Y in eqn (5). | ||
There is clearly a significant jump at k = 10 that corresponds to the correct number of OPs, thus, the k = 10 clustering results are used. As stated in sec. 2.3, Sugar and James's results26 show that this largest jump in distortion once a negative exponent is applied corresponds to the optimal number of clusters for the data.
3.2 FKBP/BUT system
Metadynamics17,32 is a popular sampling method used to bias MD simulations in order to visit states separated by a large energy barrier that would rarely be traversed in an unbiased MD simulation. The biasing is performed along a pre-selected low-dimensional RC. The typical output of a metadynamics simulation is the equilibrium probability distribution of the system along the RC or along any other low-dimensional coordinate through a reweighting scheme.32 While there are versions of metadynamics that allow higher dimensional coordinates and could use all AMINO OPs independently, we combine them here to show the general applicability of these OPs.33,34 There also exist variations of metadynamics useful to construct not just static probabilities but also unbiased kinetic observables such as the rates for moving between different metastable states.35,36 In any of its formulations, metadynamics benefits from a suitably chosen RC that adequately characterizes the different states of interest.17 While of late many methods have been developed that generate a RC from a set of OPs,4,5,7,8,37 as stated earlier, the input set of OPs is usually still chosen based on prior knowledge of the system. However, by applying AMINO, this set of OPs can be automatically selected with minimal prior knowledge of the system, except the bound pose structure and a short unbiased MD run where we do not rely on the dissociation event being sampled even once. In order to compute the free energy of binding/unbinding, several dissociation and re-association events need to be observed in order for the free energy to converge. However, using metadynamics with a properly-constructed RC, unbinding events can occur more quickly (in terms of simulation time), decreasing the total time needed to compute the free energy.We begin with a short 10 nanosecond trajectory of the protein–ligand system of the protein FKBP and one of its ligands, 4-hydroxy-2-butanone (BUT). The trajectory is expressed in terms of a dictionary of 428 OPs (Fig. 2) that consists of every combination of distances between alpha carbons in the protein (107 atoms) and carbons in the ligand (4 atoms). These 428 OPs were used as input to AMINO to yield a reduced dictionary of 8 OPs, shown in Table 3. The output of using the jump method for this system is illustrated in Fig. 3, where irrespective of the precise value of p we can identify 8 OPs as the robust choice. Table 3 also provides the weights obtained for these OPs when considered in a 1-dimensional RC in SGOOP5 expressed as a linear combination of these OPs. Now that a reaction coordinate has been constructed using the AMINO-selected OPs, biased metadynamics runs were conducted38,39 to calculate the free energy of binding (ΔG) for the system. Specifically, well-tempered metadynamics40 with initial hill height = 1.5, biasfactor γ = 15, gaussian width σ = 0.45, and bias added every 1 ps was run for 500 ns. For comparison, metadynamics with the same parameters except sigma scaled to adjust for standard deviation, was run on four additional RCs which are the protein carbon alpha to ligand center of mass distance of the four residues closest to the ligand. Specifically, RC1, RC2, RC3, RC4 respectively denote ligand COM distance from Cα atoms of 54GLU, 55VAL, 56ILE and 59TRP. These RCs represent a naive guess that would be made for a system that has not been extensively studied. We provide the results from metadynamics on the AMINO RC and the 4 hand selected RCs as well as from an unbiased run for comparison in Fig. 4.
| Protein atom | Ligand atom | Weight in SGOOP RC |
|---|---|---|
| 86GLY Cα | 3 | 1.000 |
| 106LEU Cα | 2 | 0.946 |
| 39SER Cα | 3 | −0.973 |
| 23VAL Cα | 1 | −0.862 |
| 87HIS Cα | 2 | −0.903 |
| 61GLU Cα | 3 | −0.951 |
| 10GLY Cα | 2 | −0.974 |
| 80TYR Cα | 1 | −0.846 |
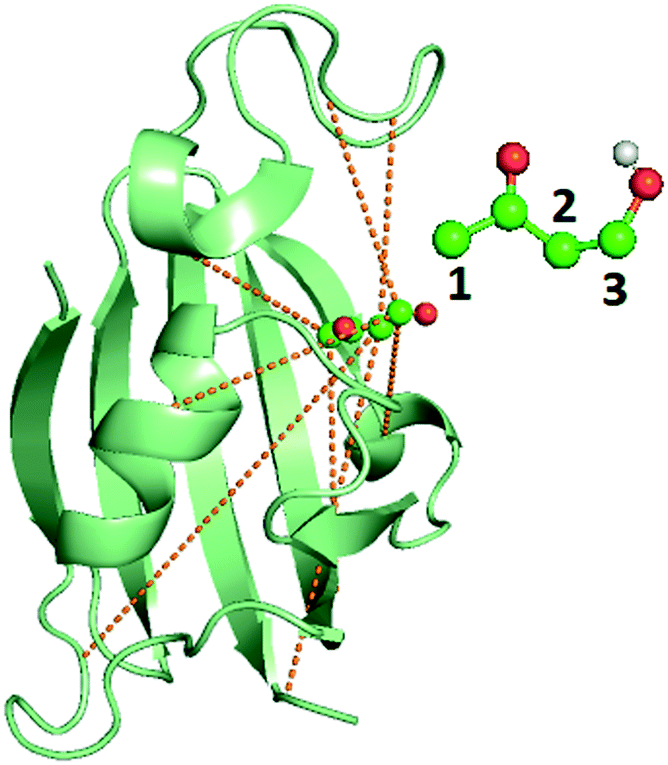 | ||
| Fig. 2 Image of the bound FKBP/BUT protein–ligand system, with inset showing the atom numbering for ligand carbons used in Table 3. Carbons are in blue, oxygens are in red, and the only polar hydrogen is in white. The dashed lines show the 8 different OPs detailed in Table 3, out of input 428 options, resulting from AMINO that were then used to construct a RC through SGOOP.5 | ||
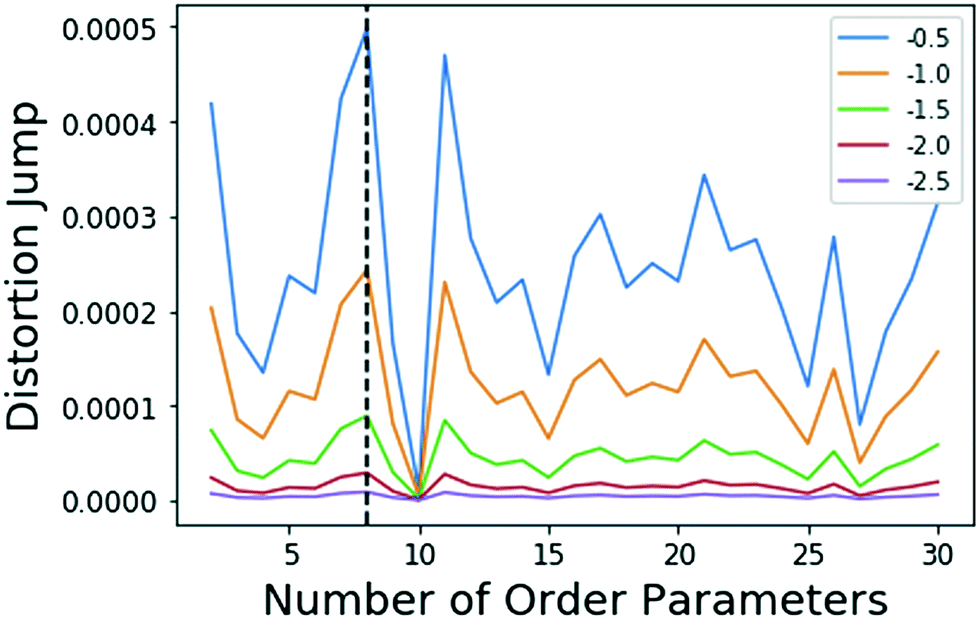 | ||
| Fig. 3 Results of the jump method (algo 4)) when applied to the FKBP/BUT system. The different lines correspond to different choices for Y in eqn (5), specified in the legend. The maximum jump occurs at 8 OPs for all choices of Y. It should be noted that the 8 and 11 OP distortion jumps are very similar. Either set of OPs would be an acceptable solution. A small amount of variance in output OPs should be within the tolerance granted by RC discovery methods which are able to determine the importance of a small set of OPs. | ||
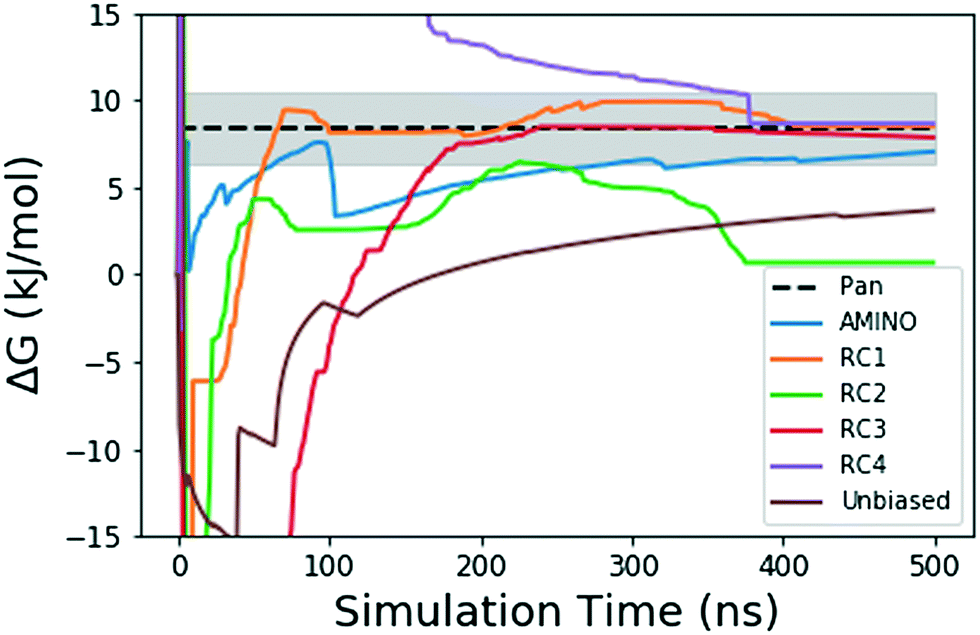 | ||
| Fig. 4 Absolute binding free energy ΔG in kJ mol−1 as a function of simulation time for the unbiased and biased runs of the FKBP/BUT protein–ligand system. The dotted black line shows the reference value from long unbiased MD simulations performed on Anton supercomputer by Pan et al.41 the shaded region denotes the ±0.5 kcal error reported with the final ref. 41 ΔG. The solid lines denote the ΔG values over 500 ns in the unbiased and biased simulations. The blue solid line shows result from metadynamics performed along RC learnt through AMINO and SGOOP. The brown solid line comes from our unbiased simulation. The other 4 solid lines correspond to metadynamics performed along RCs picked by visual inspection. | ||
Fig. 4 shows how the simulation that was biased using a RC constructed from AMINO-generated OPs gives a reasonably accurate estimate of ΔG in a very short time. The difference between our estimate and the Anton value41 is minuscule, especially considering that we re-parameterized the ligand on our own. While we followed ref. 41's instructions, this can easily lead to the fraction of a kBT difference we find. Given the difference in parametrization, it is unclear whether the difference in mean between the AMINO and Pan values is due to RC quality or parametrization and it can not be determined whether the AMINO RC or RC1 give a better result. RC1, RC2, and RC3 are three adjacent residues on the same secondary structure but yield vastly different quality in their free energy estimates demonstrating the variability associated with hand selecting new parameters. For the relatively simple protein–ligand system shown here, arbitrary RCs are out performed in most cases (3 out of 4 times) by our automatically learned RC after taking the mean free energy estimate and its error (shown in Fig. 5) into account. This shows that while the combination of AMINO and SGOOP may not yield the best possible RC, it returns a RC that is most likely better than a researcher's guess for a new system. These results highlight AMINO's utility for new systems where there are no previously tested OPs or RCs. In conclusion, the OPs selected by AMINO using absolutely no prior knowledge of the system were able to construct a meaningful reaction coordinate that was used to calculate a free energy close to the reference value with a low standard error.
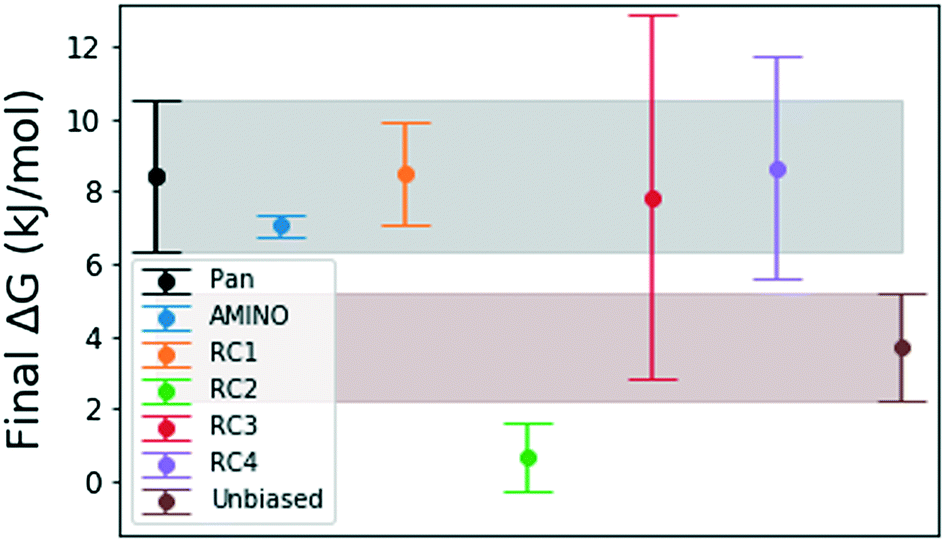 | ||
| Fig. 5 Final binding free energy ΔG in kJ mol−1 calculated in ref. 41 and after 500 ns of unbiased and biased simulation with error bars obtained by block averaging over the full trajectory. The shaded regions are extensions of the error bars for the free energy obtained by Pan et al.41 and obtained from our unbiased simulation. We expect that the error bars for RC3 and RC4 will decrease with either more simulation time or exclusion of the first 100–150 ns because there is large a deviation from the mean in the beginning of these trajectories. | ||
Although metadynamics does significantly increase the occurrence of unbinding events, re-binding is limited by entropy, thus traditional metadynamics17 cannot encourage re-binding, regardless of the reaction coordinate. The unbiased trajectory begins in the bound state, and the ligand only ever re-binds to the protein once. In the biased run, the simulation spends very little time in the bound state since it is biased away from remaining in the already-explored bound state. This allows the simulation to spend more time searching the other, unexplored states, so that it converges to a reasonable solution more quickly. However, this extended time spent in the unbound state presents an opportunity for further acceleration through approaches such as funnel metadynamics which help with the entropic problem.42 In combination with AMINO, SGOOP, and traditional metadynamics, funnel metadynamics can even further accelerate the procedure we have gone through here.
4 Discussion
In this work we have introduced an information theoretic approach to screening for OP redundancy by using a mutual information-based distance function as a measure of dissimilarity between two OPs. In general, to select a set of OPs for a system, current approaches rely primarily on previous biophysical knowledge of the system. With the procedure we have presented, a set of viable OPs can be constructed with much less knowledge of the system. For the calculation of protein–ligand absolute binding free energy, this amounted to knowing the bound pose structure and a very short MD trajectory (10 ns) where the ligand did not have to dissociate even once. Having a trajectory with actual dissociation events would likely increase the accuracy of AMINO even further, but that is not a practical scenario for systems of real-world interest invariably plagued with the sampling issue. The approach applied involves clustering the set of OPs by using the mutual information-based metric as detailed in algorithm 2, and using the resulting centroids as the output set of OPs. In order to overcome the problem of centroids becoming stuck in the same cluster, we initialize the K-medoids clustering algorithm with centroids from the construction of a dissimilarity matrix (algorithm 3). The motivation for creating the dissimilarity matrix is to generate a set of k points out of the set of provided OPs that are internally dissimilar. To determine the best k, a rate-distortion theory based jump method, described by Sugar and James,26 was employed on the results of clustering for various k.Our proposed algorithm eases the previous requirement of how well a system must be understood before selecting OPs without the risk of selecting poor OPs. Therefore, AMINO expands the set of systems easily accessible for enhanced sampling. Selection of OPs is vital to all methods employed after unbiased MD simulations, such as reaction coordinate construction and enhanced sampling. In future work, we will be applying AMINO to different molecular systems in biology and beyond, with different classes of trial OPs, including bond torsion angles, hydration states of specific constituents and many others. We believe that our algorithm provides significant progress towards the process of automating OP selection. A Python 3 implementation of this algorithm in Jupyter Notebook is available at https://github.com/pavanravindra/amino for public use.
Conflicts of interest
There are no conflicts to declare.Acknowledgements
We acknowledge the Donors of the American Chemical Society Petroleum Research Fund for partial support of this research (No. PRF 60512-DNI6). We thank Deepthought2, MARCC and XSEDE (projects CHE180007P and CHE180027P) for computational resources used in this work. We would also like to thank Shashank Pant for help with setting up the FKBP/BUT system for MD simulation.References
- P. Tiwary and A. van de Walle, in A Review of Enhanced Sampling Approaches for Accelerated Molecular Dynamics, ed. C. R. Weinberger and G. J. Tucker, Springer International Publishing, Cham, 2016, pp. 195–221 Search PubMed.
- C. Abrams and G. Bussi, Entropy, 2014, 16, 163–199 CrossRef.
- F. Sittel and G. Stock, J. Chem. Phys., 2018, 149, 150901 CrossRef.
- G. Pérez-Hernández, F. Paul, T. Giorgino, G. De Fabritiis and F. Noé, J. Chem. Phys., 2013, 139, 07B604_1 CrossRef.
- P. Tiwary and B. Berne, Proc. Natl. Acad. Sci. U. S. A., 2016, 113, 2839–2844 CrossRef CAS.
- Z. Smith, D. Pramanik, S.-T. Tsai and P. Tiwary, J. Chem. Phys., 2018, 149, 234105 CrossRef.
- J. M. L. Ribeiro, P. Bravo, Y. Wang and P. Tiwary, J. Chem. Phys., 2018, 149, 072301 CrossRef PubMed.
- J. McCarty and M. Parrinello, J. Chem. Phys., 2017, 147, 204109 CrossRef PubMed.
- M. I. Zimmerman and G. R. Bowman, J. Chem. Theory Comput., 2015, 11, 5747–5757 CrossRef CAS PubMed.
- Z. Shamsi, K. J. Cheng and D. Shukla, J. Phys. Chem. B, 2018, 122, 8386–8395 CrossRef CAS PubMed.
- B. Peters and B. L. Trout, J. Chem. Phys., 2006, 125, 054108 CrossRef.
- B. Peters, G. T. Beckham and B. L. Trout, J. Chem. Phys., 2007, 127, 034109 CrossRef.
- A. Ma and A. R. Dinner, J. Phys. Chem. B, 2005, 109, 6769–6779 CrossRef CAS.
- M. A. Rohrdanz, W. Zheng and C. Clementi, Annu. Rev. Phys. Chem., 2013, 64, 295–316 CrossRef CAS.
- W. E, W. Ren and E. Vanden-Eijnden, Chem. Phys. Lett., 2005, 413, 242–247 CrossRef CAS.
- S. V. Krivov, J. Chem. Theory Comput., 2013, 9, 135–146 CrossRef CAS PubMed.
- O. Valsson, P. Tiwary and M. Parrinello, Annu. Rev. Phys. Chem., 2016, 67, 159–184 CrossRef CAS PubMed.
- G. M. Torrie and J. P. Valleau, J. Comput. Phys., 1977, 23, 187–199 CrossRef.
- T. M. Cover and J. A. Thomas, Elements of Information Theory, John Wiley & Sons, 2012 Search PubMed.
- J. Preto and C. Clementi, Phys. Chem. Chem. Phys., 2014, 16, 19181–19191 RSC.
- E. Chiavazzo, R. Covino, R. R. Coifman, C. W. Gear, A. S. Georgiou, G. Hummer and I. G. Kevrekidis, Proc. Natl. Acad. Sci. U. S. A., 2017, 114, E5494–E5503 CrossRef CAS.
- W. Chen and A. L. Ferguson, J. Comput. Chem., 2018, 39, 2079–2102 CrossRef CAS.
- M. Aghagolzadeh, H. Soltanian-Zadeh, B. Araabi and A. Aghagolzadeh, 2007 IEEE International Conference on Image Processing, 2007, pp. I–277 Search PubMed.
- I. Guyon and A. Elisseeff, J. Mach. Learn. Res, 2003, 3, 1157–1182 Search PubMed.
- J. MacQueen, Some methods for classification and analysis of multivariate observations, Proceedings of the Fifth Berkeley Symposium on Mathematical Statistics and Probability, ed. L. M. Le Cam and J. Neyman, 1967, pp. 281–297 Search PubMed.
- C. A. Sugar and G. M. James, J. Am. Stat. Assoc., 2003, 98, 750–763 CrossRef.
- P. E. Black, Greedy algorithm, 2005 Search PubMed.
- J. F. Kenney and E. Keeping, Mathematics of statistics, 1962, 1, 252–285 Search PubMed.
- R. Hegger, A. Altis, P. H. Nguyen and G. Stock, Phys. Rev. Lett., 2007, 98, 028102 CrossRef PubMed.
- S. Piana and A. Laio, Phys. Rev. Lett., 2008, 101, 208101 CrossRef PubMed.
- E. Facco, M. d'Errico, A. Rodriguez and A. Laio, Sci. Rep., 2017, 7, 12140 CrossRef PubMed.
- P. Tiwary and M. Parrinello, J. Phys. Chem. B, 2014, 119, 736–742 CrossRef.
- J. Pfaendtner and M. Bonomi, J. Chem. Theory Comput., 2015, 11, 5062–5067 CrossRef CAS.
- S. Piana and A. Laio, J. Phys. Chem. B, 2007, 111, 4553–4559 CrossRef CAS.
- M. Salvalaglio, P. Tiwary and M. Parrinello, J. Chem. Theory Comput., 2014, 10, 1420–1425 CrossRef CAS.
- P. Tiwary and M. Parrinello, Phys. Rev. Lett., 2013, 111, 230602 CrossRef.
- Y. Wang, J. M. L. Ribeiro and P. Tiwary, Nat. Commun., 2019, 10, 1–8 CrossRef.
- G. A. Tribello, M. Bonomi, D. Branduardi, C. Camilloni and G. Bussi, Comput. Phys. Commun., 2014, 185, 604–613 CrossRef CAS.
- M. Bonomi, G. Bussi and C. Camilloni, et al. , Nat. Methods, 2019, 16, 670–673 CrossRef.
- A. Barducci, G. Bussi and M. Parrinello, Phys. Rev. Lett., 2008, 100, 020603 CrossRef.
- A. C. Pan, H. Xu, T. Palpant and D. E. Shaw, J. Chem. Theory Comput., 2017, 13, 3372–3377 CrossRef CAS PubMed.
- V. Limongelli, M. Bonomi and M. Parrinello, Proc. Natl. Acad. Sci. U. S. A., 2013, 110, 6358–6363 CrossRef CAS PubMed.
Footnote |
| † These authors contributed equally. |
| This journal is © The Royal Society of Chemistry 2020 |