 Open Access Article
Creative Commons Attribution 3.0 Unported Licence
A structure–kinetic relationship study using matched molecular pair analysis†
Doris A. Schuetz‡
 ,
Lars Richter‡,
Riccardo Martini‡
 and
Gerhard F. Ecker
 *
*
Department of Pharmaceutical Chemistry, University of Vienna, UZA 2, Althanstrasse 14, 1090 Vienna, Austria. E-mail: gerhard.f.ecker@univie.ac.at
First published on 21st September 2020
Abstract
The lifetime of a binary drug–target complex is increasingly acknowledged as an important parameter for drug efficacy and safety. With a better understanding of binding kinetics and better knowledge about kinetic parameter optimization, intentionally induced prolongation of the drug–target residence time through structural changes of the ligand could become feasible. In this study we assembled datasets from 21 publications and the K4DD (Kinetic for Drug Discovery) database to conduct large scale data analysis. This resulted in 3812 small molecules annotated to 78 different targets from five protein classes (GPCRs: 273, kinases: 3238, other enzymes: 240, HSPs: 160, ion channels: 45). Performing matched molecular pair (MMP) analysis to further investigate the structure–kinetic relationship (SKR) in this data collection allowed us to identify a fundamental contribution of a ligand's polarity to its association rate, and in selected cases, also to its dissociation rate. However, we furthermore observed that the destabilization of the transition state introduced by increased polarity is often accompanied by simultaneous destabilization of the ground state resulting in an unaffected or even worsened residence time. Supported by a set of case studies, we provide concepts on how to alter ligands in ways to trigger on-rates, off-rates, or both.
Introduction
Importance of kinetic parameters in drug design
Multiple studies on the kinetic behavior of small molecules show how the lifetime of a binary drug–target complex is inevitable for translation into in vivo efficacy.1–6 The so-called drug residence time (τ), which is the time a drug spends bound to its protein target, not only influences efficacy, but is also linked to toxicity7 and off-target activity.8,9 The life span of this complex does not only need to be of minimal duration to achieve a certain function, but also, in particular cases, should not exceed a certain time for optimal function.10 Therefore, the residence time of a drug might be a key determinant for clinical success of drug candidates.11The two important kinetic parameters in drug–target binding kinetics are the on-rate and the off-rate. The on-rate or association rate, kon, is a measure of how fast a molecule binds to its biological target. The off-rate, koff, is the dissociation rate, which is the parameter most scientific publications have focused on. It is the inverse of the residence time, and therefore a measure for how long a compound remains bound to its protein target. The off-rate koff can be influenced in 2 ways: i) stabilization of the ground state12 and/or ii) destabilization of the transition state.13–15 In both cases, the energy difference between the bound state and the transition state needs to be increased to reach higher τ values. Stabilization of the ground state translates into improved affinity of the drug towards its target, which has been widely studied. In contrast, achieving an increase of residence time by destabilizing the transition state is a less explored field. There are only a few examples in the literature highlighting how to impact the transition state.14–16 In particular, it has been reported that different drugs with the same affinity for a given protein exhibit totally different kinetic behaviours.13 While the difference in energy between the bound state and the unbound state refers to the affinity, the difference in energy between the unbound state and the transition state can be directly translated into the association constant (kon). Increasing the energy barrier to overcome the transition state results in a slower binding event (the kon value gets smaller), and consequently in a prolonged residence time (assuming two different molecules display similar binding affinities) and the system is in an equilibrium state (where KD = koff/kon). Therefore, to understand how to trigger the residence time it is of crucial importance to grasp the relationship between structural modifications of a molecule and the effect on its koff and kon profile. While the functional efficacy is often correlated to the residence time,3 Copeland observed that kon also has to be considered for the pharmacological action of a drug.17 It contributes to kinetic selectivity by displaying different binding pathways for yet identical binding pockets.13 Furthermore, it translates into cellular and in vitro effects.18 Apart from that, the on-kinetics of a ligand significantly affect its profile and side effects, which has recently been demonstrated for the dopamine D2 receptor.19 Additionally, on-rates have been shown to be of significant importance for target occupancy20,21 and contribute to drug rebinding.22 It has also been shown that on-rates translate into kinetically biased agonism towards different pathways. Thus, Herenbrink et al. published that on-rates are the determining factor in GPCR downstream pathway prioritization, leading to different biological outcomes.23
In order to systematically explore the effect of distinct structural modifications on the kinetic profile of compound–target associations, we derived the hitherto largest kinetic dataset (KIND) available in the literature and used the kinetic data triplets for extensive matched molecular pair analysis.
Results and discussion
KIND (KINetic Dataset)
The kinetic dataset KIND (KINetic Dataset) contains a total of 3812 structures and their kinetic data triplets (kon, koff, KD). It has been compiled from 21 publications16,19,24–42 and the K4DD database (for details see the ESI,† the dataset is provided in KIND.xlsx). For the literature search, only papers containing numerical values for all three parameters investigated (KD, kon and koff) were selected. Moreover, papers reporting data for less than 10 compounds were excluded from the analysis. Furthermore, KIND contains the indication of the clinical phase the molecule has reached.The K4DD consortium merged the efforts of 22 partners from European academia and the pharmaceutical industry in order to explore the role of kinetics in drug discovery. The kinetic data points collected were mainly derived from SPR experiments, radioligand binding assays, ITC and kPCA. The data collected were enriched with assay conditions like different buffers or duration of the experiments. All collected information was used to populate the database for the K4DD project. Upon the end of the project, all non-confidential data were transferred to ChEMBL43 (http://chembl.blogspot.com/2018/05/chembl-24-released.html), and all data are available following the ChEMBL document ID CHEMBL3885741.
The KIND dataset contains 78 biological targets, comprising 3238 data triplets for kinases, 242 for GPCRs, 160 for heat shock proteins (HSPs), 127 for enzymes, and 45 for ion channels. To give a general overview on the distribution of physicochemical properties, three relevant ones were chosen to examine the dataset's property distribution. The three descriptors mentioned are log![[thin space (1/6-em)]](https://www.rsc.org/images/entities/char_2009.gif) P(o/w), TPSA, and molecular weight, and the respective graphs for the different target classes of the database can be found in Fig. S1.† The log
P(o/w), TPSA, and molecular weight, and the respective graphs for the different target classes of the database can be found in Fig. S1.† The log![[thin space (1/6-em)]](https://www.rsc.org/images/entities/char_2009.gif) P(o/w) was chosen as a measure of hydrophobicity of a compound, while the TPSA was chosen to represent polarity. This large dataset offered the opportunity to analyze and extrapolate general trends of kinetic behavior of compounds on different targets. The analysis was limited to the available data, which in the case of the ion channels was a single publication reporting kinetic data of hERG inhibitors.31 In this case all the compounds display rather high lipophilicity values, which is a relevant property for hERG inhibition and explains the shift of the property distribution in Fig. S1.† The correlations of on-rates (displayed as pkon) and affinity (pKD) for different target classes (Fig. 1) indicate that for most target classes, the on-rates and corresponding affinity values show a negative correlation. The same trend across target classes cannot be observed for the correlation between off-rates (displayed as pkoff) and affinity (pKD) (Fig. 2).
P(o/w) was chosen as a measure of hydrophobicity of a compound, while the TPSA was chosen to represent polarity. This large dataset offered the opportunity to analyze and extrapolate general trends of kinetic behavior of compounds on different targets. The analysis was limited to the available data, which in the case of the ion channels was a single publication reporting kinetic data of hERG inhibitors.31 In this case all the compounds display rather high lipophilicity values, which is a relevant property for hERG inhibition and explains the shift of the property distribution in Fig. S1.† The correlations of on-rates (displayed as pkon) and affinity (pKD) for different target classes (Fig. 1) indicate that for most target classes, the on-rates and corresponding affinity values show a negative correlation. The same trend across target classes cannot be observed for the correlation between off-rates (displayed as pkoff) and affinity (pKD) (Fig. 2).
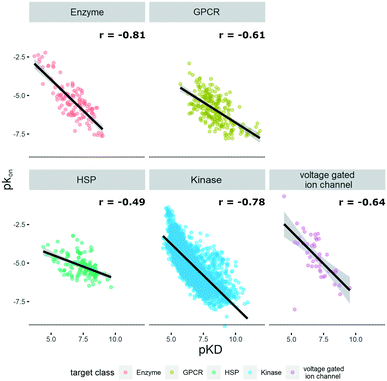 | ||
| Fig. 1 Correlation of affinity and on-rates, where pKD is plotted on the x-axis and pkon is plotted on the y-axis. Target families are displayed in different colours. Regression line is indicated, and error bars are shaded in grey. Pearson's R coefficient (r) for each class is displayed. Further details are reported in Table S1.† R 3.6.3 was used for statistical analysis and visualization. | ||
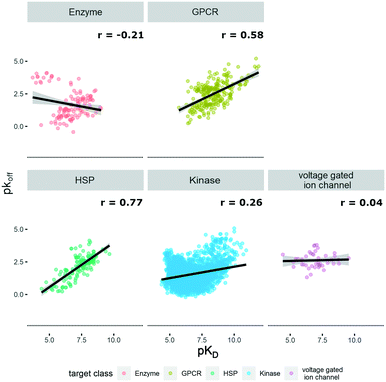 | ||
| Fig. 2 Correlation of affinity and off-rates, where pKD is plotted on the x-axis and pkoff is plotted on the y-axis. Target families are displayed in different colours. Regression line is indicated, and error bars are shaded in grey. Pearson's R coefficient (r) for each class is displayed. Further details are reported in Table S2.† R 3.6.3 was used for statistical analysis and visualization. | ||
Thus, the effect where ameliorated affinity accelerates binding seems to be a general trend. However, elaborating on specific examples (see the Case studies section) showcases opportunities on how on-kinetics can be influenced independently from affinity.
Matched molecular pair (MMP) dataset and its analysis
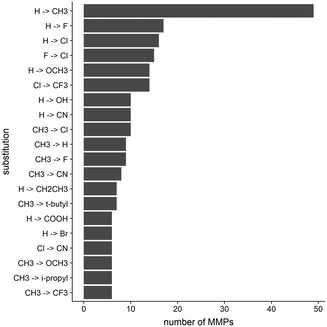
In order to elucidate the impact small structural changes might have on the kinetic behavior of a molecule, we analyzed in total 395 matched molecular pairs (MMPs) extracted from KIND. Such pairs are composed of two molecules possessing an identical scaffold and showing one minor chemical modification (i.e. introduction of a substituent onto an unsubstituted aromatic ring, or replacement of a functional group by another group).The dataset includes a variety of different modifications. The top 20 modifications represent less than 65% of the entire dataset, while the most common modification, which is the introduction of a methyl group to replace a hydrogen atom, comprises around 15%. The 20 most common transformations found in the MMP dataset are reported in Fig. 3. These chemical substitutions are in fact moieties which are prominently used in a medicinal chemistry context to optimize compounds in the drug discovery pipeline.
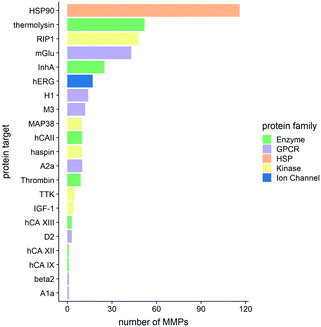
Fig. 4 shows the distribution of the MMPs among different protein targets and how they cluster in various protein families.
We previously demonstrated that changes in a molecule's polarity are the major factor for kon alteration in Hsp90.24 In order to investigate whether this hypothesis can be generalized across targets, we analyzed KIND by focusing on the MMPs with the highest differences in kon values. All pairs were sorted according to decreasing kon, and the top 20 were selected for further analysis (Table 1).
| Δpkon | Δpkoff | ΔpKD | MMP_summary | Target | Target_class | ΔTPSA |
|---|---|---|---|---|---|---|
| 2.06 | −0.13 | −2.15 | CH3 → COOH | hERG | Voltage gated ion channel | 37.30 |
| 1.98 | −0.24 | −2.22 | H → CH(CH3)NHCH3 | MAP38 | Kinase | 3.24 |
| 1.71 | 1.44 | −0.27 | CH3 → H | H1 | GPCR | 11.00 |
| 1.64 | −0.09 | −1.73 | CH3 → H | H1 | GPCR | 11.00 |
| 1.59 | 1.00 | −0.60 | H → CH2COOH | H1 | GPCR | 37.30 |
| 1.56 | 2.82 | 1.26 | C(![[double bond, length as m-dash]](https://www.rsc.org/images/entities/char_e001.gif) O)OCH3 → COOH O)OCH3 → COOH |
H1 | GPCR | 11.00 |
| 1.51 | −0.19 | −1.68 | CH3 → CN | hERG | Voltage gated ion channel | 23.79 |
| 1.50 | 0.37 | −1.39 | H → COOH | hERG | Voltage gated ion channel | 37.30 |
| 1.48 | 1.29 | −0.20 | C(![[double bond, length as m-dash]](https://www.rsc.org/images/entities/char_e001.gif) O)OCH3 → COOH O)OCH3 → COOH |
H1 | GPCR | 11.00 |
| 1.44 | −0.02 | −1.05 | CH2CH3 → H | hERG | Voltage gated ion channel | 8.79 |
| 1.39 | 0.05 | −1.34 | Br → COOH | HSP90 | HSP | 37.30 |
| 1.34 | 0.30 | −1.02 | CH3 → t-butyl | HSP90 | HSP | 0.00 |
| 1.19 | −0.06 | −1.19 | H → F | hERG | Voltage gated ion channel | 0.00 |
| 1.19 | 0.59 | −0.60 | OCH3 → COOH | H1 | GPCR | 17.07 |
| 1.16 | 0.02 | −1.14 | CH3 → F | HSP90 | HSP | 0.00 |
| 1.11 | 0.49 | −0.67 | H → OCH3 | HSP90 | HSP | 9.23 |
| 1.11 | 0.10 | −1.01 | CH3 → F | TTK | Kinase | 0.00 |
| 1.11 | 0.13 | −0.98 | H → OCH2CH3 | HSP90 | HSP | 9.23 |
| 1.04 | 1.97 | 0.94 | OCH3 → COOH | H1 | GPCR | 17.07 |
| 1.03 | −0.66 | −1.69 | H → CH(CH3)NHCH3 | MAP38 | Kinase | 3.24 |
All five different protein families are present in the top 20 positions, granting diversity of the subset. For nearly all the MMPs (16 out of 20) a substitution that increases polarity is reported. This is a general finding which can be observed across the entire dataset. The largest differences in on-rates were found when introducing charged moieties. By introducing those moieties, a slowdown of the on-rate of 0.5 up to 2 orders of magnitude could be observed. The responsible for such a kon decrease might be: i) the electrostatic repulsion (e.g. a charged moiety that transits through a binding pathway which displays similar electrostatic characteristics) and/or ii) desolvation penalties (e.g. a polar moiety that traverses through a hydrophobic passage and therefore needs to strip off all water molecules solvating it). Among the 20 pairs examined, 18 are accompanied by a concomitant impairment of affinity. This is expected if a modification on the ligand doesn't provide any additional interaction once the molecule accommodates its bound pose within the binding site. Conversely, if such modifications establish additional interactions in the final bound complex, an improvement in affinity can be achieved. The latter could be observed in two of our proposed case studies (Case study 1 and Case study 3 discussed in detail below). A concurrent slowdown of the on-rate and improvement of KD results in a prolonged residence time.
Apart from the association rate constant kon, we also analyzed the dissociation rate constant koff. Following the procedure we established for the on-rate, we sorted the MMP dataset according to the biggest difference in koff, and the 20 pairs showing the most pronounced difference in dissociation rates were selected (Table 2).
| Δpkoff | Δpkon | ΔpKD | MMP_summary | Target | Target_class | ΔTPSA |
|---|---|---|---|---|---|---|
| 2.82 | 1.56 | 1.26 | C(![[double bond, length as m-dash]](https://www.rsc.org/images/entities/char_e001.gif) O)OCH3 → COOH O)OCH3 → COOH |
H1 | GPCR | 11.00 |
| 2.44 | −1.68 | 3.99 | H → I | Haspin | Kinase | 0.00 |
| 2.23 | −1.03 | 3.20 | H → OH | A2a | GPCR | 20.23 |
| 2.14 | 0.06 | 1.80 | CH3 → H | M3 | GPCR | 11.00 |
| 2.09 | 0.89 | 1.20 | H → COOH | Thermolysin | Enzyme | 40.13 |
| 2.02 | −0.66 | 2.42 | F → I | Haspin | Kinase | 0.00 |
| 1.97 | 1.04 | 0.94 | OCH3 → COOH | H1 | GPCR | 17.07 |
| 1.79 | 0.32 | 1.48 | H → COOH | Thermolysin | Enzyme | 40.13 |
| 1.75 | 0.73 | 0.70 | H → OH | M3 | GPCR | 20.23 |
| 1.74 | −1.69 | 3.35 | H → Br | Haspin | Kinase | 0.00 |
| 1.66 | −1.15 | 2.77 | H → Cl | Haspin | Kinase | 0.00 |
| 1.56 | 0.08 | 1.40 | OH → CH2OH | M3 | GPCR | 0.00 |
| 1.44 | 1.71 | −0.27 | CH3 → H | H1 | GPCR | 11.00 |
| 1.40 | −0.38 | 1.78 | H → CH3 | MAP38 | Kinase | 0.00 |
| 1.34 | 0.71 | 0.61 | H → OCH3 | IGF-1 | Kinase | 9.23 |
| 1.33 | 0.76 | 0.30 | CH3 → OH | M3 | GPCR | 20.23 |
| 1.32 | −0.67 | 1.79 | F → Br | Haspin | Kinase | 0.00 |
| 1.29 | 1.48 | −0.20 | C(![[double bond, length as m-dash]](https://www.rsc.org/images/entities/char_e001.gif) O)OCH3 → COOH O)OCH3 → COOH |
H1 | GPCR | 11.00 |
| 1.23 | −0.13 | 1.21 | F → Cl | Haspin | Kinase | 0.00 |
| 1.21 | −0.19 | 1.40 | F → CN | IGF-1 | Kinase | 12.03 |
Conversely to the kon data, a change in polarity in the MMPs did not produce a consistent shift in the average value for koff. The plots in Fig. 5 illustrate that the behavior we observed for the 20 examined MMPs can be seen for the entire dataset. Fig. 5 furthermore exemplifies how polar substitutions affect on-rates significantly differently from apolar substitutions (Wilcoxon signed rank test p-value = 1.62 × 10⁻¹⁰ and p-value = 0.16 respectively), with almost 75% of the data points showing an increase of Δpkon (polar box-plot in dark cyan, on the left-hand side in Fig. 5). However, an analogous impact of the polarity variation on Δpkoff cannot be retrieved (polar box-plot in dark cyan on the right-hand side of Fig. 5).
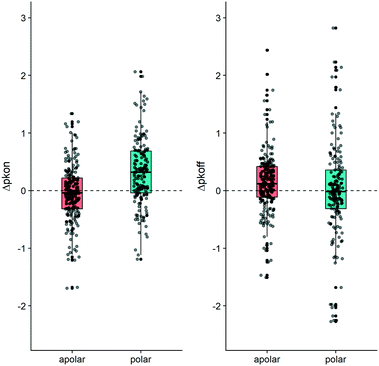 | ||
| Fig. 5 Boxplot depicting the contribution to Δpkon (left-hand side) and to Δpkoff (right-hand side). The MMP dataset has been divided according to the shift in ΔTPSA. The “apolar” boxplot (coral color) exemplifies matched pairs which do not show a change in TPSA. The “polar” (dark cyan color) boxplot depicts matched molecular pairs for which the TPSA value changed (p-values reported in Table S3†). R 3.6.3 was used for statistical analysis and visualization. | ||
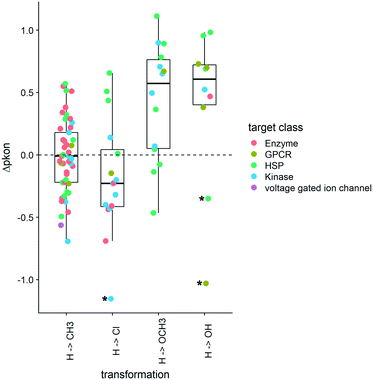
As the distribution of kon values varies according to target classes, we are looking at the change of the on-rates rather than absolute values. These Δpkon values showcase how a change of substitution affects the on-rate in a positive or a negative way. An increase in pkon (+Δpkon) leads to a slower on-rate, while a decrease in pkon (−Δpkon) speeds up the binding of the small molecule to its protein target. The boxplots in Fig. 6 depict a set of specific cases of a hydrogen atom being substituted by CH3, Cl, OCH3, or OH. Although exchange by a methyl group leads to a variety of effects on kon (including the increase and decrease of on-rates), the mean change is close to 0. Overall, for this MMP no general trend can be deduced across target classes, or even within one target class. In contrast, substitution of H by a methoxy group leads to a slowdown of molecules acting on kinases and most HSPs as well as the example we could obtain for GPCR ligands. Alike, the collected examples for hydroxylated compounds show a similar slowdown in on-rates.
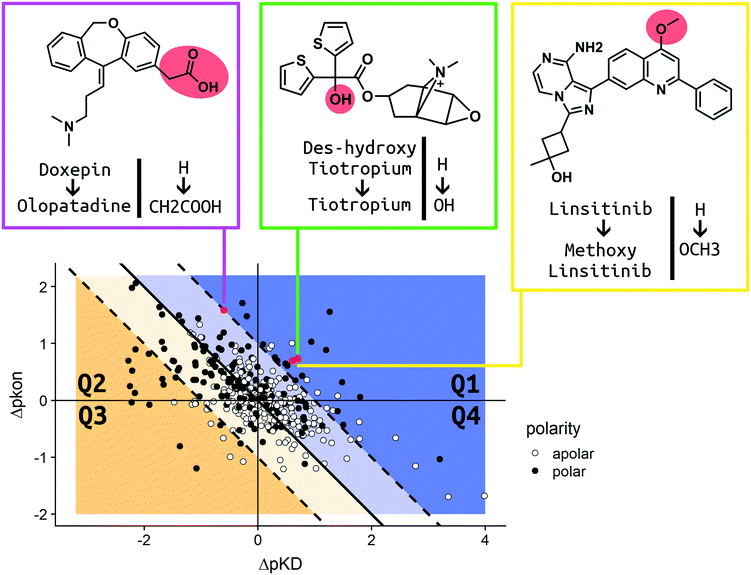
In order to present an overview on the results in a visual manner, we constructed a kinetic map for the MMPs (Fig. 7). The map describes the MMPs according to their shift in pKD and pkon (x and y axis, respectively) with additional information on the respective change in the TPSA profile. Due to the relationship of ΔpKD and Δpkon, (KD = koff/kon) it is also possible to visualize Δpkoff (diagonal lines) on the same chart. White dots are used to report MMPs for which no difference in the calculated TPSA was observed. Black dots show all pairs whose polarity was impacted due to the introduced ligand modification (for consistency, all the pair transformations are written to display an increase in ΔTPSA for the MMP). The map has been divided into four quadrants. In Q1 (top right corner) the MMPs are reported, which show an increase in residence time by both stabilizing the bound state (amelioration of pKD) and destabilizing the transition state (slowdown of pkon) after substitution.
The modifications observed in Q1 constitute the best-case scenario in terms of prolonging the residence time inasmuch as the change produces a ligand with longer binding (increased Δpkoff). Q2 (top left corner) includes those pairs which show a destabilization in their transition state (positive Δpkon therefore, a slowdown of the on-rate), but a simultaneous reduction in affinity (negative ΔpKD therefore, a loss in affinity). Due to the large variation, we observed cases in which the alterations produced molecules with an increased residence time (blue Q2 area) as well as a reduced residence time (yellow Q2 area). The Q3 quadrant (bottom left corner) covers MMPs whose alteration resulted in a decrease of affinity (negative ΔpKD) and an increase of the on-rate (negative Δpkon). The residence time is decreased for all pairs found in Q3. Q4 (bottom right quadrant) contains matched pair values which are derived from chemical modifications which increase affinity (positive ΔpKD) and trigger faster binding (negative Δpkon). Similar to Q2, the variation of the Δpkoff for this quadrant depends on the shift of Δpkon and ΔpKD. All cases resulting in a prolonged residence time are placed in the blue area of Q4. The yellow area comprises MMPs for which the ameliorated pKD didn't compensate the faster binding, which results in a decreased residence time. For a more detailed analysis, we chose three relevant MMPs to discuss their kinetic parameter shifts in the Case studies section.
Case studies
In order to discuss the trends observed in more detail, we present three case studies, which were chosen according to the different scenarios reported and visualized in our analysis (Fig. 7). As we aim to impact drug–target kinetics toward prolonged residence time benefiting from transition state destabilization, regardless of the change in affinity, we chose examples from quadrants Q1 and Q2. Tiotropium and linsitinib, as well as their matched pair analogues, represent the ideal scenario for a lead optimization program that aims to find molecules with high affinity and long residence time.Case study 1 (Q1; H–OH)
The long-acting muscarinic antagonist tiotropium, which shows very high affinity for the M3 muscarinic acetylcholine receptor (pKD: 11.7, corresponding to 2 pM) remains bound to its receptor for 2.724 minutes.30Fig. 8 shows numerous interactions of the molecule with its protein target. The area highlighted in red indicates a hydrogen bond of the hydroxyl group on tiotropium and the carbonyl group on Asn507. The hydroxyl group acts as a H-bond donor. Its structural analogue, des-hydroxy tiotropium, is shown in the cyan box of Fig. 8. As the analogue lacks the hydroxyl group it is not expected to participate in the protein–ligand interaction the hydroxyl group was engaged in. The more apolar compound des-hydroxy tiotropium displays a faster on-rate, when compared to tiotropium, and a concomitant worsening of pKD (pKD des-hydroxy tiotropium: 11.0, corresponding to 10 pM). The energy barrier which des-hydroxy tiotropium has to overcome has been calculated to be 1.18 kcal mol−1 lower than the one of tiotropium.30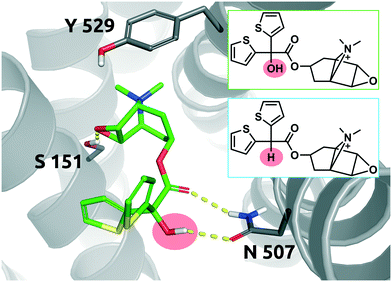 | ||
| Fig. 8 2D representation of the small molecule tiotropium (green box). Tiotropium bound to the binding pocket of the M3 muscarinic acetylcholine receptor (PDB: 4DAJ). Tiotropium is shown in green, stick representation. The hydroxyl group performing the polar interaction inside the binding pocket is highlighted in red. Des-hydroxy tiotropium derived from a study conducted by Tautermann et al.30 is depicted in 2D for comparison (cyan box). Residues of the M3 receptor are depicted in grey. Interactions of the drug and the protein are visualized in dashed yellow lines. PyMol 2.7 was used for visualization of the protein and small molecule. ChemDraw 14 was employed to show the 2D depiction. | ||
The 5-fold increase in affinity of tiotropium vs. des-hydroxy tiotropium and the accompanying 5.5-fold slowdown of the on-rate (kon) result in a 56-fold increase in residence time. This compound pair thus represents a good example for transformations in quadrant Q1 (Fig. 7).
Case study 2 (Q2; H–CH2COOH)
Doxepin is a tricyclic antidepressant with histamine H1 receptor antagonist properties. It inhibits H1, H2, 5-HT2A, 5-HT2B, muscarinic acetylcholine receptors M1–M5, alpha1 and alpha2 adrenergic receptors, and the D2 receptor.44 Bosma et al. reported that olopatadine, which is a selective histamine H1 antagonist, exhibits a 39-fold slower on-rate than doxepin. Fig. 9 shows doxepin in its bound pose (PDB: 3RZE) and olopatadine, which is expected to accommodate the binding pocket in a similar fashion.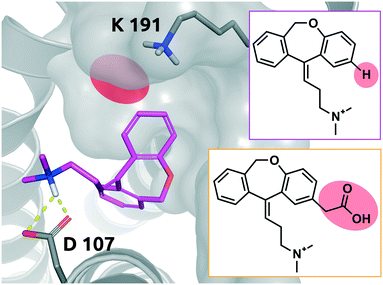 | ||
| Fig. 9 2D representation of the small molecule doxepin (magenta box). Doxepin bound to the binding pocket of the histamine H1 receptor (PDB: 3RZE). Doxepin is shown in magenta, stick representation. The substitution site that will accommodate the substituent for the matched molecular pair olopatadine is highlighted in red. Olopatadine derived from a study conducted by Shimamura et al.45 is depicted in 2D for comparison (orange box). Residues of the H1 receptor are depicted in grey. Interactions of the drug and the protein are visualized in dashed yellow lines. PyMol 2.7 was used for visualization of the protein and small molecule. ChemDraw 14 was employed to show the 2D depiction. | ||
The drugs show a less than 4-fold difference in KD to the H1 receptor (doxepin: 0.8 nM, olopatadine: 3.1 nM); however, the residence time of doxepin is reported to be around 22 minutes, while olopatadine is determined to remain bound for 170 minutes.46 The affinity could not be fully preserved; however, a 39-fold prolongation of the on-rate and a 10-fold prolongation of the off-rate could be achieved by substitution of a hydrogen atom by carboxymethyl. The doxepin–olopatadine matched molecular pair showcases an example of a prolonged residence time mainly driven by an increase of Δpkon, passing from kon of 1.17 × 10⁶ M−1 s−1 for doxepin to a value of 3 × 10⁴ M−1 s−1 for olopatadine. In fact, the destabilization of the transition state poses a significant barrier for the unbinding of the molecule from its bound state.
Case study 3 (Q1; H–OCH3)
Linsitinib and its analogues are small molecules that inhibit the type 1 insulin-like growth factor (IGF-1) receptor, a well-known cell survival pathway activator and tumor growth promoter.47 PQIP, an analogue of linsitinib, has been crystallized in complex with its receptor. PQIP is structurally very similar to linsitinib and its methoxylated analogue.Therefore, PQIP has been used for our structural study, as a similar binding mode for linsitinib and its methoxylated analogue might be assumed. From SPR studies conducted within the K4DD consortium, linsitinib and methoxy-linsitinib show around 4-fold differences in KD with the more polar compound being the more affine (linsitinib: 55.8 nM, methoxy-linsitinib: 13.8 nM). Such an increase in affinity might be explained by the introduction of a polar moiety in a fairly polar area, in which water molecules can be found if no ligand is bound. The crystal structure of PQIP bound to the IGF-1 receptor shows such water molecules in close vicinity of the substitution site of the MMP (Fig. 10). Moreover, the increase of the molecule's polarity generates a slower entrance (linsitinib: 8.92 × 10⁴ M−1 s−1, methoxy-linsitinib: 1.75 × 10⁴ M−1 s−1), resulting in a prolonged residence time for the methoxylated molecule with respect to the approved drug (linsitinib: 3.78 minutes, methoxy-linsitinib: 82.46 minutes). The introduction of a moiety that mildly disrupts the entry pathway by increasing the energy of the transition state, in combination with the favorable interactions once it reaches the bound state, locates this MMP in the Q1 quadrant of Fig. 7. Similar to Case study 1, the increase of the residence time is due to both the affinity increase and a slowdown of the access.
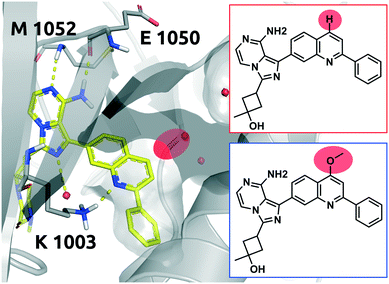 | ||
| Fig. 10 2D representation of the small molecule linsitinib (red box). As a reference the linsitinib analogue PQIP bound to the binding pocket of the insulin-like growth factor 1 (IGF-1) receptor (PDB: 3D94) is shown in yellow. PQIP48 and linsitinib are assumed to accommodate similar binding poses, inasmuch as their structural differences can be found on the solvent exposed side only. The red circle highlights the location of the matched molecular pair substitution. The methoxylated linsitinib derived from a study by Jin et al.49 is depicted in 2D for comparison (blue box). Residues of the IGF-1 receptor are depicted in grey. Interactions of the drug and the protein are visualized in dashed yellow lines. Water molecules are represented as red spheres. PyMol 2.7 was used for visualization of the protein and small molecule. ChemDraw 14 was employed to show the 2D depiction. | ||
Conclusions
Thermodynamic and kinetic molecular basis
To the best of our knowledge, our dataset KIND is the largest publicly available kinetic dataset so far, comprising a total of 3812 small molecules. Taking advantage of the abundance of data, we could illustrate how to trigger the kinetic behavior of small molecules and derive more generalized trends. One of our key findings illustrates that kon generally correlates better with KD than koff does (shown in Fig. 1 and 2). This trend can generally be observed among GPCRs, ion channels and soluble proteins.In our work, we have provided examples for slowing down association rates by introducing polar moieties to a small molecule, which will have to be desolvated while entering the binding pocket.24,50 Furthermore, we have provided structural insight on how the residence time can remain unaltered, even though individual contributions of KD and kon change significantly. The trend we aim to illustrate is that the addition of polar moieties to small molecules tends to affect on-rates if their desolvation is part of the binding process. Those trends, which were showcased for proteins affiliated with three different families, could be extrapolated to other protein families and provide a more generalized scheme to trigger kinetic parameters, specifically for a hydrophobic pocket environment. Various MMPs presented in this work impact the association rate significantly, and some of them result in altered residence times. This could be achieved due to the introduction of an increased energy barrier along the (un)binding pathway (kinetic contribution) and furthermore, by additionally established interactions of the aforementioned polar groups once the molecule is bound (thermodynamic contribution). Putting our findings in context with scientific publications on enthalpic and entropic contributions to on- and off- rates (Fig. S2 and Table S4†), the enthalpic signature of the on-rate, which contributes to the energy barrier, is predominant.
The gained knowledge about how to trigger kinetic parameters of small molecules binding to protein targets is valuable information. For different targets diverse ranges of residence times are considered to be optimal. Therefore, the ability to tailor a compound's residence time according to its biological target and the desired effect would be the best-case scenario.
In future analysis, we want to extend our studies to include information about the protein binding pocket environment using the matched pair (MMP) analysis. Employing grid based methods48 will allow us to distinguish between different binding pockets. This more complete perspective might identify the preconditions for different kinds of substituents to achieve both the slowdown of the binding event (introduction of an energy barrier along the pathway) and simultaneous stabilization of the ground state (improving affinity for the receptor) on a broader scale. Optimization of binding kinetics of course is a complex process with many factors contributing. Nevertheless, with this contribution we aimed to shed light on this still underexplored field by providing guidance for a more rationalized modification of molecules in order to effectively steer the residence time in the context of lead optimization.
Conflicts of interest
Gerhard F. Ecker is co-founder of Phenaris GmbH.Acknowledgements
This work was supported by the EU/EFPIA Innovative Medicines Initiative (IMI) Joint Undertaking, K4DD (grant no. 1115366). This paper reflects only the authors' views and neither the IMI nor the European Commission is liable for any use that may be made of the information contained herein. Furthermore, we want to thank Bernhard Knasmüller for support on the methodologies for the database structure.Notes and references
- D. A. Schuetz, W. E. A. de Witte, Y. C. Wong, B. Knasmueller, L. Richter, D. B. Kokh, S. K. Sadiq, R. Bosma, I. Nederpelt, L. H. Heitman, E. Segala, M. Amaral, D. Guo, D. Andres, V. Georgi, L. A. Stoddart, S. Hill, R. M. Cooke, C. De Graaf, R. Leurs, M. Frech, R. C. Wade, E. C. M. de Lange, A. P. IJzerman, A. Müller-Fahrnow and G. F. Ecker, Drug Discovery Today, 2017, 22, 896–911 Search PubMed.
- P. J. Tonge, ACS Chem. Neurosci., 2018, 9, 29–39 Search PubMed.
- A. C. Pan, D. W. Borhani, R. O. Dror and D. E. Shaw, Drug Discovery Today, 2013, 18, 667–673 Search PubMed.
- R. Zhang and F. Monsma, Curr. Opin. Drug Discovery Dev., 2009, 12, 488–496 Search PubMed.
- D. C. Swinney, Curr. Opin. Drug Discovery Dev., 2009, 12, 31–39 Search PubMed.
- C. J. Lee and J. E. Ansell, Br. J. Clin. Pharmacol., 2011, 72, 581–592 Search PubMed.
- H. Nakajima, N. Kiyokawa, Y. U. Katagiri, T. Taguchi, T. Suzuki, T. Sekino, K. Mimori, T. Ebata, M. Saito, H. Nakao, T. Takeda and J. Fujimoto, J. Biol. Chem., 2001, 276, 42915–42922 Search PubMed.
- S. Kapur and P. Seeman, Am. J. Psychiatry, 2001, 158, 360–369 Search PubMed.
- G. Vauquelin, S. Bostoen, P. Vanderheyden and P. Seeman, Naunyn-Schmiedeberg's Arch. Pharmacol., 2012, 385, 337–372 Search PubMed.
- P. A. González, L. J. Carreño, D. Coombs, J. E. Mora, E. Palmieri, B. Goldstein, S. G. Nathenson and A. M. Kalergis, Proc. Natl. Acad. Sci. U. S. A., 2005, 102, 4824–4829 Search PubMed.
- R. A. Copeland, D. L. Pompliano and T. D. Meek, Nat. Rev. Drug Discovery, 2006, 5, 730–739 Search PubMed.
- G. Klebe, ChemMedChem, 2015, 10, 229–231 Search PubMed.
- A. C. Kruse, J. Hu, A. C. Pan, D. H. Arlow, D. M. Rosenbaum, E. Rosemond, H. F. Green, T. Liu, P. S. Chae, R. O. Dror, D. E. Shaw, W. I. Weis, J. Wess and B. K. Kobilka, Nature, 2012, 482, 552–556 Search PubMed.
- A. Schoop and F. Dey, Drug Discovery Today: Technol., 2015, 17, 9–15 Search PubMed.
- H. Lu, J. N. Iuliano and P. J. Tonge, Curr. Opin. Chem. Biol., 2018, 44, 101–109 Search PubMed.
- L. A. Spagnuolo, S. Eltschkner, W. Yu, F. Daryaee, S. Davoodi, S. E. Knudson, E. K. H. Allen, J. Merino, A. Pschibul, B. Moree, N. Thivalapill, J. J. Truglio, J. Salafsky, R. A. Slayden, C. Kisker and P. J. Tonge, J. Am. Chem. Soc., 2017, 139, 3417–3429 Search PubMed.
- R. A. Copeland, Nat. Rev. Drug Discovery, 2016, 15, 87–95 Search PubMed.
- G. K. Walkup, Z. You, P. L. Ross, E. K. H. Allen, F. Daryaee, M. R. Hale, J. O'Donnell, D. E. Ehmann, V. J. A. Schuck, E. T. Buurman, A. L. Choy, L. Hajec, K. Murphy-Benenato, V. Marone, S. A. Patey, L. A. Grosser, M. Johnstone, S. G. Walker, P. J. Tonge and S. L. Fisher, Nat. Chem. Biol., 2015, 11, 416–423 Search PubMed.
- D. A. Sykes, H. Moore, L. Stott, N. Holliday, J. A. Javitch, J. R. Lane and S. J. Charlton, Nat. Commun., 2017, 8, 763 Search PubMed.
- G. Vauquelin, Br. J. Pharmacol., 2016, 173, 2319–2334 Search PubMed.
- W. E. A. de Witte, M. Danhof, P. H. van der Graaf and E. C. M. de Lange, Trends Pharmacol. Sci., 2016, 37, 831–842 Search PubMed.
- G. Vauquelin, Expert Opin. Drug Discovery, 2010, 5, 927–941 Search PubMed.
- C. Klein Herenbrink, D. A. Sykes, P. Donthamsetti, M. Canals, T. Coudrat, J. Shonberg, P. J. Scammells, B. Capuano, P. M. Sexton, S. J. Charlton, J. A. Javitch, A. Christopoulos and J. R. Lane, Nat. Commun., 2016, 7, 10842 Search PubMed.
- D. A. Schuetz, L. Richter, M. Amaral, M. Grandits, U. Grädler, D. Musil, H.-P. Buchstaller, H.-M. Eggenweiler, M. Frech and G. F. Ecker, J. Med. Chem., 2018, 61, 4397–4411 Search PubMed.
- J. Cramer, S. G. Krimmer, V. Fridh, T. Wulsdorf, R. Karlsson, A. Heine and G. Klebe, ACS Chem. Biol., 2017, 12, 225–233 Search PubMed.
- C. Heroven, V. Georgi, G. K. Ganotra, P. Brennan, F. Wolfreys, R. C. Wade, A. E. Fernández-Montalván, A. Chaikuad and S. Knapp, Angew. Chem., Int. Ed., 2018, 57, 7220–7224 Search PubMed.
- J. Winquist, S. Geschwindner, Y. Xue, L. Gustavsson, D. Musil, J. Deinum and U. H. Danielson, Biochemistry, 2013, 52, 613–626 Search PubMed.
- R. Gaspari, C. Rechlin, A. Heine, G. Bottegoni, W. Rocchia, D. Schwarz, J. Bomke, H.-D. Gerber, G. Klebe and A. Cavalli, J. Med. Chem., 2016, 59, 4245–4256 Search PubMed.
- V. O. Talibov, V. Linkuvienė, D. Matulis and U. H. Danielson, J. Med. Chem., 2016, 59, 2083–2093 Search PubMed.
- C. S. Tautermann, T. Kiechle, D. Seeliger, S. Diehl, E. Wex, R. Banholzer, F. Gantner, M. P. Pieper and P. Casarosa, J. Med. Chem., 2013, 56, 8746–8756 Search PubMed.
- Z. Yu, J. P. D. van Veldhoven, J. Louvel, I. M. E. 't Hart, M. B. Rook, M. A. G. van der Heyden, L. H. Heitman and A. P. IJzerman, J. Med. Chem., 2015, 58, 5916–5929 Search PubMed.
- D. A. Sykes and S. J. Charlton, Br. J. Pharmacol., 2012, 165, 2672–2683 Search PubMed.
- J. C. M. Uitdehaag, J. de Man, N. Willemsen-Seegers, M. B. W. Prinsen, M. A. A. Libouban, J. G. Sterrenburg, J. J. P. de Wit, J. R. F. de Vetter, J. A. D. M. de Roos, R. C. Buijsman and G. J. R. Zaman, J. Mol. Biol., 2017, 429, 2211–2230 Search PubMed.
- J. Regan, C. A. Pargellis, P. F. Cirillo, T. Gilmore, E. R. Hickey, G. W. Peet, A. Proto, A. Swinamer and N. Moss, Bioorg. Med. Chem. Lett., 2003, 13, 3101–3104 Search PubMed.
- R. Bosma, G. Witt, L. A. I. Vaas, I. Josimovic, P. Gribbon, H. F. Vischer, S. Gul and R. Leurs, Front. Pharmacol., 2017, 8, 1–15 Search PubMed.
- V. Georgi, F. Schiele, B.-T. Berger, A. Steffen, P. A. Marin Zapata, H. Briem, S. Menz, C. Preusse, J. D. Vasta, M. B. Robers, M. Brands, S. Knapp and A. Fernández-Montalván, J. Am. Chem. Soc., 2018, 140, 15774–15782 Search PubMed.
- M. Gillard, C. Van Der Perren, N. Moguilevsky, R. Massingham and P. Chatelain, Mol. Pharmacol., 2002, 61, 391–399 Search PubMed.
- B. A. Fleck, S. R. J. Hoare, R. R. Pick, M. J. Bradbury and D. E. Grigoriadis, J. Pharmacol. Exp. Ther., 2012, 341, 518–531 Search PubMed.
- N. Willemsen-Seegers, J. C. M. Uitdehaag, M. B. W. Prinsen, J. R. F. de Vetter, J. de Man, M. Sawa, Y. Kawase, R. C. Buijsman and G. J. R. Zaman, J. Mol. Biol., 2017, 429, 574–586 Search PubMed.
- M. L. J. Doornbos, J. M. Cid, J. Haubrich, A. Nunes, J. W. van de Sande, S. C. Vermond, T. Mulder-Krieger, A. A. Trabanco, A. Ahnaou, W. H. Drinkenburg, H. Lavreysen, L. H. Heitman, A. P. IJzerman and G. Tresadern, J. Med. Chem., 2017, 60, 6704–6720 Search PubMed.
- M. Congreve, S. P. Andrews, A. S. Doré, K. Hollenstein, E. Hurrell, C. J. Langmead, J. S. Mason, I. W. Ng, B. Tehan, A. Zhukov, M. Weir and F. H. Marshall, J. Med. Chem., 2012, 55, 1898–1903 Search PubMed.
- M. Yoshikawa, M. Saitoh, T. Katoh, T. Seki, S. V. Bigi, Y. Shimizu, T. Ishii, T. Okai, M. Kuno, H. Hattori, E. Watanabe, K. S. Saikatendu, H. Zou, M. Nakakariya, T. Tatamiya, Y. Nakada and T. Yogo, J. Med. Chem., 2018, 61, 2384–2409 Search PubMed.
- A. Gaulton, L. J. Bellis, A. P. Bento, J. Chambers, M. Davies, A. Hersey, Y. Light, S. McGlinchey, D. Michalovich, B. Al-Lazikani and J. P. Overington, Nucleic Acids Res., 2012, 40, D1100–D1107 Search PubMed.
- A. D. Krystal, E. Richelson and T. Roth, Sleep Med. Rev., 2013, 17, 263–272 Search PubMed.
- T. Shimamura, M. Shiroishi, S. Weyand, H. Tsujimoto, G. Winter, V. Katritch, R. Abagyan, V. Cherezov, W. Liu, G. W. Han, T. Kobayashi, R. C. Stevens and S. Iwata, Nature, 2011, 475, 65–70 Search PubMed.
- R. Bosma, L. A. Stoddart, V. Georgi, M. Bouzo-Lorenzo, N. Bushby, L. Inkoom, M. J. Waring, S. J. Briddon, H. F. Vischer, R. J. Sheppard, A. Fernández-Montalván, S. J. Hill and R. Leurs, Sci. Rep., 2019, 9, 7906 Search PubMed.
- R. Rubin and R. Baserga, Lab. Invest., 1995, 73, 311–331 Search PubMed.
- J. Wu, W. Li, B. P. Craddock, K. W. Foreman, M. J. Mulvihill, Q. Ji, W. T. Miller and S. R. Hubbard, EMBO J., 2008, 27, 1985–1994 Search PubMed.
- M. Jin, B. A. Petronella, A. Cooke, M. Kadalbajoo, K. W. Siu, A. Kleinberg, E. W. May, P. C. Gokhale, R. Schulz, J. Kahler, M. A. Bittner, K. Foreman, J. A. Pachter, R. Wild, D. Epstein and M. J. Mulvihill, ACS Med. Chem. Lett., 2013, 4, 627–631 Search PubMed.
- D. A. Schuetz, T. Seidel, A. Garon, R. Martini, M. Körbel, G. F. Ecker and T. Langer, J. Chem. Theory Comput., 2018, 14, 4958–4970 Search PubMed.
Footnotes |
| † Electronic supplementary information (ESI) available. See DOI: 10.1039/d0md00178c |
| ‡ D. A. S., L. R. and R. M. contributed equally to this work. They collected the data and performed the analysis. G. E. supervised the studies. All authors contributed to writing the manuscript. |
| This journal is © The Royal Society of Chemistry 2020 |

