
 Open Access Article
 This Open Access Article is licensed under a Creative Commons Attribution-Non Commercial 3.0 Unported Licence
A prototype for catalytic removal of formaldehyde and CO in a compact air cleaner powered by portable electricity†
Yexin
Zhang
 *ab,
Xueyi
Mei
ab,
Jiao
Wang
a,
Chunlin
Chen
ab,
Xingbao
Zhu
ab,
Gongjun
Zhang
a and
Jian
Zhang
*ab
*ab,
Xueyi
Mei
ab,
Jiao
Wang
a,
Chunlin
Chen
ab,
Xingbao
Zhu
ab,
Gongjun
Zhang
a and
Jian
Zhang
*ab
aKey Laboratory of Bio-based Polymeric Materials Technology and Application of Zhejiang Province, Ningbo Institute of Materials Technology & Engineering, Chinese Academy of Sciences, 1219 Zhongguan West Road, Ningbo 315201, People's Republic of China. E-mail: jzhang@nimte.ac.cn; zhangyexin@nimte.ac.cn
bUniversity of the Chinese Academy of Sciences, 19A Yuquan Road, Beijing 100049, People's Republic of China
First published on 17th November 2020
Abstract
We proposed a prototype which can directly be powered by portable electricity for the catalytic removal of formaldehyde and CO. A compact air cleaner equipped with a conductive Ag–SnO2 catalyst and the corresponding reaction system were assembled, featuring a circuit to allow electric current to pass through the catalyst with Joule heating. The removal performances were superior to the thermal heating counterpart and the electricity was found to suppress CO poisoning, which was preliminarily attributed to the electron transport between Ag and SnO2.
1. Introduction
Formaldehyde (HCHO) mainly from indoor sources and CO mainly from mobile sources are two of the most commonly encountered hazardous air pollutants, and the long-term exposure to either of them at the ppm level can lead to adverse health effects in humans. The former can cause irritation of eyes, nose and the respiratory tract, headache, pulmonary diseases, and even cancer1 while the latter can exacerbate heart disease and cause neurological damage.2 The risks of exposure to the pollutants are increasing in modern society, and a personal, compact and portable air cleaner is promising to minimize the risks. In order to realize a cleaner, two important preconditions should be met including a facile abasement technique and an accessible energy source.As one of the mainstream abasement techniques, complete catalytic oxidation can convert HCHO and CO to harmless CO2 and/or H2O, which can even be achieved at room temperature on some noble metal catalysts, such as Pt,3 Pd,4 Rh5 and Au.6 But the high cost and the susceptibility to toxicity of these noble metals limit their widespread practical applications. For most other catalysts, elevated temperatures are required to enhance the oxidation reaction rate. External heating to elevate temperature is energy-intensive and not available for portable devices. Because of the general availability of portable electric power, there is huge interest in the electrification of pollutant abatements, which can be rid of external heating sources. Wang's group have developed a technique of electrothermal regeneration for HCHO removal over MnO2 decorated with carbon cloth7 and a carbon membrane,8 which can provide Joule heat to accelerate the HCHO oxidation. Yu's group9 achieved energy-efficient catalytic removal of HCHO enabled by precisely Joule-heated Ag/Co3O4@mesoporous-carbon monoliths, in which the energy consumption can be drastically reduced by 87%. These works inspire us to utilize portable electricity to eliminate HCHO and CO, and develop a prototype reactor with a conductive catalyst which does not only depend on the Joule heating from the conductive supports.
Here, a prototype of a compact air cleaner powered by portable electricity was designed and assembled to eliminate HCHO and CO, in which a relatively inexpensive and conductive material, Ag-SnO2, was employed as a catalyst. In the prototype, the electric current with low voltage below 5 V, which can be provided by a common portable electric power supply, can pass through the catalyst and thereby trigger the oxidations of HCHO and CO. The performances of eliminating the two pollutants were superior to the thermal heating way. In the studies of CO oxidation as a probe reaction, we found that the electricity could prevent CO poisoning and preliminarily attributed the poisoning to the electron transport between Ag and SnO2.
2. Experimental
2.1 Assembly of a prototype reactor and a reaction system
A reactor, i.e. the prototype of a compact air cleaner, was home-made based on a cross type and opened glass pipe as schown in Fig. 1a. Two copper electrodes with 6 mm diameter disks on their ends were sealed and mounted within the two arm tubes by two silicone pieces of rubber, respectively. The opposite disks of both electrodes were 6 mm apart and were aligned with the inner wall of the vertical tube. The catalyst was accommodated in the room between the two electrodes and was tightly packed using quartz wool within the vertical tube, along which the reaction gas can flow through the catalyst bed. In order to measure the reaction temperature, as shown in the side view in Fig. 1b, a calibrated K-type thermocouple kept in a thermowell was inserted into the catalyst bed, and was fixed through a silicone rubber within a branch tube. A reaction system was assembled via the connections of some devices as shown in Fig. 1c. The electrodes of the reactor were connected to an adjustable direct current (DC) power supply (Korad KA6003P) via two wires forming a circuit while the thermocouple was connected to a temperature indicator (AI-501, Xiamen Yudian, China). The reaction gas, which was controlled in the flow rate using a mass flow meter (D08-3F, Sevenstar, Beijing, China), passed through the reactor and then flowed into an infrared gas analyzer (Talantek TY9000) for the analysis of the CO and CO2 products in the effluent. All the digital signals from the devices were conveyed to a computer with self-programmed software for the reaction system to control the DC power, and to collect the data including the CO and CO2 concentrations, the catalyst temperature, and the input voltage and current. | ||
| Fig. 1 (a and b) Schemes of the designed prototype reactor powered by electricity in front (a) and side (b) views. (c) Diagram of assembling the reaction system via connections of some devices including the prototype reactor (i), DC power (ii), temperature indicator (iii), infrared gas analyzer (iv), and computer (v) with self-programmed software to control the DC power and to collect the reaction data. (d and e) XRD pattern (d) and Ag 3d XPS spectrum (e) of the Ag–SnO2 catalyst. (f) HRTEM image of the Ag–SnO2 catalyst with extracted Ag(111) in red color. (g) SAED pattern of the Ag–SnO2 catalyst. | ||
2.2 Ag–SnO2 catalyst preparation
The Ag–SnO2 catalysts were synthesized in a hydrothermal process.10 Taking the sample with 50 wt% Ag content as an example, ammonia water was dropped into a solution of dissolving 3.15 g of AgNO3 (AR, Kermel, China) in 2 mL of deionized water, forming a silver–ammonia complex. The silver–ammonia solution was added with 3.54 g of Na2SnO3·3H2O (AR, Kermel, China) dissolved in 20 mL deionized water. The silver–ammonia–Na2SnO3 complex was mixed with 4.68 g of oxalate dihydrate (AR, Kermel, China) dissolved in 50 mL deionized water and stirred. The resulting solution was transferred into a high pressure autoclave to react for 4 h at 160 °C. The produced gray powders were washed and filtered, and then dried for 10 h at 100 °C. Note that the Ag content was 50 wt% in the catalyst unless otherwise specified.2.3 Catalyst characterization
The X-ray diffraction (XRD) patterns of the catalysts were recorded on a Bruker D8 Advance diffractometer employing Cu Kα radiation (k = 1.5418 Å) operating at 40 kV and 40 mA. The elemental composition of the catalyst was determined using X-ray fluorescence (XRF, S8 Tiger Bruker). The X-ray photoelectron spectroscopy (XPS) tests were carried out on an AXIS ULTRADLD Multifunctional X-ray Photoelectron Spectroscope with an Al Kα radiation source at room temperature and under a vacuum of 10−7 Pa (10−9 Torr). The starting angle of the photoelectron was set at 90°, and the spectrum was calibrated with a C1s spectrum at 284.6 eV. The high-resolution transmission electron microscopy (HRTEM) images were acquired by using a JEOL JEM-ARM200F microscope operated at 200 kV. The analysis of energy dispersive spectroscopy (EDS) on a scanning electron microscope (SEM) was performed using a Thermo Scientific Verios G4 UC field-emission scanning electron microscope.2.4 Performance tests for the removal of HCHO and CO
The elimination of formaldehyde (HCHO) and CO was conducted over the Ag–SnO2 catalysts in the designed prototype reactor. The pollutants were carried into the reactor in a flow of 10 vol% O2 in N2 (Ningbo All Force Gas, China) at a gas hourly space velocity (GHSV) of 18![[thin space (1/6-em)]](https://www.rsc.org/images/entities/char_2009.gif) 000 h−1. The reaction gas was humidified to 62% relative humidity at 25 °C by bubbling water in an oil bath kept at 33 °C. For the test to eliminate HCHO, around 180 ppm HCHO vapor was obtained by passing the flow of O2/N2 over 0.5 g of paraformaldehyde (AR, Sinopharm, China) in a container immersed in another oil bath kept at 25 °C. For the test to eliminate CO, around 5620 ppm CO was introduced into the flow of O2/N2 by controlling the flow rate of pure CO (Ningbo All Force Gas, China). The DC power supplied electricity to the reactor to trigger the reactions. CO2 and CO products in the effluent were online detected by an infrared gas analyzer and the catalyst temperatures were measured via a thermocouple inserted into the catalyst bed. The HCHO conversion was calculated from a carbon balance, i.e., 1 mole HCHO forms 1 mole CO2.11 The upper limits for the detection of CO2 and CO products are 10,000 ppm. For comparison, the electricity-free oxidations of the pollutants at the same temperatures as those induced by Joule heating were carried out by heating the prototype reactor in a tube oven.
000 h−1. The reaction gas was humidified to 62% relative humidity at 25 °C by bubbling water in an oil bath kept at 33 °C. For the test to eliminate HCHO, around 180 ppm HCHO vapor was obtained by passing the flow of O2/N2 over 0.5 g of paraformaldehyde (AR, Sinopharm, China) in a container immersed in another oil bath kept at 25 °C. For the test to eliminate CO, around 5620 ppm CO was introduced into the flow of O2/N2 by controlling the flow rate of pure CO (Ningbo All Force Gas, China). The DC power supplied electricity to the reactor to trigger the reactions. CO2 and CO products in the effluent were online detected by an infrared gas analyzer and the catalyst temperatures were measured via a thermocouple inserted into the catalyst bed. The HCHO conversion was calculated from a carbon balance, i.e., 1 mole HCHO forms 1 mole CO2.11 The upper limits for the detection of CO2 and CO products are 10,000 ppm. For comparison, the electricity-free oxidations of the pollutants at the same temperatures as those induced by Joule heating were carried out by heating the prototype reactor in a tube oven.
Using a similar reaction system, a steady-state test for HCHO removal lasting for 10 h was carried out with 0.5 A current, in which the reaction gas was replaced by air and the remaining HCHO was determined by a phenol spectrophotometric method.12
2.5 In situ Raman characterization for CO adsorption
In situ Raman spectroscopy was carried out to investigate CO adsorption over the catalysts with a Renishaw inVia-reflex spectrometer equipped with a Teflon cell. A self-supported wafer of the catalysts with a thickness of 2 mm was sealed into the cell, and two copper electrodes were inserted into the cell to contact the two sides of the sample in the thickness direction, serving for the introduction of the electric field. Prior to the test, the pristine spectrum of the sample was recorded. For CO adsorption, the pure CO gas in 20 mL min−1 passed through the cell and the spectrum was recorded. The electric fields with 0.5 and 1 V were applied on the sample in a flow of pure CO when the spectra were recorded for the CO adsorption with electricity.3. Results and discussion
3.1 Characterization of the Ag–SnO2 catalysts
The XRD pattern of the Ag–SnO2 catalyst (Fig. 1d) shows two phases of Ag (JCPDS 04-0783) and SnO2 (JCPDS 41-1445). Two electronic states of surface Ag were distinguished by deconvoluting the Ag 3d spectrum (Fig. 1e), including Ag0 (Ag 3d3/2 at 374.5 eV and Ag 3d3/2 at 368.5 eV) and Ag2+ (Ag 3d3/2 at 374.0 eV and Ag 3d3/2 at 368.0 eV),13 suggesting the presence of surface AgO on the bulk metallic Ag of the catalysts. The HRTEM image of the Ag–SnO2 catalyst (Fig. 1f) shows the lattice fringes of stacked nanoparticles at around 6 nm in size. The Ag(111) fringes with a d-spacing of 0.236 nm were extracted in red with the help of a masking step and an inverse fast Fourier transform.14 The presence of several intermittent Ag(111) fringes and their weak diffraction ring in the selected area electron diffraction (SAED) pattern (Fig. 1g) implies the covering of SnO2 nanoparticles on Ag nanoparticles, which was confirmed by the lower surface Ag/Sn atomic ratio (0.25) estimated by XPS than the bulk ratio (1.37) determined by XRF for the Ag–SnO2 catalyst. The EDS-SEM analysis of the catalyst (Fig. S1, ESI†) shows that both kinds of nanoparticles were homogenously dispersed with each other. The intimate contact between Ag and SnO2 nanoparticles could guarantee the good electrical conductivity of the catalyst.3.2 Performances for the removal of HCHO and CO
The tests for the removal of HCHO and CO in the electricity powered method were carried out in a home-made reactor. In the profiles of HCHO oxidation in Fig. 2a, the constant electric currents were supplied to pass through the catalyst with stepping from 0.2 up to 1 A, corresponding to the increasing catalyst temperature due to Joule heating. Note that the input voltages in the steady state within the range of 4.5–5 V did not significantly change with the increasing electric current, suggesting that the resistance decreased with the increasing temperature. The passing electric current triggered the HCHO oxidation generating CO2, and no obvious CO production was detected showing the deep oxidations. Another fact to be noted is that when the electric current was elevated in each step, a large amount of CO2 was produced in the beginning, which could be attributed to the oxidation of the HCHO pre-adsorbed on the catalyst. With the consumption of the pre-adsorbed HCHO, the produced CO2 declined to steady concentration due to the oxidation of gaseous HCHO. The fed HCHO (180 ppm) was thoroughly oxidized with currents of 0.5 and 1 A and the induced catalyst temperatures below 130 °C. When the electric power was off, the CO2 concentration dropped and the catalyst temperature decreased, indicating that the reaction was stopped. A similar response characteristic to electricity was also observed in the CO oxidation (Fig. 2b), in which the produced CO2 concentration increased with the consumed CO when the input electric current was being stepped up with the voltage range of 1.8–4 V. Almost CO (5620 ppm) was oxidized into CO2 with a passing electric current of 1.5 A, and the reaction was also stopped when the electric power was off. The extent of the elimination of the pollutions could be well controlled by adjusting the input electricity in the prototype reactor. | ||
| Fig. 2 (a and b) Profiles of the HCHO (a) and CO (b) oxidations over the Ag–SnO2 catalyst in the electrical powering way. In each subfigure, the upper part shows the evolution of CO2 and/or CO concentrations and the catalyst temperature along with the reaction time, and the bottom part shows the evolution of input voltage and current along with the reaction time. (c and d) Performance comparisons between the electricity and the thermal heating ways for HCHO (c) and CO (d) conversions. | ||
In the steady-state test for HCHO removal lasting for 10 hours in air with 0.5 A current as shown in Fig. 3a, the HCHO conversion remained above 90% with little loss while the electric resistance of the catalyst did not show much change around 5 Ω. After the steady-state test, the bulk SnO2 and Ag phases still presented as shown in the XRD pattern (Fig. 3b). The deconvolution of the Ag 3d spectrum (Fig. 3c) demonstrated that 90% of surface Ag was in the oxidation state, which was more than that before the reaction (62%). Although the electric state of surface Ag changes after the catalytic oxidation with electricity, the bulk structure of the Ag–SnO2 catalyst and its performance to eliminate the pollutants remained. Therefore, the prototype powered by portable electricity is going to be sustainable to eliminate pollutants in air.
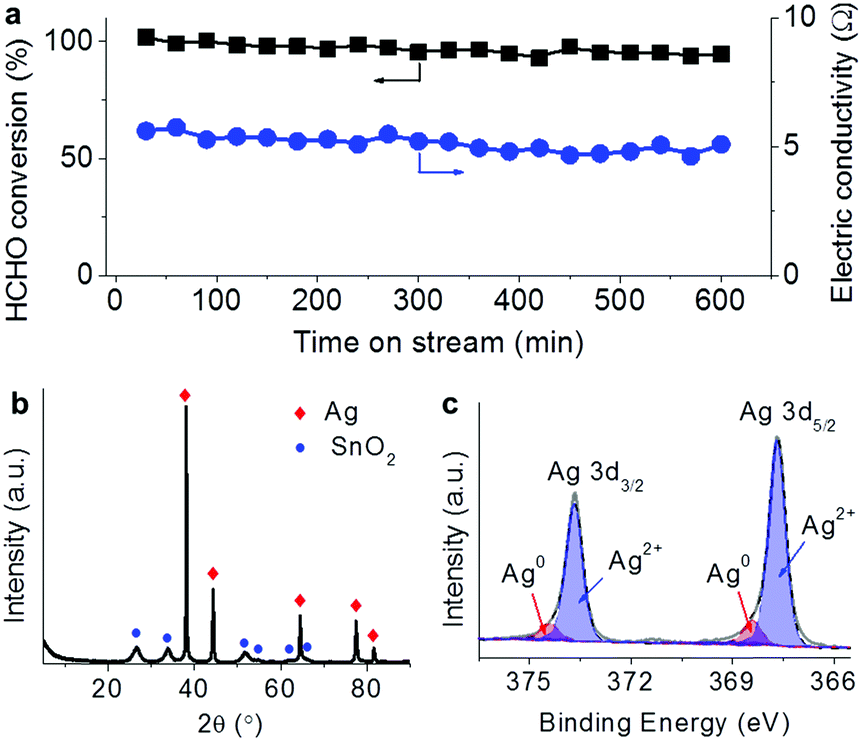 | ||
| Fig. 3 (a) HCHO conversion and electric resistance of the Ag–SnO2 catalyst in the steady-state test for HCHO removal lasting for 10 h with 0.5 A current. (b and c) XRD pattern (b) and Ag 3d XPS spectrum (c) of the Ag–SnO2 catalyst after the steady-state test. | ||
At a steady state with electricity, the Joule heating is balanced by the summation of the temperature change of gas flow, the conductive, convective, and radiative heat losses and the reaction heat.9 A linear relationship between catalyst temperature and input electric power was shared by both HCHO and CO oxidation reactions as revealed by Fig. S2 (ESI†), suggesting that the reaction heat was too small compared to the Joule heat to affect the catalyst temperatures. In order to make clear the contribution of Joule heat to the reactions, the HCHO and CO oxidations were performed by thermal heating as a comparison, in which the prototype reactor with the Ag–SnO2 catalyst was directly heated in a tube oven. For the HCHO oxidation, 57% conversion was achieved at 47 °C in the electrical powering way whereas only 17% conversion was achieved by thermal heating at the same temperature (Fig. 2c). For the CO oxidation, the electrical powering way displayed higher CO conversion (Fig. 2d) and lower apparent activated energy (Ea = 41.7 kJ mol−1) than the thermal heating counterpart (Ea = 67.2 kJ mol−1) (Fig. S3, ESI†). This is similar to the reported findings that the activation energies of lean methane oxidation were lowered by the assisting electric field.15,16 In comparison with the works employing carbon materials as supports,7–9 the electric current passed through the catalyst itself and the action of the electricity on the reactions was beyond the Joule heating from the support in this work. Therefore, the prototype of the air cleaner powered by portable electricity can exhibit higher performance for the removal of the pollutants than the traditional thermal heating way. Although HCHO and CO conversions have been reported to be completed over some catalysts at room temperature,17,18 our work provides a stable way to maintain catalyst activity by electrical powering.
3.3 In situ Raman characterization for CO adsorption
The action of electricity on the oxidation reactions was studied by using CO as a probe molecule. The CO adsorption on the Ag–SnO2 catalyst was conducted using in situ Raman characterization as shown in Fig. 4a. Prior to the CO adsorption, the catalyst exhibited some characteristic bands of SnO2 at 297, 481, 924 and 2453 cm−1, which can be ascribed to Eu and B1u(2) modes of ν(Sn–O), νas(Sn–OH), and 2δ(Sn–OH), respectively.19–21 The observation of Sn–OH bands indicated the presence of hydroxyl on SnO2. After CO was introduced, three obvious bands rose at 641, 1353 and 1568 cm−1 (labeled by the red dashed lines in Fig. 4a), which can be attributed to the characteristic bands of the surface format, i.e. δ(O–C–O), νs(O–C–O), and νas(O–C–O), respectively.12,22,23 The formate originated from the reaction of adsorbed CO species on Ag with adjacent SnO2 hydroxyl on the Ag/SnO2 interface.23,24 When the electrical fields were applied with 0.5 and 1 V, the bands of formate from CO adsorption remained. | ||
| Fig. 4 (a) In situ Raman spectra for CO adsorption over the Ag–SnO2 catalyst, including the pristine spectrum before CO adsorption, and the spectrum after CO adsorption (0 V), and those of CO adsorption with electricity under 0.5 and 1 V. The bands of formate formed from CO adsorption were labeled by red dashed lines. (b) Profiles of transient response reactions of CO oxidations with varied CO feeding over the Ag–SnO2 catalyst in the electrical powering way with 0.3 A current which induced a catalyst temperature of 67 °C, showing the evolution of CO and CO2 concentrations and voltage as well as the simulated CO2 profile in dotted lines along with the reaction time. (c) Profiles of transient response reactions of CO oxidations with varied CO feeding over the Ag–SnO2 catalyst in the thermal heating way with a catalyst temperature of 67 °C, showing the evolution of CO and CO2 concentrations as well as the simulated CO2 profile in dotted lines along with the reaction time. (d) Scheme of the proposed mechanism for CO oxidation over the Ag–SnO2 catalysts. (e and f) Evolution of simulated surface coverage of adsorbed CO (ΘCO) and adsorbed oxygen species (ΘO) in the electrical powering (e) and thermal heating ways (f). | ||
3.4 Transient response reaction for CO oxidation
A transient response reaction for CO oxidation was designed and conducted over the Ag-SnO2 catalyst with 0.3 A current, inducing a catalyst temperature around of 67 °C due to Joule heating. During the reaction, as shown in Fig. 4b, CO was fed into the reaction gas containing 10 vol% O2 with a step increase in concentrations from 1050 to 5620 ppm and was finally stopped. In each step, the reaction reached the equilibrium with relatively steady CO2 production. The CO feeding not only resulted in CO2 production but also increased voltage indicating the increase in catalyst resistance. The degradation of the electric conductivity can be attributed to the formate coverage on the Ag/SnO2 interface from CO adsorption.24 When the CO feeding was off, the voltage was dropped with the increasing electric conductivity due to the consumption of fomate from oxidation. Therefore, the formate should be involved in the CO oxidation as a reaction intermediate.For comparison, as shown in Fig. 4c, the thermal heating counterpart of the transient response reaction over the Ag–SnO2 catalyst was conducted at 67 °C, the same as the catalyst temperature induced by Joule heating in the electrical powering way. The CO2 production in the thermal heating way also increased with the increased CO feeding but was much weaker in intensity than that in the electrical powering way. When the CO feeding was stopped, a peculiar phenomenon was observed only in the thermal heating way that the CO concentration sharply ascended before dropping. At the same time, the CO2 production also increased and then decreased. This phenomenon can be considered as an indicator of the presence of CO poisoning, which was diminished with overwhelming O2 adsorption to release CO and to produce CO2 after the CO feeding was off. The fact that the phenomenon was not present in the electrical powering way demonstrated that the CO poisoning was overcome by electricity, which was further confirmed by the larger reaction orders of CO (nCO) in the electrical powering way. Based on the logarithm plots of reaction rates versus input CO concentrations obtained from the transient response reactions (Fig. S4, ESI†), the nCO values were calculated to be 0.65 and 0.37 in the electrical powering and thermal heating ways, respectively. The larger nCO means the influence of CO adsorption on the overall rate becomes increasingly positive with the weaker effect of CO poisoning.
A simplified Langmuir–Hinshelwood (L–H) mechanism was proposed for the CO oxidation on the Ag–SnO2 catalyst,25 which is composed of five elementary reactions as shown in Fig. 4d, including CO adsorption/desorption with surface formate, and O2 dissociative adsorption/desorption, and the surface reaction between the two adsorbed species generating CO2. The five elemental reaction rates (R) are expressed by five equations listed in Table 1 with the parameters including rate constants (k), and partial pressures of inlet CO and O2 (P), as well as the surface coverage of adsorbed species (Θ). The evolution of ΘCO and ΘO along with the reaction time (t) was expressed by eqn (1) and (2), respectively.
 | (1) |
 | (2) |
| Elemental reaction | Rate equation/min−1 | Simulated rate constant (k) | ||
|---|---|---|---|---|
| Electrical powering way | Thermal heating way | |||
| P CO, PO2: concentrations of inlet CO and O2 in units of μmol m−3, respectively; ΘCO, ΘO: surface coverage of adsorbed CO and O2 species, respectively. | ||||
| CO adsorption | R 1 = k1PCO(1 − ΘCO – ΘO) | k 1/(μmol−1 m3 min−1) | 4.50 × 10⁻⁵ | 4.04 × 10⁻⁵ |
| CO desorption | R –1 = k−1ΘCO | k −1/min−1 | 3.27 | 3.72 |
| O2 adsorption | R 2 = k2PO2(1 – ΘCO – ΘO)2 | k 2/(μmol−1 m3 min−1) | 5.13 × 10⁻⁸ | 1.43 × 10⁻⁸ |
| O2 desorption | R –2 = k–2ΘO | k −2/min−1 | 2.64 | 1.38 |
| Surface reaction | R 3 = k3ΘCOΘO | k 3/min−1 | 6.17 | 3.36 |
Based on the equations, we simulated the transient response reactions with varied CO feeding in the electrical powering and the thermal heating ways (Fig. 4e and f) by Python programming with numerical integration and nonlinear least squares fitting. The simulated CO2 concentrations (the dot plots in Fig. 4b and c) were in qualitative agreement with the experimental results.
The evolution of the simulated coverage of adsorbed species along with the reaction time was also simulated. As shown in Fig. 4e, the profile of the simulated adsorbed CO species (ΘCO) was roughly opposite to that of the experimental voltage in the electrical powering way (Fig. 4b), showing that the electric resistance is an indicator of surface formate coverage. In comparison with the thermal heating counterpart (Fig. 4f), the electrical powering way had a smaller ΘCO and larger ΘO, being coincident with the simulated kinetics parameters as listed in Table 1. By the electricity method, the simulated rate constants of O2 dissociative adsorption (k2) significantly enlarged by 2.6 times and the simulated rate constants of the surface reaction (k3) also increased by 84%. The improvements of both O2 dissociative adsorption and surface reactions were important factors to suppress CO poisoning.
The local microscopic Joule heating at the catalyst particle contacts,26 which may result in higher local microscopic temperatures than the integral macroscopic temperatures measured, might account for the enhanced performance by electricity method. However, this hypothesis goes against an exception of another Ag–SnO2 catalyst with higher Ag content of 70 wt% on which the electrical powering way failed to exhibit the performance superior to the thermal heating counterpart for the oxidations of HCHO (Fig. S5, ESI†) and CO (Fig. S6 and S7, ESI†). Note that the Ag–SnO2 catalyst with 20 wt% Ag content was too weak in electric conductivity to present the activity in the electrical powering way. The difference in the action of electricity on the two Ag–SnO2 catalysts with 50 wt% and 70 wt% Ag contents may be correlated to their diversity in electron transport properties. According to the finding of Wei et al.,27 the Ag volume fraction (0.4) of the former was just within the range of tunneling percolation (0.13–0.55), i.e. tunneling to second-nearest neighboring Ag particles, implying the electron transport between Ag and SnO2 nanoparticles. The lower work function of Ag (4.26 eV) than SnO2 (5.2 eV) facilitates the electron transport from Ag to the SnO2 heterojunction, forming a negatively charged accumulated layer around the Ag/SnO2 interface.28,29 The negatively charged interface is beneficial for O2 activation and further surface reaction according to the study of Kim et al.30 As for the Ag–SnO2 catalyst with 70 wt% Ag content, the higher Ag volume fraction (0.6) favors the transition to classical percolation so that the electron transport occurs between the Ag nanoparticles being geometrically connected. Though the electric conductivity was improved, the SnO2 nanoparticles are passed over by electric current. Because electron transport from Ag to SnO2 cannot occur with 70% of Ag content, the electricity failed to contribute to the enhanced performance to eliminate the pollutants.
4. Conclusions
A prototype of a compact air cleaner was developed, which can be powered by portable electricity to eliminate air pollutants of HCHO and CO. The Ag–SnO2 catalysts with 50 wt% of Ag content were packed into the designed reactor forming a circuit to allow electric current to pass through the catalyst. The complete removal of HCHO and CO was accomplished at voltages below 5 V and was superior to the thermal heating counterpart. The electricity was found to suppress CO poisoning, which may correlate to the electron transport between Ag and SnO2 guaranteed with 50 wt% of Ag content.Conflicts of interest
There are no conflicts to declare.Acknowledgements
The authors thank Prof. Junling Wang from Nanyang Technological University, Singapore, the helpful discussion. Financial support for this work was provided by the National Natural Science Foundation of China (22072170), the Provincial Natural Science Foundation of Zhejiang, China (LY19B030003), the Ningbo Municipal Bureau of Science and Technology, China (2019B10096, 2018B10056 and 2019F1023), the Chinese Academy of Sciences (QYZDB-SSW-JSC037), the Fujian Institute of Innovation, Chinese Academy of Sciences (FJCXY18020202), and the K. C. Wong Education Foundation (rczx0800).Notes and references
- J. Chen, D. Yan, Z. Xu, X. Chen, X. Chen, W. Xu, H. Jia and J. Chen, Environ. Sci. Technol., 2018, 52, 4728–4737 CrossRef CAS.
- C. L. Townsend and R. L. Maynard, Occup. Environ. Med., 2002, 59, 708–711 CrossRef CAS.
- W. Yuan, S. Zhang, Y. Wu, X. Huang, F. Tian, S. Liu and C. Li, Appl. Catal., B, 2020, 272, 118992 CrossRef CAS.
- X. Li, Y. Z. Wang, X. H. Wei and Y. X. Zhao, Mol. Catal., 2020, 491, 111002 CrossRef CAS.
- A. Yusuf, C. Snape, J. He, H. Xu, C. Liu, M. Zhao, G. Z. Chen, B. Tang, C. Wang, J. Wang and S. N. Behera, Catal. Rev., 2017, 59, 189–233 CrossRef CAS.
- Y. F. Cai, Y. Guo and J. Liu, Chem. Commun., 2020, 56, 876–879 RSC.
- N. Zou, Q. Nie, X. Zhang, G. Zhang, J. Wang and P. Zhang, Chem. Eng. J., 2019, 357, 1–10 CrossRef CAS.
- Y. T. Xia, J. L. Wang, C. Q. Gu, Y. Ling and Z. M. Gao, Chem. Eng. J., 2020, 382, 8 CrossRef.
- K. Wang, Y. Zeng, W. Lin, X. Yang, Y. Cao, H. Wang, F. Peng and H. Yu, Carbon, 2020, 167, 709–717 CrossRef CAS.
- T. Z. Yang, Z. J. Du, Y. Y. Gu, X. Y. Qiu, M. X. Jiang and G. Chu, Trans. Nonferrous Met. Soc. China, 2007, 17, 434–438 CrossRef CAS.
- Y. X. Chen, J. Y. Gao, Z. W. Huang, M. J. Zhou, J. X. Chen, C. Li, Z. Ma, J. M. Chen and X. F. Tang, Environ. Sci. Technol., 2017, 51, 7084–7090 CrossRef CAS.
- K. Ito and H. J. Bernstein, Can. J. Chem., 1956, 34, 170–178 CrossRef CAS.
- D. Vidyasagar, S. G. Ghugal, A. Kulkarni, P. Mishra, A. G. Shende, Jagannath, S. S. Umare and R. Sasikala, Appl. Catal., B, 2018, 221, 339–348 CrossRef CAS.
- Z.-H. Huang, F. Kang, W. L. Huang, J.-B. Yang, K.-M. Liang, M.-L. Cui and Z. Cheng, J. Colloid Interface Sci., 2002, 249, 453–457 CrossRef CAS.
- K. Li, D. Xu, K. Liu, H. Ni, F. Shen, T. Chen, B. Guan, R. Zhan, Z. Huang and H. Lin, J. Phys. Chem. C, 2019, 123, 10377–10388 CrossRef CAS.
- K. Li, K. Liu, D. Xu, H. Ni, F. Shen, T. Chen, B. Guan, R. Zhan, Z. Huang and H. Lin, Chem. Eng. J., 2019, 369, 660–671 CrossRef CAS.
- J. H. Guo, C. X. Lin, C. J. Jiang and P. Y. Zhang, Appl. Surf. Sci., 2019, 475, 237–255 CrossRef CAS.
- D. A. Svintsitskiy, T. Y. Kardash, E. A. Fedorova, E. M. Slavinskaya and A. I. Boronin, Appl. Surf. Sci., 2020, 525, 146523 CrossRef CAS.
- M. N. Rumyantseva, A. M. Gaskov, N. Rosman, T. Pagnier and J. R. Morante, Chem. Mater., 2005, 17, 893–901 CrossRef CAS.
- L. Z. Liu, T. H. Li, X. L. Wu, J. C. Shen and P. K. Chu, J. Raman Spectrosc., 2012, 43, 1423–1426 CrossRef CAS.
- D. Amalric-Popescu and F. Bozon-Verduraz, Catal. Today, 2001, 70, 139–154 CrossRef CAS.
- Y. Ichinohe, T. Wadayama and A. Hatta, J. Raman Spectrosc., 1995, 26, 335–340 CrossRef CAS.
- M.-Y. He and J. G. Ekerdt, J. Catal., 1984, 87, 381–388 CrossRef CAS.
- O. Wurzinger and G. Reinhardt, Sens. Actuators, B, 2004, 103, 104–110 CrossRef CAS.
- T. Engel and G. Ertl, in Advances in Catalysis, ed. D. D. Eley, H. Pines and P. B. Weez, Academic Press, 1979, vol. 28, pp. 1–78 Search PubMed.
- O. Yanagisawa, H. Kuramoto, K. Matsugi and M. Komatsu, Mater. Sci. Eng., A, 2003, 350, 184–189 CrossRef.
- Y. F. Wei and Z. Q. Li, Appl. Phys. Lett., 2013, 102, 131911 CrossRef.
- N. Bhardwaj and S. Mohapatra, Ceram. Int., 2016, 42, 17237–17242 CrossRef CAS.
- M.-H. Hwang, H. Kong, J.-W. Jeong and H.-Y. Lee, Superlattice Microstruct., 2020, 141, 106503 CrossRef CAS.
- D. H. Kim, K. Shin and H. M. Lee, J. Phys. Chem. C, 2011, 115, 24771–24777 CrossRef CAS.
Footnote |
| † Electronic supplementary information (ESI) available. See DOI: 10.1039/d0ma00765j |
| This journal is © The Royal Society of Chemistry 2020 |