
 Open Access Article
 This Open Access Article is licensed under a
 Creative Commons Attribution 3.0 Unported Licence
DES-N-doped oxygenated carbon dot colloidal solutions for light harvesting and bio-imaging applications†
Krishnaiah
Damarla
 ab,
Sanjay
Mehra
ab,
Tejwant Singh
Kang
c,
Sonam
Yadav
ab,
Avinash
Mishra
ab and
Arvind
Kumar
*ab
ab,
Sanjay
Mehra
ab,
Tejwant Singh
Kang
c,
Sonam
Yadav
ab,
Avinash
Mishra
ab and
Arvind
Kumar
*ab
aCSIR-Central Salt and Marine Chemicals Research Institute, G. B. Marg, Bhavnagar-364002, Gujarat, India. E-mail: arvind@csmcri.res.in; mailme_arvind@yahoo.com; Fax: +0278-2567562/2566970; Tel: +0278-2567760, extn. 7460
bAcademy of Scientific and Innovative Research (AcSIR), Ghaziabad 201002, India
cDepartment of Chemistry, UGC-centre for Advance Studies – II, Guru Nanak Dev University, Amritsar, 143005, India
First published on 12th November 2020
Abstract
A novel colloidal system comprising choline oleate in deep eutectic solvent (DES: choline chloride–ethylene glycol) is developed and utilized for in situ generation and stabilization of nanosized (1 to 3 nm) N-doped oxygenated, crystalline CDs via dissolution of gelatin. Self-assembly of choline oleate in DES has been characterized using surface tension, DLS and 2D NMR NOESY methods. The stability of colloidal CDs was examined using FTIR and Raman spectroscopy. TEM, HR-TEM, and PXRD techniques have been used to characterize CDs. Optical properties have been investigated using UV, fluorescence and time-resolved photoluminescence (TrPL) spectroscopy. Colloidal CDs possess bright blue to red luminescence and short fluorescence lifetime with exceptionally high quantum yield (ca. 82%), and exhibited excellent biocompatibility as bioimaging agents towards labeling of bacterial cells (both Gram positive and Gram negative), thus indicating a potential benign system for disease detection, drug delivery and light harvesting applications.
Deep eutectic solvents (DESs) are transparent liquids composed of two or three components, which when mixed in an appropriate ratio form a eutectic with a melting point much lower than that of the individual components, and such behavior has been ascribed to the generation of intermolecular hydrogen bonds (H-bonds).1–3 A large number of HBAs have been exploited in combination with HBDs to have DESs with desired properties; however, the most commonly used HBA is choline chloride.4 Easy preparation of DESs with high purity, low cost, stability towards water, easy biodegradability, and pharmaceutically acceptable toxicity4–11 has made them versatile solvents for several applications, be it catalysis, extraction, biomass dissolution and processing, enhanced oil recovery, enzyme activity, extraction processes or drug delivery and materials synthesis.12–16
Apart from several advantages,4–11 DESs have some common properties with ionic liquids, such as a high thermal and chemical stability, and support self-assembly of amphiphilic molecules; therefore, the investigation of colloidal systems involving DESs has recently experienced a major upsurge.17–23 In a further development, an IL in DES colloidal formulation was constructed by Tan et al. wherein aggregation of 1-alkyl-3-methylimidazolium chloride with different alkyl chain lengths in a deep eutectic solvent (DES, composed of choline chloride and glycerol) was achieved for the first time.24 Herein, we have constructed an even greener colloidal formulation comprising a bio-based IL in DES, and demonstrated its practical utility for in situ generation and stabilization of photoluminescent CDs and their application as bio-labelling and bio-imaging agents.
Compared to luminescent semiconductor quantum dots, which have known toxicity,25 photoluminescent carbon dots have attracted growing interest in biological labeling, bioimaging, drug delivery and optoelectronic device applications due to biocompatibility and low toxicity.26–39 In recent years, exciting work has been done on the synthesis of these benign materials through various routes, and references to these are nicely compiled in a recent article by Baragau et al.26 Many of these routes have severe limitations in terms of tedious synthesis process, harsh reaction conditions, requirement of surface passivation reagents, expensive starting materials and low quantum yields, and developing an efficient method still remains a challange.40–42 In this regard, continuous efforts are being made by several researchers to tune the intrinsic properties of CDs via chemical doping with heteroatoms in order to improve the quantum efficiency.40–46
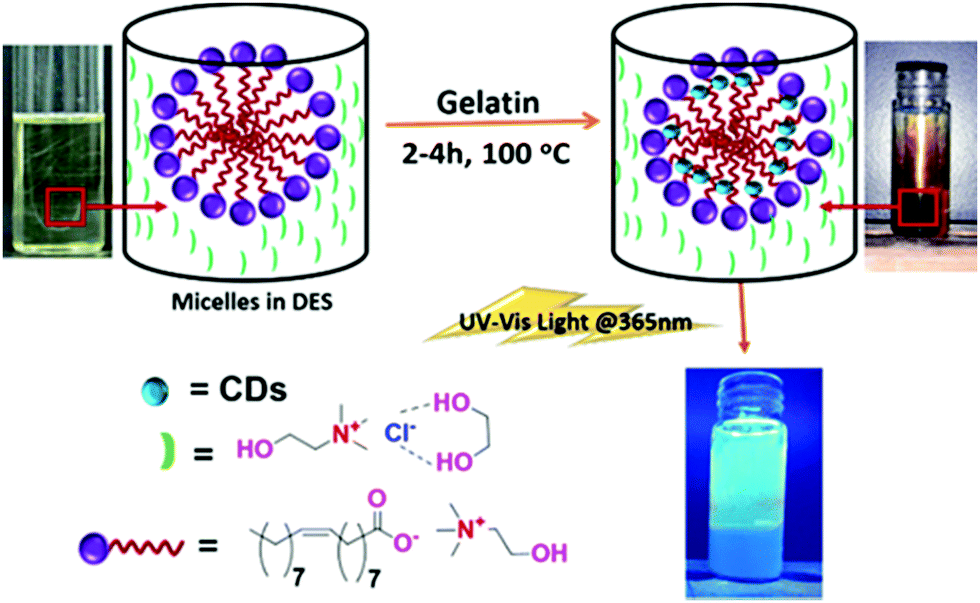
DESs have the ability to donate and accept protons and electrons, which confers DESs the ability to interact with biomass components via establishing a H-bonding network for enhanced dissolution. In fact, DESs have been reported as good solvents and extraction agents for the extraction/dissolution of biomass/biopolymers,47,48 as well as self-assembly media for amphiphilic molecules.17–23 The ability of DESs to dissolve biomass and support self-assembly media prompted us to create a colloidal system for establishing a new and sustainable methodology for preparation of carbon dots (CDs). Herein we have developed a new simple and greener route to prepare N-doped CDs–choline oleate ([Cho][Ola]) in a choline chloride–ethylene glycol hybrid system by direct dissolution of “gelatin” a model protein as a single precursor (a rich source of carbon and nitrogen) in a colloidal solution.
Initially, we synthesized choline oleate ([Cho][Ola]) by mixing equimolar amounts of choline bicarbonate and oleic acid in toluene with continuous stirring at 100 °C for 24 h under reflux conditions. The purity of [Cho][Ola] was ensured from 1H NMR and LC-MS techniques (Fig. S1, ESI†). Colloidal solutions were then prepared by addition of [Cho][Ola] in choline chloride–ethylene glycol (1![[thin space (1/6-em)]](https://www.rsc.org/images/entities/char_2009.gif) :2 mole ratio). The molecular structure of the components used in the construction of colloidal solutions is shown in Fig. 1.
:2 mole ratio). The molecular structure of the components used in the construction of colloidal solutions is shown in Fig. 1.
 | ||
| Fig. 1 Molecular structure of surface active ionic liquid (SAIL, [Cho][Ola]) and deep eutectic solvent (DES, choline chloride–ethylene glycol). | ||
Aggregation behavior of [Cho][Ola] in DES (chloride–ethylene glycol) was characterized using surface tension, DLS and 2D NOESY measurements (Fig. 2a–d).
 | ||
| Fig. 2 (a) Surface tension, (b) DLS plot of [Cho][Ola] and (c and d) 2D NMR NOESY spectra in choline chloride–ethylene glycol (1:2 mole ratio) deep eutectic solvent (DES). | ||
The [Cho][Ola]–DES system exhibited a minimum in the surface tension profiles (Fig. 2a), marking the saturation of the air–solution interface, and onset of aggregation of [Cho][Ola] in bulk (critical aggregation number, ca.). This phenomenal aggregation in DES is as good as an aqueous system (Fig. S2, ESI†). Colloidal solutions were then prepared by addition of [Cho][Ola] in (c) and is likely due to cholinium ions which create the common ion as well as solvophobic effect wherein the oleate alkyl chain group spontaneously comes closer (induce aggregation). Structural organization in aggregates was envisaged from 2D NMR NOESY correlation spectra (Fig. 2c and d). The NOEs originate due to interactions between protons. NOE cross peaks (3.8 ppm and 4.7 ppm) correspond to interaction between surfactant choline cation (C2) with 3.44 ppm choline cation of DES indicating the dispersion of [Cho][Ola] in DES (full spectra in ESI,† Fig. S3). Inference also indicates that the aggregation behavior arises from the hydrophobic effect of SAIL alkyl chains.
Dynamic light scattering measurements performed on solutions of [Cho][Ola] in DES established the presence of aggregates, and the average hydrodynamic radius (Rh) was found to be 42 ± 20 nm. The large size of aggregates in DES is in accordance with the earlier observations of aggregation of amphiphilic molecules in ionic liquid medium.49 The large aggregate size is due to clustering of smaller micellar structures which are loosely arranged in DES medium. In ionic medium such as DES, ions exist as positively or negatively charged ion clusters, instead of separate single ions, and makes an electrical double layer surrounding the micellar surface thereby keeping them apart through electrostatic interactions.50
[Cho][Ola]–DES colloidal solution was used to generate N-doped, carbon-rich, CDs by direct dissolution of gelatin (1 wt%) for 2–4 h at 100 °C (Fig. 3). Here, [Cho][Ola] micelles acted as the template for the synthesis of CDs. Turning of the reaction mixture from pale yellow to brown colour indicated the formation of CDs. For further confirmation of CDs in DES based micelles, we examined the DES–CDs pure solid and colloidal solutions under FT-IR (Fig. 4a and Fig. S4a, ESI†) and Raman Spectroscopy (Fig. 4b and Fig. S4b, ESI†) From the FT-IR spectra, the broad and intense peak centred at 3351 cm−1 is assigned to the –OH bending. The stretching frequencies at 2932 cm−1 and 2340 cm−1 are attributed to –C–H and –C![[triple bond, length as m-dash]](https://www.rsc.org/images/entities/char_e002.gif) N group peaks, respectively. The bands in the range of 1653 cm−1, 1562 cm−1, and 1457 cm−1 are –C
N group peaks, respectively. The bands in the range of 1653 cm−1, 1562 cm−1, and 1457 cm−1 are –C![[double bond, length as m-dash]](https://www.rsc.org/images/entities/char_e001.gif) O, –NH, and –CC stretching frequencies, respectively. The peak at 1086 cm−1 represents –O–H bending vibrations. This implies the existence of a large number of residual hydroxyl groups at the pure CDs and at the interface of the DES–CDs composite material. The appearance of two bands in the Raman spectra in both pure CDs and micellar stabilized CDs (Fig. 4b and Fig. S4b, ESI†) i.e. at 1352 cm−1 (D band, due to breathing modes of sp2 atoms only in the rings) and 1602 cm−1 (G band, due to bond stretching of all pairs of sp2 atoms in both rings and chains) also indicates stacked nanocrystalline graphene/graphene oxide domains in the colloidal system. From these FT-IR and FT-Raman results we strongly confirm that the CDs are formed and stable in micellar form, exhibiting their fundamental properties.
O, –NH, and –CC stretching frequencies, respectively. The peak at 1086 cm−1 represents –O–H bending vibrations. This implies the existence of a large number of residual hydroxyl groups at the pure CDs and at the interface of the DES–CDs composite material. The appearance of two bands in the Raman spectra in both pure CDs and micellar stabilized CDs (Fig. 4b and Fig. S4b, ESI†) i.e. at 1352 cm−1 (D band, due to breathing modes of sp2 atoms only in the rings) and 1602 cm−1 (G band, due to bond stretching of all pairs of sp2 atoms in both rings and chains) also indicates stacked nanocrystalline graphene/graphene oxide domains in the colloidal system. From these FT-IR and FT-Raman results we strongly confirm that the CDs are formed and stable in micellar form, exhibiting their fundamental properties.
 | ||
| Fig. 3 Schematic representation for the preparation of colloidal luminescent CDs in [Cho][Ola]–DES micellar systems. | ||
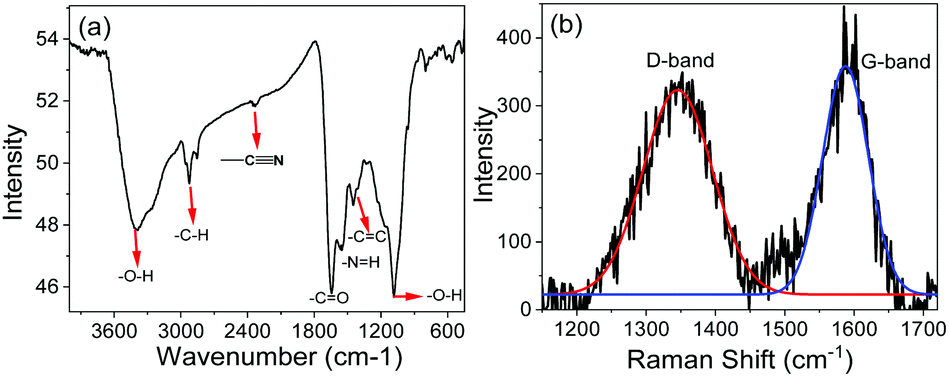 | ||
| Fig. 4 (a) FT-IR spectra and (b) Raman spectra of pure N-doped CDs. | ||
The high stability of CDs in colloidal solution is likely due to strong electrostatic interactions of the carboxylate group of [Cho][Ola] with CDs at the micellar interface. Since, the hybrid system, i.e., CDs-in-micelles formed a very stable colloidal system, we devised a separation method wherein CDs could be extracted with ease. For that we added toluene in excess to the hybrid system. CDs migrated into the toluene slowly after vigorous shaking due to their hydrophobic nature. The extracted CDs were then characterized through HR-TEM and PXRD which confirmed the formation of highly crystalline ultra-small (1 to 3 nm) CDs (Fig. 5a). From the HR-TEM (Fig. 5b and c), the d-spacing value, 0.216 nm corresponds to the (002) phase, which indicates the graphite lattice of the carbon dots.42 Formation of graphitic crystallinity inside the CD structure has been observed. Generation of sp2 bonded C–C domains, organized into a 2D honeycomb lattice inside the carbon core, was revealed by the TEM broad and multiple d-spacing values. The lattice phase of the CDs was also confirmed by XRD diffraction (2θ) at 22.69° which corresponds to the (002) phase of the graphite lattice (Fig. 5d). N doped CDs when dispersed in toluene showed intense blue light emission under UV-Visible light (365 nm) indicating passivation of the surface with oleate ions (Fig. S5, ESI†). The presence of interaction of [Cho][Ola] carboxyl groups with CDs in DES offers various surface modifications for potential applications in sustainable energy conversion materials and for bioimaging purposes. Therefore, N doped CDs–[Cho][Ola]–DES colloidal solutions were further examined for their optical properties.
 | ||
| Fig. 5 Plots show (a) TEM, (b) HR-TEM, (c) d-spacing values obtained from HR-TEM and (d) PXRD of pure CDs. | ||
UV-Vis spectroscopy and emission spectra strongly corroborated the formation of CDs.42,45 The broad absorbance band (300 to 415 nm) and slight broad adsorption peak from ∼400 to 580 nm originate from both n–π* and π–π* charge-transfer transitions and indicated the N-doped oxygen-functionalized graphitic CDs (Fig. 6a).
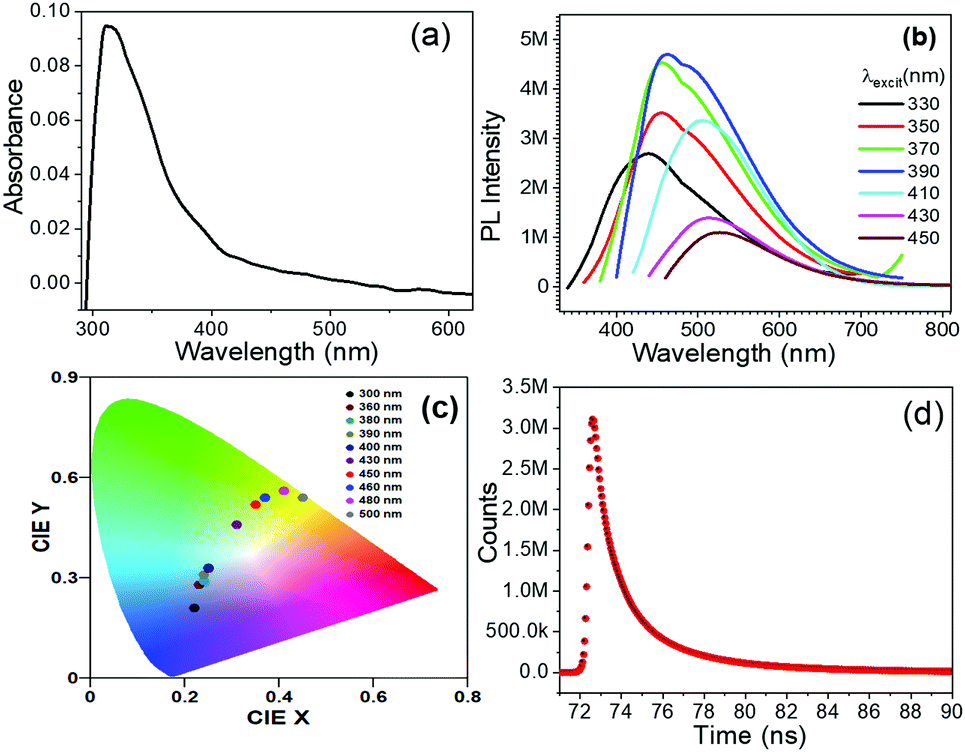 | ||
| Fig. 6 (a) UV-Vis spectra, (b) fluorescence spectra, (c) chromaticity diagram indicating bluish emission, and (d) time resolved photo luminescence spectra of N doped CDs–[Cho][Ola]–DES colloidal solution. | ||
Using the maximum absorbance (λex) value, we recorded the emission spectra at different excitation values such as spectra at 300, 360, 380, 390, 400, 430, 450, 460, 480 and 500 nm and which showed emission of the light (bluish to red) at 416, 456, 458, 462, 471, 514, 527, 544 and 556 nm (Fig. 6b and Fig. S6, ESI†) indicating formation and stabilization of CDs in DES-based micelles wherein different emissions originated from different luminescence centres.51 Blue emission normally originates from the surface defects and the green emission arises from molecular states with distinct energy levels. The CIE colour coordinates [(0.22, 0.21), (0.23, 0.28), (0.24, 0.29), (0.24, 0.31), (0.25, 33), (0.31, 0.46), (0.35, 0.52), (0.37, 0.54), (0.41, 0.56) and (0.45, 0.54)] calculated from the different emission spectra indicated the blue to red emission from the CDs–DES hybrid colloidal system at different excitation values (Fig. 6c).
Time-resolved photoluminescence (TrPL) was employed to understand the excited-state lifetime of colloidal CDs emitting blue light by monitoring the decay profiles at 456 nm (Fig. 6d, IRF spectra provided as Fig. S7, ESI†). The emission of blue light under ultra violet rays is likely due to surface-state emission, and attributed to the presence of surface energy traps that become emissive upon stabilization as a result of the surface passivation in micelles.52 The decay dynamics of the ensembles of colloidal CDs usually exhibit multiexponential dynamics and the kinetics follows the equation, 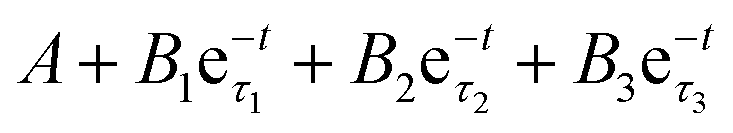 . This is a tri-exponential decay function, where τ1, τ2 and τ3 represent the shorter lifetime and longer lifetime, respectively, and B1, B2 and B3 are the amplitude of the components at t = 0. The shorter lifetime is the intrinsic recombination and the longer time is due to radiative recombination of electrons and holes. The fitting data of the micelles–CDs hybrid system show τ1, τ2 and τ3 equal to 3.07, 7. 34 and 18.02 ns respectively. Therefore, the major surface-related emission is due to the radiative recombination of charge carriers involving surface states.
Quantum efficiency (QE) of the surface-state emission of the micelles–CD hybrid system was determined by a relative method with the area under its curve with the area under the band-edge peak emission (ESI†). The obtained QE is remarkably very high ca. 82% and is much larger than previously reported for light emitting CDs or doped CDs (Fig. 7 and Table S1, ESI†).
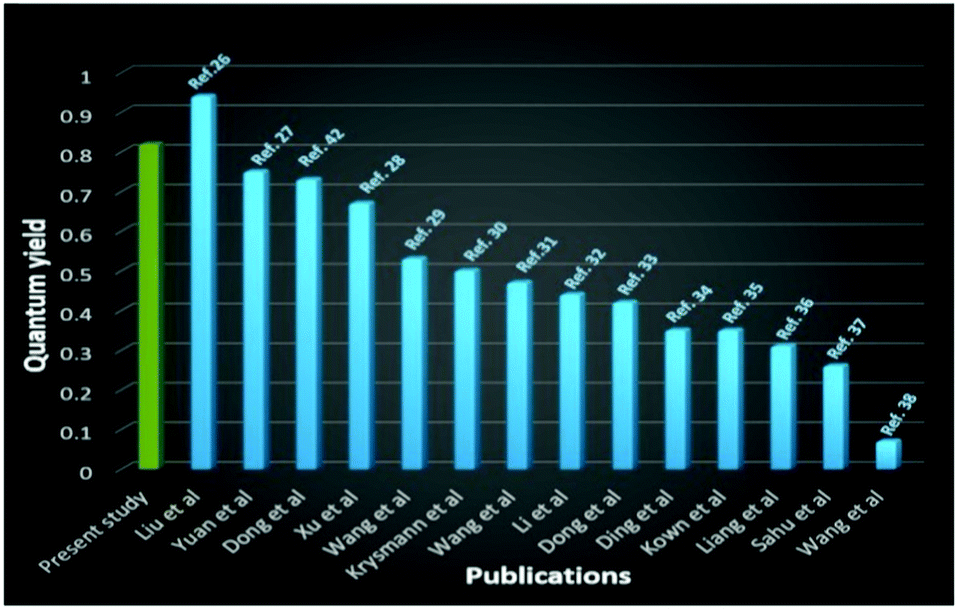 | ||
| Fig. 7 Comparison of quantum yield of CDs synthesized by different research groups with the present work (ref. = reference). | ||
Very high QE is likely due to passivation of quenching defects on the surface and suppression of non-radiative surface trap sites existing on the surface of the CDs by the oleate ions in a manner similar to that accounted for by a dramatic increase in fluorescence QE of CdSe nanocrystals (8% to 45%).53 Confinement of CDs with a large number of DES ions in micelles which creates the polarization effects at the interface between CDs and surrounding ions is also contributing towards increase of QE. The previous reports on antimicrobial activity of DES (choline chloride–ethylene glycol) and SAIL, [Cho][Ola] checked against Gram positive and Gram negative bacteria and the EC50 values come under practically harmless.54,55 CDs synthesized from biomass show nontoxic effects against bacteria and fungi in antimicrobial studies.56 In this study four different bacteria, Escherichia coli, Vibrio owensii, Bacillus cereus, and Vibrio alginolyticus of OD600 0.6 were grown in Luria broth supplemented with colloidal–CDs (4:1) for 16 h at 30 °C with 180 rpm. Bacterial cells were pelleted by centrifugation (5000 rpm for 4 min at 4 °C), washed with phosphate-buffered saline (PBS; 5000 rpm, 4 min) and suspended in PBS. Bacterial cells were observed under an epifluorescence microscope at a wavelength λmax 575 nm and normal light. Commonly, colloidal CDs interact with bacteria through electrostatic interaction,57 and some colloidal CDs may lead to ROS generation in bacterial cells, whereas other cannot.58 ROS inhibition activity was studied with all four bacterial strains treated with different dilutions of DES-N-CDs containing colloidal solution. No or negligible ROS inhibitory activity was observed up to ¼ dilution, whereas about 50–60% ROS inhibition was estimated with higher concentration of colloidal CDs. Therefore, it may be concluded that low concentration of CDs does not generate ROS in bacterial cells, while higher dose leads to ROS generation. A very good fluorescence indicated that the CDs were easily internalized in bacterial cells (Fig. 8 and Fig. S8–S11, ESI†). The results also confirmed that due to the greener nature of all the components, the colloidal solutions of N-doped CDs–choline oleate ([Cho][Ola]) in choline chloride–ethylene glycol can be directly applied in growth media up to very high concentrations, and CDs have the capability to be retained by bacterial cells.
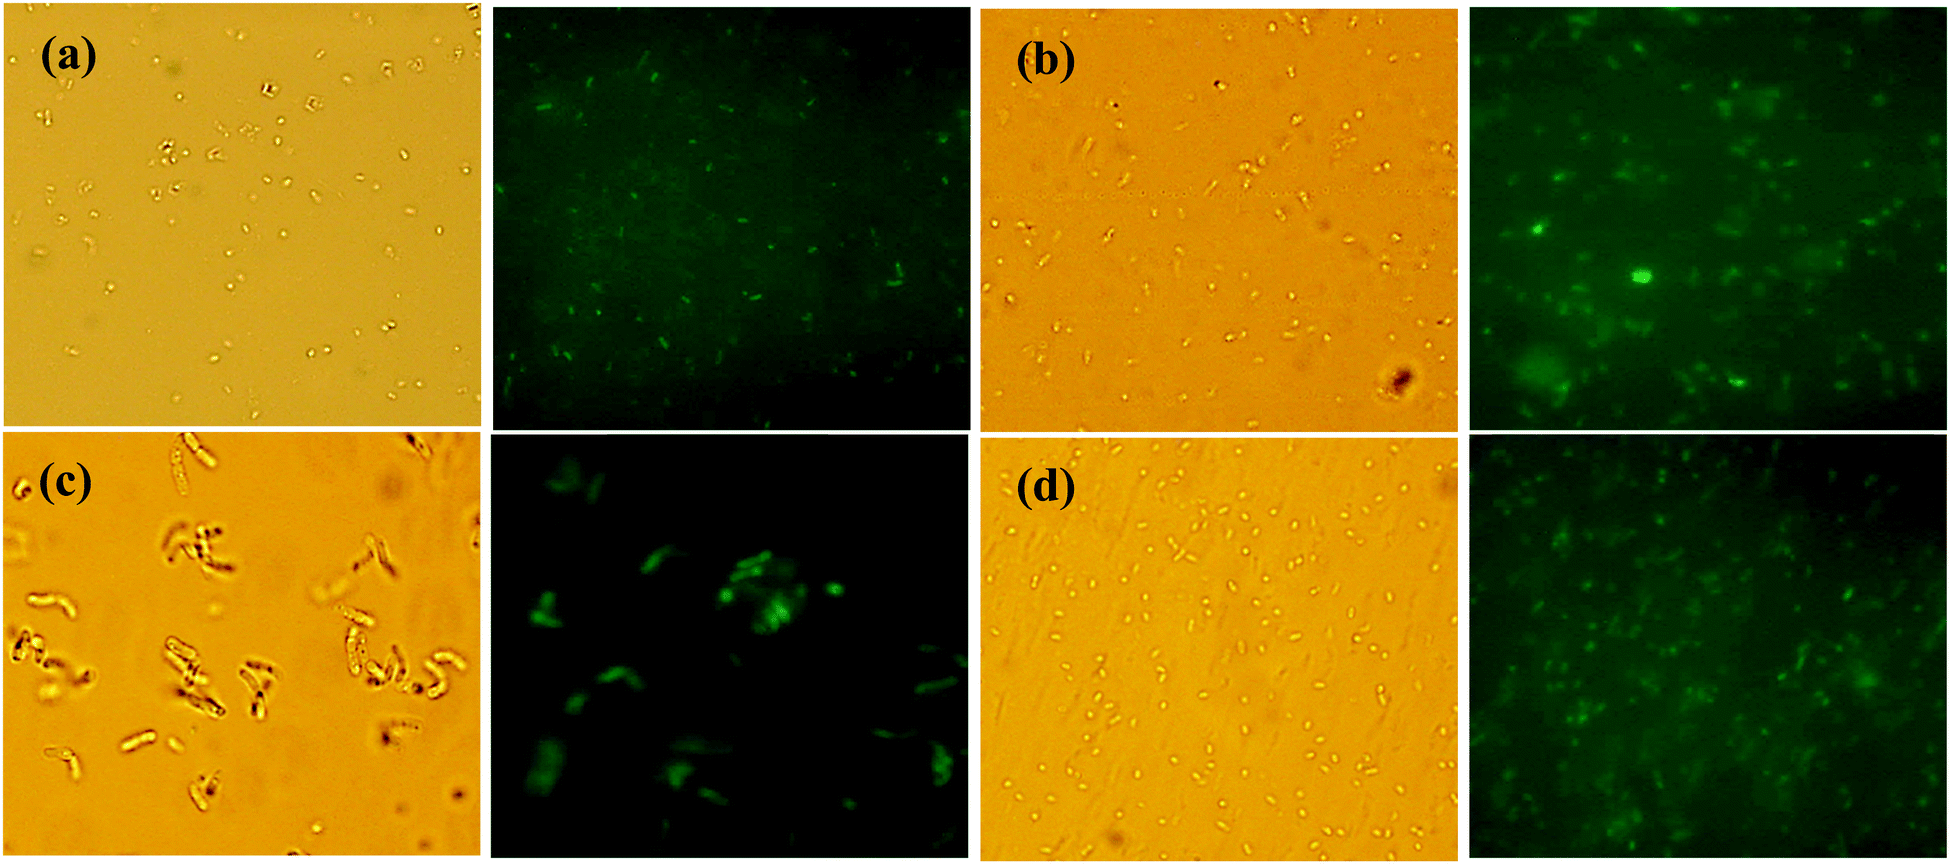 | ||
| Fig. 8 Fluorescence microscopic images of different types of bacteria under normal light and through a green filter: (a) Escherichia coli, (b) Vibrio owensii, (c) Bacillus cereus, and (d) Vibrio alginolyticus of OD600 0.6, labelled with the N-doped carbon dots. | ||
In conclusion, the ability of deep eutectic solvents to dissolve biopolymers and to support self-assembly of amphiphilic molecules has been exploited to develop a novel green colloidal formulation (choline oleate ([Cho][Ola]) in choline chloride–ethylene glycol system) wherein N-doped carbon dots have been generated and stabilized in micelles by direct dissolution of biopolymer gelatin. The colloidal CDs exhibited varying light emission (bluish to red) depending upon the excitation wavelength with a very high quantum yield (ca. 82%). The CDs also showed a very good biocompatibility with different bacteria for cell labelling. Such a system holds promise as a potential material for light harvesting and bioimaging applications suitable for single molecule resolution due to very small size (1 to 3 nm) of CDs. In future, there is a brighter prospect for developing more such tailor-made colloidal CDs as an inexpensive, stable, and biocompatible marker with tuneable light emission and quantum efficiency by choice of bio-friendly ionic liquids or deep eutectic solvents, amphiphilic molecules and biopolymers.
Materials and methods
Materials
Oleic acid (>99%) was obtained from TCI India, choline chloride (≥99%), and choline bicarbonate (≥80%) and gelatin (>98%) type A (300 Bloom, IEP = 9.0) were purchased from Sigma-Aldrich. Ethylene glycol, hexane, ethyl acetate and toluene were purchased from SRL India and SD fine chemicals Ltd., India, respectively. Milli-Q water was used wherever required. All the chemicals were of AR grade and were used as received.Methods
:1) for 16 h at 30 °C with 180 rpm. The next day, bacterial cells were pelleted by centrifugation (5000 rpm for 4 min at 4 °C), washed in with phosphate-buffered saline (PBS; 5000 rpm, 4 min) and suspended in PBS. Bacterial cells were observed under an epifluorescence microscope (Axio Imager, Carl Zeiss AG, Germany) and documented.
Funding sources
Department of science and technology (DST), India and Council of Scientific and Industrial Research (CSIR), India.Conflicts of interest
The authors declare no competing financial interests.Acknowledgements
CSIR-CSMCRI – 095/2019. Department of Science and Technology (DST), Government of India (No. EMR/2016/004747). K. D. is thankful to CSIR for providing financial help as SRF. Analytical and environment division & central instrumentation facility of CSIR-CSMCRI is also acknowledged for helping in the sample characterizations.References
- P. Wasserscheid and W. Keim, Angew. Chem., Int. Ed., 2000, 39, 3772–3789 CrossRef CAS.
- A. P. Abbott, D. Boothby, G. Capper, D. L. Davies and R. K. Rasheed, J. Am. Chem. Soc., 2004, 126, 9142–9147 CrossRef CAS.
- A. P. Abbott, G. Capper, D. L. Davies, H. L. Munro, R. K. Rasheed and V. Tambyrajah, Chem. Commun., 2001, 2010–2011 RSC.
- A. P. Abbott, G. Capper, D. L. Davies and R. Rasheed, Inorg. Chem., 2004, 43, 3447–3452 CrossRef CAS.
- Y. Dai, G.-J. Witkamp, R. Verpoorte and Y. H. Choi, Anal. Chem., 2013, 85, 6272–6278 CrossRef CAS.
- W. Bi, M. Tian and K. H. Row, J. Chromatogr. A, 2013, 1285, 22–30 CrossRef CAS.
- Q. Zhang, K. D. O. Vigier, S. Royer and F. Jerome, Chem. Soc. Rev., 2012, 41, 7108–7146 RSC.
- Y. Yu, X. Lu, Q. Zhou, K. Dong, H. Yao and S. Zhang, Chem. – Eur. J., 2008, 14, 11174–11182 CrossRef CAS.
- K. D. Weaver, H. J. Kim, J. Sun, D. R. MacFarlane and G. D. Elliott, Green Chem., 2010, 12, 507–513 RSC.
- F. Ilgen, D. Ott, D. Kralisch, C. Reil, A. Palmberger and B. König, Green Chem., 2009, 11, 1948–1954 RSC.
- D. Reinhardt, F. Ilgen, D. Kralisch, B. König and G. Kreisel, Green Chem., 2008, 10, 1170–1181 RSC.
- M. Zdanowicz and T. Spychaj, Polimery, 2011, 56, 861–864 CrossRef CAS.
- A. Mohsenzadeh, Y. Al-Wahaibi, A. Jibril, R. Al-Hajri and S. Shuwa, J. Pet. Sci. Eng., 2015, 130, 6–15 CrossRef CAS.
- E. Durand, J. Lecomte and P. Villeneuve, Eur. J. Lipid Sci. Technol., 2013, 115, 379–385 CrossRef CAS.
- Y. Dai, G.-J. Witkamp, R. Verpoorte and Y. H. Choi, Food Chem., 2015, 187, 14–19 CrossRef CAS.
- S. Tuntarawongsa and T. Phaechamud, Polymeric Eutectic Drug Delivery System, J. Met., Mater. Miner., 2012, 22, 27–32 CAS.
- T. L. Greaves and C. J. Drummond, Chem. Soc. Rev., 2008, 37, 1709–1726 RSC.
- O. Zech and W. Kunz, Soft Matter, 2011, 7, 5507–5513 RSC.
- A. Sanchez-Fernandez, K. J. Edler, T. Arnold, R. K. Heenan, L. Porcar, N. J. Terrill, A. E. Terry and A. J. Jackson, Phys. Chem. Chem. Phys., 2016, 18, 14063–14073 RSC.
- A. Sanchez-Fernandez, O. S. Hammond, A. J. Jackson, T. Arnold, J. Doutch and K. J. Edler, Langmuir, 2017, 33, 14304–14314 CrossRef CAS.
- A. Sanchez-Fernandez, G. L. Moody, L. C. Murfin, T. Arnold, A. J. Jackson, S. M. King, S. E. Lewis and K. J. Edler, Soft Matter, 2018, 14, 5525–5536 RSC.
- M. Pal, R. Rai, A. Yadav, R. Khanna, G. A. Baker and S. Pandey, Langmuir, 2014, 30, 13191–13198 CrossRef CAS.
- Komal, G. Singh, G. Singh and T. S. Kang, ACS Omega, 2018, 3, 13387–13398 CrossRef CAS.
- X. Tan, J. Zhang, T. Luo, X. Sang, C. Liu, B. Zhang, L. Peng, W. Li and B. Han, Soft Matter, 2016, 12, 5297–5303 RSC.
- A. P. Alivisatos, Science, 1996, 271, 933–937 CrossRef CAS.
- I.-A. Baragau, N. P. Power, D. J. Morgan, T. Heil, R. A. Lobo, C. S. Roberts, M.-M. Titirici, S. Dunn and S. Kellici, J. Mater. Chem. A, 2020, 8, 3270–3279 RSC.
- H. Liu, Z. Li, Y. Sun, X. Geng, Y. Hu, H. Meng, J. Ge and L. Qu, Sci. Rep., 2018, 8, 1–8 CrossRef.
- F. Yuan, Z. Wang, X. Li, Y. Li, Z. Tan, L. Fan and S. Yang, Adv. Mater., 2017, 29, 1604436 CrossRef.
- Q. Liang, W. Ma, Y. Shi, Z. Li and X. Yang, Carbon, 2013, 60, 421–428 CrossRef CAS.
- Q. Xu, P. Pu, J. Zhao, C. Dong, C. Gao, Y. Chen, J. Chen, Y. Liu and H. Zhou, J. Mater. Chem. A, 2015, 3, 542–546 RSC.
- Z. Wang, F. Yuan, X. Li, Y. Li, H. Zhong, L. Fan and S. Yang, Adv. Mater., 2017, 29, 1702910 CrossRef.
- M. J. Krysmann, A. Kelarakis, P. Dallas and E. P. Giannelis, J. Am. Chem. Soc., 2012, 134, 747–750 CrossRef CAS.
- F. Wang, Z. Xie, H. Zhang, C. Liu and Y. Zhang, Adv. Funct. Mater., 2011, 21, 1027–1031 CrossRef CAS.
- X. Li, S. Zhang, S. A. Kulinich, Y. Liu and H. Zeng, Sci. Rep., 2014, 4, 4976 CrossRef CAS.
- Y. Dong, R. Wang, H. Li, J. Shao, Y. Chi, X. Lin and G. Chen, Carbon, 2012, 50, 2810–2815 CrossRef CAS.
- H. Ding, S.-B. Yu, J.-S. Wei and H.-M. Xiong, ACS Nano, 2016, 10, 484–491 CrossRef CAS.
- W. Kwon and S.-W. Rhee, Chem. Commun., 2012, 48, 5256–5258 RSC.
- S. Sahu, B. Behera, T. K. Maiti and S. Mohapatra, Chem. Commun., 2012, 48, 8835–8837 RSC.
- Q. Wang, X. Huang, Y. Long, X. Wang, H. Zhang, R. Zhu, L. Liang, P. Teng and H. Zheng, Carbon, 2013, 59, 192–199 CrossRef CAS.
- H. Li, F.-Q. Shao, S.-Y. Zou, Q.-J. Yang, H. Huang, J.-J. Feng and A.-J. Wang, Microchim. Acta, 2015, 183(2), 821–826 CrossRef.
- Q.-Y. Cai, J. Li, J. Ge, L. Zhang, Y.-L. Hu, Z.-H. Li and L.-B. Qu, Biosens. Bioelectron., 2015, 72, 31–36 CrossRef CAS.
- Y. Dong, H. Pang, H. Bin Yang, C. Guo, J. Shao, Y. Chi, C. M. Li and T. Yu, Angew. Chem., Int. Ed., 2013, 52, 7800–7804 CrossRef CAS.
- H. Fei, R. Ye, G. Ye, Y. Gong, Z. Peng, X. Fan, E. L. G. Samuel, P. M. Ajayan and J. M. Tour, ACS Nano, 2014, 8, 10837–10843 CrossRef CAS.
- G. Hong, S. Diao, A. L. Antaris and H. Dai, Chem. Rev., 2015, 115, 10816–10906 CrossRef CAS.
- Y. Hu, X. Geng, L. Zhang, Z. Huang, J. Ge and Z. Li, Sci. Rep., 2017, 7, 1–9 CrossRef.
- J. Shangguan, J. Huang, D. He, X. He, K. Wang, R. Ye, X. Yang, T. Qing and J. Tang, Anal. Chem., 2017, 89, 7477–7484 CrossRef CAS.
- M. Zdanowicz, K. Wilpiszewska and T. Spychaj, Carbohydr. Polym., 2018, 200, 361–380 CrossRef CAS.
- Y. Chen and T. Mu, Green Energy Environ., 2019, 4, 95–115 CrossRef.
- N. Li, S. Zhang, L. Zheng, B. Dong, X. Li and L. Yu, Phys. Chem. Chem. Phys., 2008, 10, 4375–4377 RSC.
- Z. He and P. Alexandridis, Phys. Chem. Chem. Phys., 2015, 17, 18238–18261 RSC.
- P. Zhu, K. Tan, Q. Chen, J. Xiong and L. Gao, Chem. Mater., 2019, 31, 4732–4742 CrossRef CAS.
- Y.-P. Sun, B. Zhou, Y. Lin, W. Wang, K. A. S. Fernando, P. Pathak, M. J. Meziani, B. A. Harruff, X. Wang and H. Wang, J. Am. Chem. Soc., 2006, 128, 7756–7757 CrossRef CAS.
- T. E. Rosson, S. M. Claiborne, J. R. McBride, B. S. Stratton and S. J. Rosenthal, J. Am. Chem. Soc., 2012, 134, 8006–8009 CrossRef CAS.
- M. Hayyan, M. A. Hashim, A. Hayyan, M. A. Al-Saadi, I. M. AlNashef, M. E. S. Mirghani and O. K. Saheed, Chemosphere, 2013, 90, 2193–2195 CrossRef CAS.
- M. U. H. Shah, M. Sivapragasam, M. Moniruzzaman, M. M. R. Talukder, S. B. Yusup and M. Goto, J. Mol. Liq., 2018, 266, 568–576 CrossRef CAS.
- B. S. B. Kasibabu, S. L. D'souza, S. Jha and S. K. Kailasa, J. Fluoresc., 2015, 25, 803–810 CrossRef CAS.
- F. Lin, Y.-W. Bao and F.-G. Wu, C, 2019, 5, 33 CAS.
- W. Bing, H. Sun, Z. Yan, J. Ren and X. Qu, Small, 2016, 12, 4713–4718 CrossRef CAS.
Footnote |
| † Electronic supplementary information (ESI) available: Materials characterization, surface tension plots, calculations of QE, comparative QE and fluorescence images are provided. See DOI: 10.1039/d0ma00621a |
| This journal is © The Royal Society of Chemistry 2020 |