
 Open Access Article
 This Open Access Article is licensed under a Creative Commons Attribution-Non Commercial 3.0 Unported Licence
Flame spheroidisation of dense and porous Ca2Fe2O5 microspheres†
Jesús
Molinar Díaz
 a,
Sabrin Abdus
Samad
a,
Elisabeth
Steer
b,
Nigel
Neate
bc,
Hannah
Constantin
c,
Md Towhidul
Islam
ad,
Paul D
Brown
ab and
Ifty
Ahmed
*a
a,
Sabrin Abdus
Samad
a,
Elisabeth
Steer
b,
Nigel
Neate
bc,
Hannah
Constantin
c,
Md Towhidul
Islam
ad,
Paul D
Brown
ab and
Ifty
Ahmed
*a
aAdvanced Materials Research Group, Faculty of Engineering, University of Nottingham, University Park, Nottingham NG7 2RD, UK. E-mail: ifty.ahmed@nottingham.ac.uk
bNanoscale and Microscale Research Centre, University of Nottingham, University Park, Nottingham NG7 2RD, UK
cDepartment of Mechanical, Materials and Manufacturing Engineering, Faculty of Engineering, University of Nottingham, University Park, Nottingham NG7 2RD, UK
dDepartment of Applied Chemistry and Chemical Engineering, Faculty of Engineering, Noakhali Science and Technology University, Noakhali 3814, Bangladesh
First published on 18th November 2020
Abstract
Compositionally uniform magnetic Ca2Fe2O5 (srebrodolskite) microspheres created via a rapid, single-stage flame spheroidisation (FS) process using magnetite and carbonate based porogen (1![[thin space (1/6-em)]](https://www.rsc.org/images/entities/char_2009.gif) :1 Fe3O4:CaCO3) feedstock powders, are described. Two types of Ca2Fe2O5 microsphere are produced: dense (35–80 μm), and porous (125–180 μm). Scanning electron microscopy (SEM) based techniques are used to image and quantify these. Complementary high-temperature X-ray diffraction (HT-XRD) measurements and thermogravimetric analysis (TGA) provide insights into the initial process of porogen feedstock decomposition, prior to the coalescence of molten droplets and spheroidisation, driven by surface tension. Evolution of CO2 gas (from porogen decomposition) is attributed to the development of interconnected porosity within the porous microspheres. This occurs during Ca2Fe2O5 rapid cooling and solidification. The facile FS-processing route provides a method for the rapid production of both dense and porous magnetic microspheres, with high levels of compositional uniformity and excellent opportunity for size control. The controllability of these factors make the FS production method useful for a range of healthcare, energy and environmental remediation applications.
:1 Fe3O4:CaCO3) feedstock powders, are described. Two types of Ca2Fe2O5 microsphere are produced: dense (35–80 μm), and porous (125–180 μm). Scanning electron microscopy (SEM) based techniques are used to image and quantify these. Complementary high-temperature X-ray diffraction (HT-XRD) measurements and thermogravimetric analysis (TGA) provide insights into the initial process of porogen feedstock decomposition, prior to the coalescence of molten droplets and spheroidisation, driven by surface tension. Evolution of CO2 gas (from porogen decomposition) is attributed to the development of interconnected porosity within the porous microspheres. This occurs during Ca2Fe2O5 rapid cooling and solidification. The facile FS-processing route provides a method for the rapid production of both dense and porous magnetic microspheres, with high levels of compositional uniformity and excellent opportunity for size control. The controllability of these factors make the FS production method useful for a range of healthcare, energy and environmental remediation applications.
Introduction
Porous microspheres have been studied extensively for a variety of healthcare and energy applications, ranging from drug-delivery systems and tissue regeneration scaffolds, to batteries and supercapacitors.1,2 Porous microspheres offer advantageous properties over traditional solid microspheres, with applicability e.g. in separation sciences.3,4 Moreover, for biomedical applications, porous microspheres enable payloads (for drugs, cells, biologics etc.) to be incorporated on their surfaces or within the pores. In addition, other physical advantages are recognised, including large specific surface area and low density, along with absorption and release kinetics.1,5The manufacture of porous structures is dependent strongly on the type of material employed. For the case of glass and/or ceramic scaffolds, methods such as the incorporation of a removable space holder (via sintering),6 polymer foam replication,7 sol–gel,8 gel-cast foaming,9 or solid free-form (3D printing) approaches10 are typically employed. However, these methods generally involve numerous processing steps which can be time-prolonged and laborious.2 Residual materials, post thermal dissolution of space holders or sacrificial polymer templates, not only result in contamination of the porous products, but also affect their mechanical and physical properties.2 In the case of 3D printing, multiple steps are required, such as data acquisition, design/modeling, ink preparation, printing and post-processing treatments (e.g. drying and sintering).11,12 Manufacturing procedures for porous polymer microspheres typically involve emulsion-solvent evaporation, spray drying and phase separation techniques;1,2,5 whilst ceramic microspheres are processed via gelation,2,5 emulsification or precipitation methods.1,5 However, when seeking to manufacture microspheres with high levels of interconnected porosity, these methods generally present important limitations relating to scale-up,5 along with poor control over particle morphology, size and pore size.2
Alternatively, the single-stage, flame spheroidisation (FS) process is a unique, fast, cost-effective5 and promising technique for the large-scale manufacture and simultaneous production of porous and dense microspheres. Feeding irregular shaped particles into a high-temperature flame causes them to melt and form spherical particles upon ejection from the flame, mediated by surface tension followed by rapid cooling.13 This process has recently been developed and reported for glass porous microspheres.2,14 However, this is the first report on the production of porous and dense microsphere from ceramics (i.e. magnetite) using the FS process.
Magnetic microparticles (MMP) have great potential in healthcare and pharmaceutical applications, and for environmental remediation. In particular, magnetic microspheres (MMS) are considered advantageous for biomedical applications due to their chemical stability,15 biocompatibility15,16 and ease of transport within blood vessels, if they can be produced at a size (<3 mm) suitable for flow inside hepatic arteries.17 Magnetite (Fe3O4) microspheres and nanospheres have been investigated for magnetic-induced hyperthermia treatment of cancers18 and have been employed successfully as contrast agents in magnetic resonance imaging (MRI),15,19 whilst targeted magnetic drug-delivery systems are currently at the pre-clinical stage.15 MMP have also proved beneficial for environmental remediation, including the removal of heavy metals and radionuclides from contaminated soil and water, and phosphates from wastewater,15,20 along with oils and chemicals/toxins from the environment.20
Here, we demonstrate (for the first time) a novel application of the FS process, using Fe3O4 powder/CaCO3 porogen combinations, to create mixtures of compositionally uniform, porous and dense, magnetic Ca2Fe2O5 microspheres, with potential for a range of biomedical and environmental remediation applications.
Experimental
Materials and methods
The starting materials comprised as-supplied powders of iron(II,III) oxide (Fe3O4; <5 μm, 95%) (Sigma-Aldrich, UK) and calcium carbonate porogen (CaCO3, 98%) (Fisher Scientific UK Ltd). 5 mg of Fe3O4 and 5 mg of CaCO3 (1:1 ratio), combined with droplets of 2% aqueous solution poly vinyl alcohol (PVA; Sigma-Aldrich, UK) to act as binder, were mixed using a mortar and pestle and dried at 37 °C for 24 h (see ESI†). The powders prepared were flame-spray processed using a thermal spray gun (MK74, Metallization Ltd, UK) coupled with oxy-acetylene (O2/C2H2; 1:1 gas flow ratio). The microsphere products exiting the flame were collected using glass trays, positioned a short distance away from the thermal spray gun, and stored in glass vials for characterisation.
Materials characterisation
Structural characterisation of the FS products was performed using X-ray diffraction (XRD) (Bruker D8 Advance with Da Vinci using a LYNXEYE XE-T detector in 1D mode; Cu Kα radiation (λ = 0.15406 nm); 40 kV and 40 mA; step size 0.02°; step time 0.2 s; total time/step 29.8 s; 21 °C).Topographic imaging was performed using scanning electron microscopy (SEM) (FEI XL30; 5kV; spot size 2.5; 13.3 mm working distance, secondary electron (SE) imaging mode). Microsphere and pore size distributions were established using ImageJ 1.51h software (National Institutes of Health, USA). Complementary backscattered electron (BSE) imaging and chemical analysis of sieved and sectioned microspheres was performed using SEM-based mineral liberation analysis (MLA) (FEI Quanta600 MLA, 20 kV; spot size 7) equipped with energy dispersive X-ray spectroscopy (EDS) and computer software (FEI Quanta600 MLA, Bruker/JKTech/FEI software), used for elemental composition analysis and data acquisition for automated mineralogy. A Test sieve (stainless steel frame; 203 × 50 mm; 32 μm mesh; VWR International) was used to filter out particles sized below 32 μm. Sectioned samples were obtained by embedding the sieved microspheres in cold epoxy resin, followed by sequential mechanical grinding and polishing using silicon carbide discs and diamond cloths, respectively. Polished samples were cleaned and dried before being carbon coated.2
Complementary thermogravimetric analysis (TGA) (SDT Q600; 40–1500 °C; heating rate 10 °C min−1; air) and high-temperature XRD (HT-XRD) (Bruker D8 Advance Series 2 with MRI TC-Basic temperature chamber; Cu Kα radiation (λ = 0.15406 nm); step size 0.050°; step time 2 s; temperatures: 30, 450, 550, 650, 750, 950 and 1050 °C; heating rate 10 °C min−1) were used to investigate Fe3O4:CaCO3 mixed powders, as a function of heating. Semi-quantitative analysis (Bruker DIFFRAC.EVA software) was used to determine weight fractions of the constituent products.
Results
Structural characterisation
Fig. 1 presents an XRD pattern for 1:1 Fe3O4:CaCO3 FS-processed products (unsieved), confirming the presence of Ca2Fe2O5 (srebrodolskite) (ICDD PDF no. 00-047-1744), Fe3O4 (magnetite) (ICDD PDF no. 01-087-0244), Fe2O3 (ICDD PDF 00-033-0664) and CaCO3 (calcite) (ICDD PDF no. 00-047-1743).
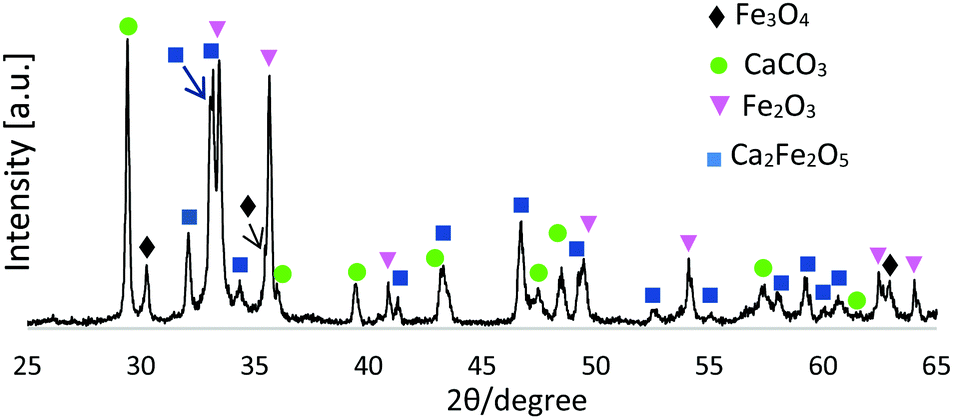 | ||
| Fig. 1 XRD pattern for FS-processed Fe3O4:CaCO3. | ||
Microsphere morphologies
Fig. 2a presents a low magnification SE image of these FS Fe3O4:CaCO3 products, demonstrating a mixture of large porous (125–180 μm) and smaller dense (35–80 μm) microspheres, along with some small irregular-shaped particles. A total of 124 pores measured from five different porous microspheres showed a minimum and maximum size of 1.8 and 64.5 μm, respectively, with a mean pore size of 13.1 μm (SD of 12.6 μm). Fig. 2b shows a typical spheroidised porous microsphere in detail, whilst with the magnified boxed region of Fig. 2c demonstrates the interconnected porous microstructure. Placing a simple bar magnet next to this FS-processed sample, following sieving, confirmed that the microsphere products remained magnetic post processing (see ESI†).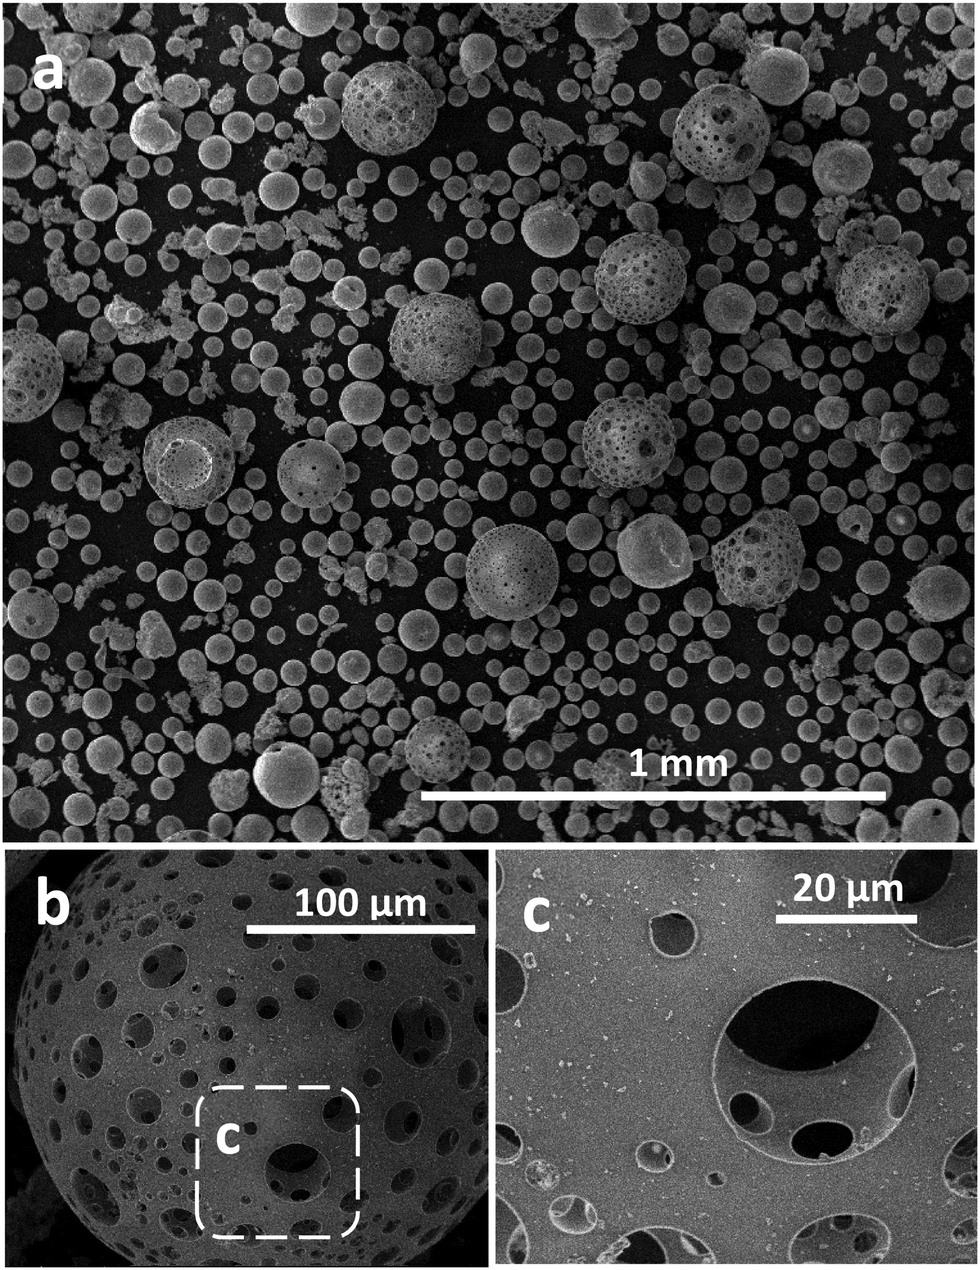 | ||
| Fig. 2 SE images of FS-processed Fe3O4:CaCO3 showing: (a) small, dense and large, porous microspheres; (b) details of a porous microsphere; and (c) microsphere interconnected porosity (boxed in region (b)). | ||
Compositional analysis
Fig. 3a presents a BSE image of a sieved, resin embedded and sectioned sample, comprising a mixture of the porous and dense microsphere products. A variety of developed porosities and very high levels of interconnected porosity for the larger microspheres is evident. Interestingly, mineral mapping analysis (Fig. 3b) provided evidence for the highly homogenous distribution of Ca2Fe2O5 throughout both dense and porous microspheres. A total of 1501 particles (99.75 wt% of the sample) were classified as srebrodolskite by the MLA software whilst using a standard 70% matching threshold (see ESI†). In addition, EDS analysis showed the elemental composition to be consistent with srebrodolskite, i.e. Ca – 19.1%, Fe – 57%, O – 23.9%. | ||
| Fig. 3 (a) BSE image and (b) MLA compositional analysis of FS-processed Fe3O4:CaCO3, following sieving and sectioning, illustrating microsphere porosity and demonstrating very high levels of Ca2Fe2O5 (blue) compositional homogeneity. Phases definitions are in the ESI.† | ||
Thermal analysis and structural transformation
Complementary TGA was used to profile the wt% change of the starting Fe3O4:CaCO3 powder mix (non-spheroidised starting powders), as a function of increasing temperature. The TGA curve of Fig. 4 demonstrated an initial 2.5 wt% increment from 40 °C to 611 °C, consistent with the oxidation of Fe3O4 to Fe2O3,21 followed by a drop of 11 wt%, from 611 °C to 712 °C, attributable to the decomposition of CaCO322 porogen within the sample. | ||
| Fig. 4 T-wt% curve for Fe3O4:CaCO3. | ||
Further, HT-XRD investigations were performed to profile the structural transformation of the powder mix as a function of slowly increasing temperature (10 °C min−1), providing insight into the chemical reaction pathway. Overall, the evidence demonstrated a progressive transformation of Fe3O4:CaCO3 to a mixture of CaCO3, Fe2O3 and Ca2Fe2O5 (Fig. 5), distinct from the CaCO3, Fe3O4 and Ca2Fe2O5 products for the case of rapidly-processed FS samples (Fig. 1). Fig. 5a confirmed the starting powder to be a mixture of magnetite and calcite (CaCO3), whilst their defining crystalline peaks progressively diminished with increasing temperature up to 550 °C (Fig. 5c, black arrows). A small peak attributable to the onset of Fe2O3 formation emerged at 450 °C (Fig. 5b, pink arrow). At 650 °C and 750 °C more intense and sharper peaks indicative of the development of Ca2Fe2O5 became evident (Fig. 5d and e blue arrows). A summary of the constituent products, as a function of temperature, is given in Table 1 (whilst noting the possibility of systematic error affecting the absolute values).
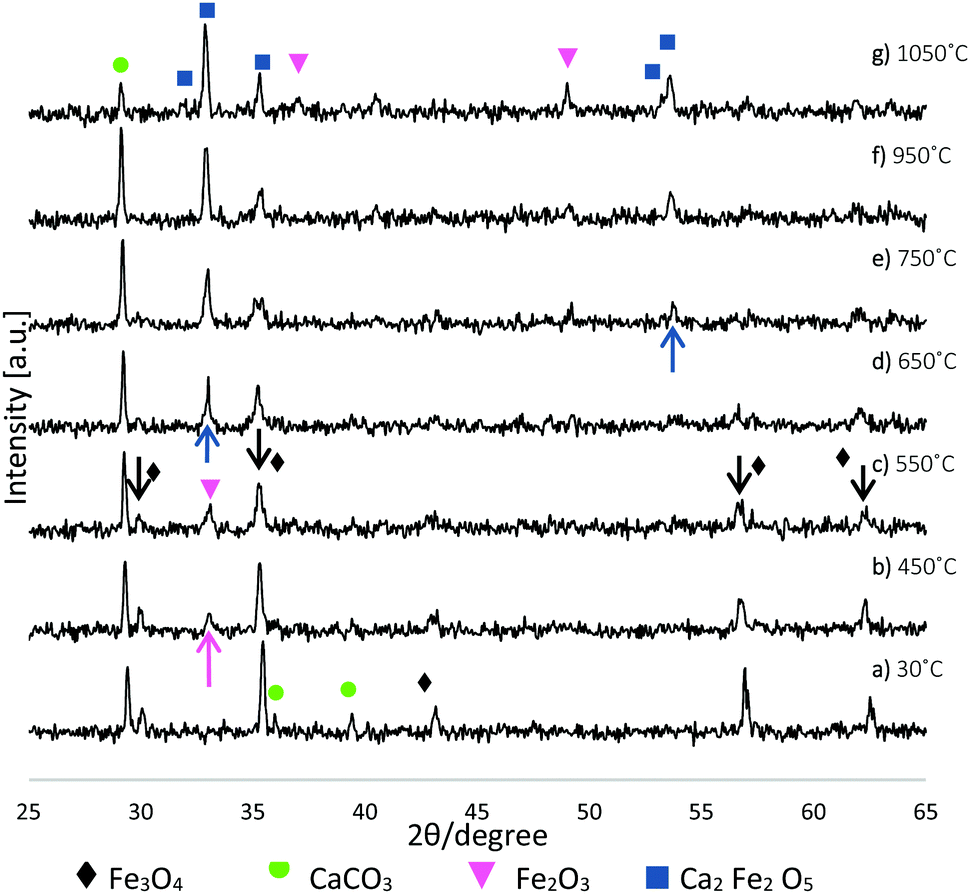 | ||
| Fig. 5 XRD patterns illustrating Fe3O4:CaCO3 structural transformation as a function of increasing temperature. | ||
| 30 °C | 450 °C | 550 °C | 650 °C | 750 °C | 950 °C | 1050 °C | |
|---|---|---|---|---|---|---|---|
| Fe3O4 | 30.2 | 11.9 | 11 | 6.1 | — | — | — |
| CaCO3 | 69.8 | 61.5 | 74.6 | 41.1 | 43.7 | 41.2 | 14.4 |
| Fe2O3 | — | 26.6 | 14.4 | 20.4 | 21.7 | 26.2 | 38.1 |
| Ca2Fe2O5 | — | — | — | 32.5 | 34.6 | 32.6 | 47.4 |
Discussion
This first report of the application of the rapid, single-stage, FS-processing method to magnetite demonstrates the transformation of Fe3O4:CaCO3 to a mixture of dense and highly porous Ca2Fe2O5 magnetic microspheres (with smaller, unreacted particles of Fe3O4, CaCO3 and reacted Fe2O3 removed simply by sieving). Fig. 6 schematically presents the key stages of dynamic evolution proposed for these FS-processed powders. | ||
| Fig. 6 Schematic representation of dense and porous Ca2Fe2O5 microsphere formation, via oxy-acetylene FS processing. | ||
The prepared Fe3O4:CaCO3 particles were fed into the high-temperature flame (∼3100 °C) where rapid melting and some droplet coalescence occurred. The molten particles acquired spherical shape post exiting the flame due to surface tension. The development of compositionally uniform, dense and porous Ca2Fe2O5 microspheres, upon rapid cooling and solidification, is consistent with the CaO:Fe2O3 (2:1 molar ratio) section of Ca–Fe–O phase diagram.23 It is considered that CO2, produced during CaCO3 decomposition and trapped in the form of gas bubbles within the molten droplets, rapidly escaped at the point of solidification and hence was responsible for the production of the larger Ca2Fe2O5 microspheres exhibiting high levels of interconnected porosity (Fig. 2b and c). The high compositional uniformity of the microspheres (Fig. 3b) confirmed that product composition was established before porosity development.
The evidence from HT-XRD and TGA investigations, both acquired under conditions of slow heating rate (10 °C min−1), provided complementary information relating to particle decomposition and reaction pathways. The HT-XRD data (Fig. 5 and Table 1) showed a transition of magnetite to hematite between 30 °C and 650 °C, whilst TGA data (Fig. 4) showing 2.5% weight increment between 40–611 °C was also consistent with an initial stage of Fe3O4 oxidation (eqn (1)). The TGA curve also showed substantial weight loss of 11% between 611–712 °C, consistent with the decomposition of CaCO3 porogen to CaO and CO2 evolution (eqn (2)). Indeed, it is noted that Ca2Fe2O5 brownmillerite-type phase (srebrodolskite) formation can occur as a consequence of Fe2O3 and CaO reaction (eqn (3)), whilst the formation of mineral srebrodolskite is in agreement with previous work on CaO:Fe2O3 thermal processing.22,24 In particular, Boyanov,24 reporting on the formation of calcium ferrites (Ca2Fe2O5 and CaFe2O4) in the range of 900–1200 °C, investigated by HT-XRD, noted complete consumption of CaO:Fe2O3 by 1200 °C. This balance helps to explain the presence of residual Fe2O3 peaks at 1050 °C in Fig. 5g. The absence of CaO peaks in Fig. 5 is attributed to the immediate reaction occurring between Fe2O3 and CaO once CaCO3 is decomposed (eqn (3)). Fig. 5 also showed that from 750 °C, Ca2Fe2O5 peaks gradually become more intense, evidencing srebrodolskite formation, whereas CaCO3 peaks become less intense. Table 1 records a significant 26.8% loss of weight of CaCO3 from 950 °C (41.2%) to 1050 °C (14.4%).
| 4Fe3O4 + O2 → 6Fe2O3 | (1) |
| CaCO3 → CaO + CO2 | (2) |
| 2CaO + Fe2O3 → Ca2Fe2O5 | (3) |
:Fe2O3 (2:1 molar ratio) is consistent with the formation of Ca2Fe2O5 upon rapid droplet cooling.
The magnetic expression of the FS-processed Ca2Fe2O5 microsphere products was attributed to their structural arrangements, comprising ordered oxygen vacancies with alternating layers of corner-sharing FeO4 tetrahedra and FeO6 octahedra.25,26 This structure provides for two types of magnetic moment, arising from FeO4 and FeO6,27 corresponding to antiferromagnetic and weak ferromagnetic behaviour, respectively.26,27
It is noted that manufactured, uniform Ca2Fe2O5 microspheres have relevance in a number of different fields, including biomedical, energy and environmental remediation. Further, developed porous microspheres provide the opportunity to incorporate and deliver active species to a specific location or environment, with potential applications ranging from environmental remediation, and industrial waste–water purification agents in particular, to energy stores and supercapacitors.28 Alternatively, given their spherical-shape, porous morphology and ferromagnetic expression, Ca2Fe2O5 microspheres could also be exploited for healthcare applications, e.g. MRI15,19 and drug-delivery systems.29
Conclusions
Dense (small, 35–80 μm) and porous (large, 125–180 μm) Ca2Fe2O5 (srebrodolskite) magnetic microspheres, with very high levels of compositional uniformity, have been produced via a facile, rapid, single-stage, flame spheroidisation process. Direct evidence from XRD, SEM and MLA characterisation, along with complementary HT-XRD and TGA investigations, have allowed a mechanism to be established, describing the morphological development of Ca2Fe2O5 microspheres from starting 1:1 Fe3O4:CaCO3 feedstock powder. It is proposed that the evolution of CO2 gas bubbles (arising from decomposition of the CaCO3 porogen), trapped within coalescing molten droplets, was responsible for the development of interconnected porosity during Ca2Fe2O5 cooling and rapid solidification. The combination of compositional control and high levels of porosity achieved opens up new opportunities, to explore the application of magnetic microspheres for a range of biomedical, energy and environmental remediation challenges.
Conflicts of interest
There are no conflicts to declare.Acknowledgements
Jesús Molinar Díaz would like thank the CONACyT programme and the Faculty of Engineering, University of Nottingham, for funding this work. With thanks also to Martin Roe and Julie Watts at the Nanoscale and Microscale Research Centre (nmRC), University of Nottingham, for training on SEM facilities and ImageJ software; and Jason Greaves from the Faculty of Engineering, University of Nottingham, for complementary TGA training.References
- Y. Cai, Y. Chen, X. Hong, Z. Liu and W. Yuan, Int. J. Nanomed., 2013, 8, 1111–1120 Search PubMed.
- K. M. Z. Hossain, U. Patel, A. R. Kennedy, L. Macri-Pellizzeri, V. Sottile, D. M. Grant, B. E. Scammell and I. Ahmed, Acta Biomater., 2018, 72, 396–406 CrossRef CAS.
- A. Ahmed, K. Skinley, S. Herodotou and H. Zhang, J. Sep. Sci., 2018, 41, 99–124 CrossRef CAS.
- W. Li and J. Y. Walz, Sci. Rep., 2014, 4, 4418 CrossRef.
- K. M. Z. Hossain, U. Patel and I. Ahmed, Prog. Biomater., 2015, 4, 1–19 CrossRef CAS.
- B. Arifvianto and J. Zhou, Materials, 2014, 7, 3588–3622 CrossRef.
- M. A. A. Muhamad Nor, L. C. Hong, Z. Arifin Ahmad and H. Md Akil, J. Mater. Process. Technol., 2008, 207, 235–239 CrossRef CAS.
- H. Cai, W. Mu, W. Liu, X. Zhang and Y. Deng, Inorg. Chem. Commun., 2015, 51, 71–74 CrossRef CAS.
- S. Hooshmand, J. Nordin and F. Akhtar, Int. J. Ceram. Eng. Sci., 2019, 1, 77–84 CrossRef CAS.
- Y. J. Tan, X. Tan, W. Y. Yeong and S. B. Tor, Sci. Rep., 2016, 6, 39140 CrossRef CAS.
- C. Minas, D. Carnelli, E. Tervoort and A. R. Studart, Adv. Mater., 2016, 28, 9993–9999 CrossRef CAS.
- L. Alison, S. Menasce, F. Bouville, E. Tervoort, I. Mattich, A. Ofner and A. R. Studart, Sci. Rep., 2019, 9, 409 CrossRef.
- D. Gupta, K. M. Z. Hossain, I. Ahmed, V. Sottile and D. M. Grant, ACS Appl. Mater. Interfaces, 2018, 10, 25972–25982 CrossRef CAS.
- D. Gupta, K. M. Z. Hossain, I. Ahmed, V. Sottile and D. M. Grant, ACS Appl. Mater. Interfaces, 2018, 10, 25972–25982 CrossRef CAS.
- D. Xiao, T. Lu, R. Zeng and Y. Bi, Microchim. Acta, 2016, 183, 2655–2675 CrossRef CAS.
- A. Rafieepour, M. R. Azari, H. Peirovi, F. Khodagholi, J. P. Jaktaji, Y. Mehrabi, P. Naserzadeh and Y. Mohammadian, Toxicol. Ind. Health, 2019, 35, 703–713 CrossRef CAS.
- N. Li, F. Michaud, Z. Nosrati, D. Loghin, C. Tremblay, R. Plantefeve, K. Saatchi, U. O. Hafeli, S. Martel and G. Soulez, IEEE Trans. Biomed. Eng., 2019, 66, 2331–2340 Search PubMed.
- M. V. Velasco, M. T. Souza, M. C. Crovace, A. J. A. D. Oliveira and E. D. Zanotto, Biomed., Glasses, 2019, 5, 148 Search PubMed.
- A. K. Fahlvik, E. Holtz and J. Klaveness, Magn. Reson. Imaging, 1990, 8, 363–369 CrossRef CAS.
- J. D. Orbell, H. V. Dao, L. N. Ngeh and S. W. Bigger, Environmentalist, 2007, 27, 175–182 CrossRef.
- E. R. Monazam, R. W. Breault and R. Siriwardane, Ind. Eng. Chem. Res., 2014, 53, 13320–13328 CrossRef CAS.
- T. Beuvier, J. F. Bardeau, B. Calvignac, G. Corbel, F. Hindré, J.-M. Greneche, F. Boury and A. Gibaud, J. Raman Spectrosc., 2013, 44, 489–495 CrossRef CAS.
- T. Hidayat, D. Shishin, S. Decterov and E. Jak, Metall. Mater. Trans. B, 2015, 47, 256–281 CrossRef.
- B. Boyanov, J. Min. Metall., Sect. B., 2005, 41, 67–77 CrossRef CAS.
- T. L. Phan, P. T. Tho, N. Tran, D. H. Kim, B. W. Lee, D. S. Yang, D. V. Thiet and S. L. Cho, J. Electron. Mater., 2018, 47, 188–195 CrossRef CAS.
- B. F. Amorim, M. A. Morales, F. Bohn, A. S. Carriço, S. N. de Medeiros and A. L. Dantas, Phys. B, 2016, 488, 43–48 CrossRef CAS.
- I. Kagomiya, Y. Hirota, K. I. Kakimoto, K. Fujii, M. Shiraiwa, M. Yashima, A. Fuwa and S. Nakamura, Phys. Chem. Chem. Phys., 2017, 19, 31194–31201 RSC.
- D. S. Vavilapalli, S. Banik, R. G. Peri, K. Muthuraaman, M. Miryala, M. Murakami, K. Alicja, K. Asokan, M. S. Ramachandra Rao and S. Singh, Sci. Rep., 2020, 10, 2713 CrossRef CAS.
- K. El-Boubbou, R. Ali, H. Al-Zahrani, T. Trivilegio, A. H. Alanazi, A. L. Khan, M. Boudjelal and A. AlKushi, Sci. Rep., 2019, 9, 9481 CrossRef.
Footnote |
| † Electronic supplementary information (ESI) available. See DOI: 10.1039/d0ma00564a |
| This journal is © The Royal Society of Chemistry 2020 |