 Open Access Article
Electromechanical dopant–defect interaction in acceptor-doped ceria†
Ahsanul
Kabir
 *a,
Victor
Buratto Tinti
a,
Maxim
Varenik
b,
Igor
Lubomirsky
 b and
Vincenzo
Esposito
 *a
*a
aDepartment of Energy Conversion and Storage, Technical University of Denmark, Kgs, Lyngby 2800, Denmark. E-mail: ahsk@dtu.dk; vies@dtu.dk
bDepartment of Materials and Interfaces, Weizmann Institute of Science, Rehovot 761001, Israel
First published on 6th October 2020
Abstract
Oxygen defective cerium oxide CeO2−δ exhibits a non-classical giant electromechanical response that is superior to that of lead-based electrostrictors. In this work, we report the key-role of acceptor dopants, with different size and valence (Mg2+, Sc3+, Gd3+, and La3+), on polycrystalline bulk ceria. Different dopants tune the electrostrictive properties by changing the electrosteric dopant–defect interactions. We find two distinct electromechanical behaviors: when the interaction is weak (dopant-vacancy binding energy ≤0.3 eV), electrostriction displays a high coefficient (M33), up to 10−17 (m V−1)2, with strongly time-dependent effects. In contrast, we observe no time-dependent effects when the interaction becomes strong (≥0.6 eV).
Over the last four decades, oxygen defective ceria has been widely used in multiscale applications from electrochemical devices to automotive catalysts, gas sensors, etc.1–3 Furthermore, a recent discovery demonstrated that ceria thin films display an unconventional electromechanical strain at room temperature.4–7 For example, the reported electrostriction coefficient (Me) is around 6.5 × 10⁻¹⁸ (m V−1)2 for [
 ] = 5%, i.e. 20 mol% Gd-doped ceria (GDC).4 Such a value is extremely high for a material with low dielectric constant (εGDCr ≈ 30)8 and high elastic modulus (YGDC ≈ 200 MPa).9 Surprisingly, in contrast to conventional inorganic ceramic materials, ceria thin films expand perpendicularly to the applied field direction. These properties are also investigated in bulk ceria and other oxygen defective fluorites (Bi2O3−δ), illustrating similar outcomes.10–15 The atomistic origin of this uncommon behavior is associated with the presence of charge compensating oxygen vacancies (
 ) in the ceria lattice.16,17 The
  creates an electroactive elastic dipole (
 ) having a long bond length and six anomalous reduced (CeCe–OO) bonds when compared to the bond length of undoped ceria, leading to the development asymmetric charge distribution and anisotropic local dipolar elastic field around the host lattice.18 Upon interaction with an electric field, this distorted fluorite lattice (
 ) complex becomes a more ideal-like fluorite structure and successively induces a considerable local strain and vice versa.16,17 Although governed by the
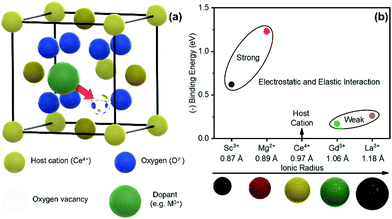
  complex, the local configuration of an oxygen vacancy is a crucial feature controlling electrostriction in bulk ceria.16,19 Literature reports of both computational and experimental studies demonstrate that the configuration of oxygen vacancies in the lattice strongly depends on dopant size and valence, i.e., electrostatic (attractive) and elastic (repulsive) interaction between the cation and vacancy.20–22Fig. 1a schematically represents a simple configuration of dopant cations concerning nearby oxygen vacancies in a unit cell of ceria. In general, the acceptor dopant prefers to occupy the next neighbour (1nn) or next-nearest neighbour (2nn) lattice site of an oxygen vacancy. The electrostatic interaction favors the 1nn site while elastic relaxation favors 2nn positions. When the total (electrosteric) dopant–defect interaction is significantly high, the dopant tends to cluster with
  , successively forming small/large scale defect associations and/or segregates locally at the crystalline disorders. The defect associate acts as an electric dipole, in which the binding energy of defect association dominates the ionic conductivity and dielectric constant since it traps more oxygen vacancies.23
 | ||
| Fig. 1 (a) Schamatic illustration of a unit cell of fluorite structured ceria, showing electrosteric interaction between the acceptor dopant and charge compensating oxygen vacancy. (b) Computationally calculated binding energy (1nn) values of variously doped ceria as a function of dopant radius. The data are taken from V. Butler et al.24 | ||
In this work, we intended to experimentally investigate the effect of dopant type, i.e., total dopant–defect interaction, on the electro-chemo-mechanical properties in bulk ceria. Four different dopants (Mn), including Sc3+, Mg2+, Gd3+, and La3+, were selected for this purpose. The computational calculations in Fig. 1b estimate that these dopants have a large span in the binding energy (1nn) values covering both strong and weak dopant–vacancy interactions, e.g., 0.15–1.25 eV.24 As can be seen, the binding energy of dopant defect interaction highly depends on the dopant type. For example, the Sc-and Mg-doped system introduces a stronger interaction than that of Gd- and La-doped ceria. Finally, we correlate the electrostriction behavior with the electrochemical properties from low to intermediate temperatures.
Nanoscale ceria powders with a composition of Ce1−xMxO2−δ where x = 0.10 and 0.05 for trivalent (M = Sc3+, Gd3+, La3+) and divalent (M = Mg2+) dopant, respectively were prepared using a combination of co-precipitation and nitrate route.25 At first, the appropriate amount of metal nitrate salts was dissolved in boiling nitric acid (5 N) under mild stirring and slowly cooled. Then pure ceria (CeO2) powder, as synthesized by the co-precipitation method described in 16 was dispersed in ethanol. Sequentially, a metal nitrate solution was transferred into the suspension. After that, the chemically modified suspension was ball-milled with zirconia balls (2 mm diameter) for 10 hours at 50 rpm, oven-dried at 100 °C, and finally calcined at 500 °C for 2 hours. Next, the powder was softly crushed with an agate mortar and pestle and sieved using a 150 μm mesh. For the pellet preparation, the powders were uniaxially cold-pressed (12 mm diameter) under a pressure of 200 MPa for half a minute and sintered at 1450 °C for 10 hours in atmospheric air. The apparent density of the resultant pellet was measured by the Archimedes method in the water medium. The crystallographic phase and microstructure were characterized by X-ray powder diffraction (XRD, Bruker D8) and scanning electron microscopy (SEM, Zeiss Merlin), respectively. For the dielectric and electrochemical measurements, silver paste (electrode) was brushed onto the parallel face of the sample and dried at 600 °C. The electrochemical experiments were performed using the two probe method with a frequency response analyzer (FRA-EIS, Solartron 1260) at 250–450 °C in a frequency range from 1 Hz to 10 MHz in the air with an alternating potential of 100 mV. The room temperature impedance (dielectric) measurement was carried out with a dielectric analyzer (Novocontrol) in a high voltage mode (10 VAC) with frequencies between 1 MHz and 1 mHz. The electromechanical strain was estimated at room temperature under ambient conditions (relative humidity 25–50%) with a proximity sensor of the capacitive type with lock-in detection, as explained in detail elsewhere.10 The sensitivity of the sensor is 1.9 mV nm−1 displacement. The longitudinal strain was estimated as the ratio between the displacement of a pushrod connected to the sample surface by a spring and the real thickness of the sample. The setup was calibrated with a commercial sample of PMN–PT (TRS Technologies, M33 = 3.5 ± 0.5 × 10⁻¹⁶ (m V−1)2 and a piezoelectric 100-cut quartz single crystal d33 = 2.3 ± 0.2 pm V−1). The samples were polished (up to 4000 mesh), washed with ethanol/acetone, and then thermally treated at 500 °C for 5 hours in the air. Two mechanically contacted metal electrodes made of stainless steel metal plates were used.
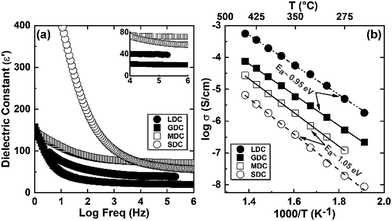
As measured, the sintered pellets are highly dense and above 95% of the theoretical density, agreeing with the microstructural analysis (Fig. S1, ESI†). The grains are thermodynamically relaxed and have an average size between 3 and 5 μm, regardless of the composition. The XRD pattern of the samples corresponds with the reference profile of pure ceria (Fig. S2, ESI†), illustrating a single-phase cubic fluorite structure without any additional phases. The dielectric constant of a material has a significant role in controlling electrical properties, i.e., dopant–defect interaction and defect cluster.26 The distinction of the dielectric constant (ε′) concerning applied frequency is estimated from the imaginary part (Z′′) of the complex EIS spectra and represented in Fig. 2a at room temperature. As can be seen, ε′ is relatively constant from high to intermediate frequencies (up to ∼10 kHz) for all samples. However, ε′ increases significantly at lower frequencies, which is associated with increased capacitive effect, leading to accumulation of charge at the high-energy barrier site.27 As estimated, the GDC and LDC samples have a lower ε′ value than those of SDC and MDC compounds (see Table 1), indicating that electrostatic interaction between dopant and defect is small in the former. Characteristically, the dielectric constant increases with increasing temperature (Fig. S3, ESI†), since the polarization of charge carriers increases at higher temperatures. From the EIS spectra, the electrical conductivity of the sample is measured using the Nyquist formalism,2 which allows separation of the grain, grain boundary, and electrode contribution (Fig. S4 and S5, ESI†). The resistivity of all compounds is strongly dominated by the grain boundary and they have an ion-blocking factor above 0.9 at 300 °C. The effect of the ion blocking property is qualitatively estimated by the parameter called grain boundary blocking factor (αg.b.), where  .19 In cerium based oxides, not only grain boundary but also dopant–defect association, nanoclusters, dopant segregation, and residual pores all combined introduce the ion-blocking effect.2,28 The temperature-dependent total electrical conductivity (σ) is illustrated in Fig. 2b that follows the Arrhenius expression:
 | (1) |
| Sample ID | f g.b. (Hz) | ε′ | M 33 (1 Hz) (m V−1)2 | M 33 (100 Hz) (m V−1)2 |
|---|---|---|---|---|
| LDC | 4.0 × 101 | 40 | 0.5 × 10⁻¹⁷ | 0.04 × 10⁻¹⁷ |
| GDC | 2.0 × 101 | 25 | 3.0 × 10⁻¹⁷ | 0.15 × 10⁻¹⁷ |
| MDC | 1.0 × 101 | 75 | 0.4 × 10⁻¹⁷ | 0.25 × 10⁻¹⁷ |
| SDC | 1.0 × 10² | 65 | 0.12 × 10⁻¹⁷ | 0.15 × 10⁻¹⁷ |
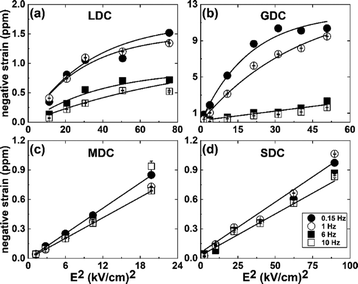
The electrostrictive strain of the samples, with a response to the applied electric field, is illustrated in Fig. 3. As noticed, the strain starts to saturate at a particular electric field value, e.g., ∼4–5 kV cm−1, for the LDC and GDC samples. The saturation of strain is fitted with the empirical equation:10
 | (2) |
 | (3) |
 | ||
| Fig. 3 (a–d) The negative electromechanical strain as a function of electric field square under applied frequencies from ∼0.15 to 10 Hz. | ||
 | ||
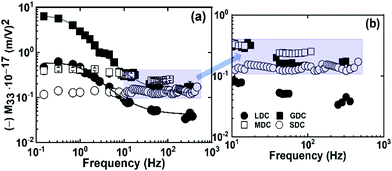
| Fig. 4 Frequency-dependent electrostrictive strain coefficient (M33) of all samples at (a) 0.15–700 Hz and (b) high-frequency regime. | ||
In this work, variously doped ceria compounds having equivalent oxygen vacancy concentration were fabricated by conventional sintering at higher temperatures. The resultant dense pellets illustrate relaxed grains of micron size. As expected, the samples show a highly deviated dielectric relaxation and total electrical conductivity based on the local configuration of oxygen vacancies built in the materials. Moreover, all of these compounds demonstrate an unconventional electrostriction response. Interestingly, the sample having weak dopant–defect interaction in the lattice generates a frequency-dependent electrostriction behavior. Whereas, the material with strong dopant–defect interaction exhibits a frequency-independent steady electrostriction coefficient from low to high frequencies. To sum up, the local oxygen vacancy configuration and its association with the dopant cation is a crucial factor controlling the electromechanical response in cerium-based compounds.
Conflicts of interest
There are no conflicts to declare.Acknowledgements
This research was supported by the DFF-Research project grants from the Danish Council for Independent Research, Technology and Production Sciences, grant number 48293 (GIANT-E), and the European H2020-FETOPEN-2016-2017 project BioWings, grant number 801267. The authors would like to thank Rana Al Tahan for her assistance in impedance measurements.Notes and references
- H. Inaba and H. Tagawa, Solid State Ionics, 1996, 83, 1–16 CrossRef CAS.
- V. Esposito and E. Traversa, J. Am. Ceram. Soc., 2008, 91, 1037–1051 CrossRef CAS.
- A. Kabir, S. Colding-Jørgensen, S. Molin and V. Esposito, Mater. Lett., 2020, 279, 128513 CrossRef CAS.
- R. Korobko, A. Patlolla, A. Kossoy, E. Wachtel, H. L. Tuller, A. I. Frenkel and I. Lubomirsky, Adv. Mater., 2012, 24, 5857–5861 CrossRef CAS.
- M. Hadad, H. Ashraf, G. Mohanty, C. Sandu and P. Muralt, Acta Mater., 2016, 118, 1–7 CrossRef CAS.
- S. Santucci, H. Zhang, S. Sanna, N. Pryds and V. Esposito, APL Mater., 2019, 7, 071104 CrossRef.
- S. Santucci, H. Zhang, S. Sanna, N. Pyrds and V. Esposito, J. Mater. Chem. A, 2020, 8, 14023–14030 RSC.
- S. Kim and J. Maier, J. Electrochem. Soc., 2002, 149, J73 CrossRef CAS.
- E. Wachtel and I. Lubomirsky, Scr. Mater., 2011, 65, 112–117 CrossRef CAS.
- N. Yavo, O. Yeheskel, E. Wachtel, D. Ehre, A. I. Frenkel and I. Lubomirsky, Acta Mater., 2018, 144, 411–418 CrossRef CAS.
- N. Yavo, A. D. Smith, O. Yeheskel, S. Cohen, R. Korobko, E. Wachtel, P. R. Slater and I. Lubomirsky, Adv. Funct. Mater., 2016, 26, 1138–1142 CrossRef CAS.
- A. Kabir, J. R. Bowen, M. Varenik, I. Lubomirsky and V. Esposito, Materialia, 2020, 12, 100728 CrossRef CAS.
- A. Kabir, M. E. Cachaza, E. M. Firodaliso, D. Ke, S. Grasso, B. Merle and V. Esposito, J. Eur. Ceram. Soc., 2020, 14, 5612–5618 CrossRef.
- A. Kabir, J. Kyu Han, B. Merle and V. Esposito, Mater. Lett., 2020, 266, 127490 CrossRef CAS.
- M. Varenik, J. C. Nino, E. J. Wachtel, O. Yeheskel, N. Yavo and I. Lubomirsky, ACS Appl. Mater. Interfaces, 2020, 12, 39381–39387 CrossRef CAS.
- E. Wachtel, A. I. Frenkel and I. Lubomirsky, Adv. Mater., 2018, 1707455 CrossRef.
- Y. Li, O. Kraynis, J. Kas, T. C. Weng, D. Sokaras, R. Zacharowicz, I. Lubomirsky and A. I. Frenkel, AIP Adv., 2016, 6, 055320 CrossRef.
- A. S. Nowick, B. S. Berry and J. L. Katz, J. Appl. Mech., 1975, 42, 750 CrossRef.
- A. Kabir, S. Santucci, N. Van Nong, M. Varenik, I. Lubomirsky, R. Nigon, P. Muralt and V. Esposito, Acta Mater., 2019, 174, 53–60 CAS.
- J. Koettgen, S. Grieshammer, P. Hein, B. O. H. Grope, M. Nakayama and M. Martin, Phys. Chem. Chem. Phys., 2018, 20, 14291–14321 CAS.
- S. Omar, E. D. Wachsman and J. C. Nino, Solid State Ionics, 2008, 178, 1890–1897 CrossRef CAS.
- H. Zhang, I. E. Castelli, S. Santucci, S. Sanna, N. Pryds and V. Esposito, Phys. Chem. Chem. Phys., 2020, 1–8 Search PubMed.
- S. Anirban, T. Paul, P. T. Das, T. K. Nath and A. Dutta, Solid State Ionics, 2015, 270, 73–83 CrossRef CAS.
- V. Butler, C. R. A. Catlow, B. E. F. Fender and J. H. Harding, Solid State Ionics, 1983, 8, 109–113 CrossRef CAS.
- F. Kern, R. Gadow and A. Kabir, Ceram. Mater., 2017, 69, 279–285 CAS.
- S. Anirban and A. Dutta, RSC Adv., 2015, 5, 95736 RSC.
- K. P. Padmasree and A. F. Fuentes, Mater. Chem. Phys., 2019, 223, 466–472 CrossRef CAS.
- D. R. Ou, T. Mori, F. Ye, T. Kobayashi, J. Zou, G. Auchterlonie and J. Drennan, Appl. Phys. Lett., 2006, 89, 171911 CrossRef.
- R. Gerhardt-Anderson and A. S. Nowick, Solid State Ionics, 1981, 5, 547–550 CrossRef CAS.
- A. Kabir, H. Zhang, S. Colding-Jørgensen, S. Santucci, S. Molin and V. Esposito, Scr. Mater., 2020, 187, 183–187 CrossRef CAS.
Footnote |
| † Electronic supplementary information (ESI) available. See DOI: 10.1039/d0ma00563k |
| This journal is © The Royal Society of Chemistry 2020 |

