
 Open Access Article
 This Open Access Article is licensed under a Creative Commons Attribution-Non Commercial 3.0 Unported Licence
Bio-inspired perylene diimide coated super paramagnetic nanoparticles for the effective and efficient removal of lead(II) from aqueous medium†
Sucharita
Dey
a,
Shouvik
Mahanty
b,
Ankita
Saha
a,
Prince
Kumar
a,
Rajdeep
Saha
a,
Chirantan
Kar
 a,
Punarbasu
Chaudhuri
b and
Pradip Kr.
Sukul
*a
a,
Punarbasu
Chaudhuri
b and
Pradip Kr.
Sukul
*a
aDepartment of Chemistry, Amity Institute of Applied Sciences, Amity University Kolkata, Action Area-II, Kadampukur, New Town, Rajarhat, Kolkata-700135, India. E-mail: pksukul@kol.amity.edu; sukul.ochem@gmail.com
bDepartment of Environmental Science, University of Calcutta, Kolkata-700019, India
First published on 30th July 2020
Abstract
Instability in water, the complexity of separation of the toxic substances produced and reusability issues for the reported materials used for the decontamination of lead from water are the hindrances that have caught the attention of the modern scientific community over the last few decades, resulting in the creation of an important field of research, the purification of heavy metals from water. Here, we unveil a unique ensemble, the perylene diimide coated magnetic nanoparticle, which is a conglomerate of ultra-photo stable perylene diimide [PDI] functionalized with biocompatible amino acid (levodopa) i.e. l–3, 4-dihydroxyphenylalanine (L-DOPA) capping the superparamagnetic Fe3O4 nanoparticle core, for the removal of lead from contaminated water. The nanomaterial has a very simple magnetic mechanism to remove lead from water involving chelation between the lead and the L-DOPA of PDI with an exceptionally high efficiency. The characterization of the nanomaterial was substantiated by Fourier-transform infrared spectroscopy (FTIR), X-ray diffraction (XRD) analysis, high-resolution transmission electron microscopy (HR-TEM) and a physical property measurement system (PPMS). All of the materials (PDI, Fe3O4) are low in cost, nontoxic, and can be easily synthesized with an outstanding adsorption capacity of 1407.5 mg g−1 and a Kd value of 1.14 × 10⁶ mL g−1. This material can effectively reduce the Pb(II) concentration from 4000 to 7 ppb, well below the acceptable limit for drinking water standards and can effectively perform at a low pH level with a 99.97% efficiency. This amazing doughnut-shaped duo of PDI and Fe3O4 nanoparticle will make a significant contribution to the field of lead removal from water.
Introduction
On the Earth, the presence of life makes our planet unparalleled to the rest of the universe, and one of the pillars on which our biological empire is built is water. The earth is made up of 70% water and 97.5% of it is held by the oceans, leaving only 2.5% as drinkable water.1 The crisis of drinkable water is further exacerbated by our ever-increasing hunger for industrialization.2 From the very inception of industrialization and urbanization, waste products have been imposing alarming threats to both aquatic and terrestrial life.3,4Lead toxicity is associated with various human diseases.5 Lead can bind with proteins and metabolites.6–8 It also has an extremely vicious property, where it can mimic ions8 such as Ca2+, Mg2+, Fe2+, and Zn2+ and interfere with their biological roles in our body, giving rise to problems such as anemia and neurological dysfunction in children.8–13 It is also a potent carcinogenic substance and systemic poison, causing reproductive disorders.13–16 In fish, subtle, sub-lethal, physiological responses occur at a very low concentration of lead(II) in water.17,18 Lead is a versatile element that is ductile, durable, malleable, dense, a poor conductor of electricity and highly resistant towards corrosion; no wonder it has been used in water pipe and paint industries for years. Many incidents of lead pollution in India and the USA have come to light in the past decade.19–23 The maximum permissible limit of lead(II) in water discharge is a concentration of 0.1 mg L−1 for wastewater, whereas 15 and 10 μg L−1 is permissible in drinking water, respectively, as set by the EPA (Environmental Protection Agency) and WHO (World Health Organization).24–27
Researchers are striving to find different ways to purify water from lead contamination. Traditional methods such as membrane filtration, electrochemical methods, chemical precipitation, sorbents or ion exchange including nanomaterials, chelating polymers, clay, zeolite, and so forth all have advantages and disadvantages.28–33 Chemical precipitation generates sludge as a secondary pollutant and toxic fumes, it has a low efficiency, reduced selectivity and specificity, and moderate affinity towards heavy metal separation.34 Electrochemical and sorbent methods are effective for selective heavy metals at optimal pH and at certain concentrations, however, they demand costly resources and are ineffective for small scale production.35–37 Membrane purification such as micellar enhanced ultrafiltration, reverse osmosis, nanofiltration, and polymer-enhanced ultrafiltration, albeit a better choice, have the disadvantages of a high expense, membrane fouling and limiting feeding flaws which fail to match the reality of industrially relevant scales.33–41 In the contemporary world of research, nanomaterials and metal–organic frameworks (MOFs) have been explored for separating heavy metals from water owing to their high surface area and adsorption capacity. For example, MOFs, a very popular method nowadays, were used by Yu and coworkers to develop Zn(II)-based MOFs decorated with O− groups for the removal of Pb2+, resulting in an adsorption capacity of 616.64 mg g−1.42 In 2018, Sun and his team developed a MOF-polymer composite of Fe-BTC (1,3,5-benzenetricarboxylate)/polydopamine to remove lead(II) from water with a maximum adsorption capacity of 394 mg g−1.43 In 2019, nanotube-like Tb-based MOFs (Tb-MOFs) were also introduced by Zhu et al. for removing Pb2+ from water with an adsorption capacity of 547 mg g−1.44 Cao and his team developed magnesium oxide nanostructures with the highest capacities of adsorption (1980 mg g−1) for Pb(II).45 Despite being advanced, these methods suffer from a few major setbacks such as lack of stability in aqueous media, pH dependence, complexity in purification of the compound itself from water after its use, and inability to withstand a harsh chemical environment. On the other hand, a superparamagnetic core coated with organic molecules can be a better choice in case of water treatment as solid–liquid separation becomes much easier and faster than the centrifugation or filtration technique and its small size has a larger surface area; but they still fall behind owing to their instability in acidic media, poor dispersibility in water and their biocompatibility. There are a few reports on superparamagnetic nanomaterials for water purification with high adsorption efficiencies of lead(II). Superparamagnetic Fe3O4 nanoadsorbents46–50 are also easily separated from water by magnetization, leaving behind no toxic side reactions. However, they usually suffer from instability in aqueous solution, and involve an undesirable interaction with non-heavy alkaline earth metals. These are the major setbacks of the superparamagnetic materials. Charpentier et al. developed a method of heavy metal removal using superparamagnetic chitosan (CS) and carboxymethylchitosan (CMC) nanocomposites in 2016 with a moderate adsorption capacity of 243 mg g−1.46 In 2014, Kumar and his team prepared graphene oxide–MnFe2O4 magnetic nanohybrids that showed an adsorption capacity for lead(II) from water of 673 mg g−1.49 In 2017, Bagbi et al. reported L-cysteine functionalized nanoparticles for lead adsorption, which gave a very low Langmuir adsorption, for example 18.8 mg L−1.50 Keeping all of the aforementioned drawbacks in mind, our pivotal vision in this study was to transform this superparamagnetic core coated material concept into a cost-efficient, metal-specific nanomaterial that is highly dispersible in water and has a high efficiency that can cope with both larger and smaller scale lead removal from water.
Herein, we report a novel material, by developing a levodopa (L-DOPA) functionalized perylene diimide (LDPI) coated amphiphilic superparamagnetic nanomaterial (NPLD) for the decontamination of lead from water. We have coated the magnetic core with perylene diimide (PDI) which is best known for its robust nature, chemical and thermal inertness, high photo-stability and stability in acidic medium51–54 that allows our compound to withstand in industrial wastewater environment that usually degrades organic molecules. Perylene diimides (PDIs) are best known as n-type semiconductors and have received immense attention in the field of organic optoelectronics owing to their tunable electronic structure and properties.55–58 However, the application of PDIs for the purification of water is rare. LDPI has a severe tendency towards aggregation in water and π–π stacking interactions, it also has high photo-stability, high fluorescent quantum yield, and minimal cost of synthesis, which is appended with the naturally occurring amino acid L-DOPA at the imide position. L-DOPA is the precursor to dopamine, it can cross the protective blood–brain barrier and is used as a neuro drug for Parkinson's disease59 to increase the dopamine concentration, this indicates that it is highly biocompatible and not at all toxic in nature. Reportedly, L-DOPA captures lead(II) selectively from waste water, for example in 2017, Zhang et al. reported polydopamine microspheres for capturing lead(II) selectively in the presence of competitive calcium(II), sodium(I), and magnesium(II) ions.60 Rybtchinski et al. successfully used fabricated supramolecular membrane of PDI for size selective ultrafiltration of nanoparticles by using its reversible self-assembly.53 In 2014, Xing and his group developed functionalized PDI based magnetic nanoplatforms for purification and detection of bacterial lipopolysaccharides.54 Considering these attractive properties of PDI as a purifying material, PDI and L-DOPA were handpicked to make an aggregated ring like doughnut, surrounding the center filled with magnetic Fe(III)/Fe(II). This merges the sporadic duo into an invincible particle to withdraw Pb2+ from water, acting like a magnet with an exceptionally high adsorption capacity of 1407.5 mg g−1 and a Kd value of 1.14 × 10⁶ mL g−1.
Experimental section
Materials
Perylene-3,4:9,10-tetracarboxylic dianhydride (PTCDA) and L-DOPA were purchased from Sigma-Aldrich and used as received. LDPI was synthesized according to a previously reported method. For all experiments and spectroscopic measurements, HPLC grade water or MilliQ water were used.Instruments
1H-NMR spectra were taken at 25 °C in ppm (parts per million) using 500 MHz spectrometers (Bruker). The Fourier-transform infrared (FT-IR) spectra were collected using KBr pellets of experimental samples in an FTIR 8400S instrument (Shimadzu). The high-resolution transmission electron microscopy (HRTEM) images of the nanomaterials were observed using a JEOL HR-TEM microscope operating at 200 kV. The magnetic measurements were performed using a cryogenic physical property measurement system (PPMS). Neodymium disc magnets (strength: 0.4–0.6 Tesla) with a diameter of 13 × 4 mm were used to separate the magnetic nanoparticles from the water. The quantitative analysis of the metal ions was carried out using a Thermo Scientific iCAP 7000 series ICP-OES instrument. For standard measurements, an ICP grade MERCK standard was used. The zeta potentials were determined using dynamic light scattering (DLS) on a Malvern Instruments Zetasizer.General procedure for the synthesis of water soluble perylene diimide (LDPI)61–63
1 g (2.55 mmol) of PTCDA, 1.154 g (6.37 mmol) L-DOPA and 8 g of imidazole were heated at 130 °C for 6 h under an inert atmosphere. Then, 100 mL of ethanol was poured into the hot mixture, refluxed for 6 h and left overnight to precipitate out. The precipitate was filtered and washed with ethanol several times. The product was dried at 70 °C in a vacuum oven to obtain 1.40 g of a deep dark blackish red solid powder product, with a yield of 71% (Scheme 1).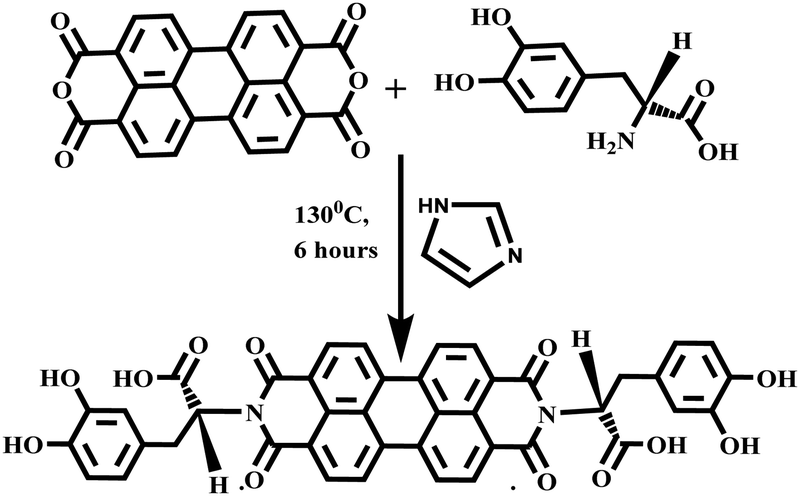 | ||
| Scheme 1 Diagram showing the synthesis of L-DOPA functionalized perylene diimide (LDPI). | ||
1H-NMR (500 MHz, D2O, 25 °C) ∂: 8.26 (br, 8H), 6.78 (m, 2H), 6.67 (br, 4H), 5.97 (br, 2H), 5.74 (br, 4H). MS (MALDI-TOF): m/z calc. for C42H26N2O12: 750.66, found: 751.12 [M + H+]. FT-IR (KBr) νmax = 630, 751, 958, 1254, 1342, 1367, 1438, 1576, 1651, 1693, 3455 cm−1. UV/Vis (H2O): λmax/nm (ε/M−1 cm−1) 522 (29![[thin space (1/6-em)]](https://www.rsc.org/images/entities/char_2009.gif) 627), 486 (17438), 455 (8795). Fluorescence (H2O): λmax/nm: 569, 618, fluorescence quantum yield (Φf) = 0.54.
627), 486 (17438), 455 (8795). Fluorescence (H2O): λmax/nm: 569, 618, fluorescence quantum yield (Φf) = 0.54.
General procedure for “in situ” synthesis of NPLD-nanoparticles64
The nanomaterial was synthesized following an in situ method, as follows, in a typical reaction, 0.5 mL of 2 mM LDPI was diluted with 20 mL of water. 2 mL of FeCl3 (20.0 mM) and 2 mL of FeSO4 (25 mM) were added dropwise to this solution and the mixture was stirred at room temperature for 30 min. 0.3 mL of ammonia was added to adjust the pH of the solution to about 10. Subsequently, the mixture was heated to 90 °C and stirred for 30 min. After the mixture was cooled to room temperature, the resulting precipitate was separated from the suspension by centrifugation (4000 rpm) and washed with water four times, to therefore obtain the nanomaterial (NPLD).Experimental methods
For the 200 mg L−1 PbCl2 solution, 8 mg of PbCl2 was dissolved in 29.8 mL of HPLC water. Similarly, 15, 35 and 27 mg of PbCl2 were dissolved in 22.38, 20.06 and 20.116 mL of HPLC water, respectively, using a micropipette in order to produce 500, 1300, and 1000 mg L−1 solutions, respectively, in 50 mL Falcon tubes. All of the weights were carefully measured using a microbalance.
For the selectivity tests, 10 mg of Mg(NO3)2 (magnesium nitrate), CdSO4·8H2O (cadmium sulphate), PbCl2 (lead chloride), Ca(NO3)2·4H2O (calcium nitrate), ZnCl2 (zinc chloride), NaCl (sodium chloride) and KCl (potassium chloride) respectively, were carefully weighed in seven different beakers and 47.394, 73.04, 372.527, 84.857, 239.873, 196.695 and 262.228 mL of HPLC water were added, respectively, to make 20 ppm metal stock solutions.
For the breakthrough experiment we have made another series of 7000 ppm stock solutions for all interfering metals and lead(II). 739 mg of Mg(NO3)2 (magnesium nitrate), 480 mg of CdSO4·8H2O (cadmium sulphate), 94 mg of PbCl2 (lead chloride), 413 mg of Ca(NO3)2·4H2O (calcium nitrate), 146 mg of ZnCl2 (zinc chloride), 178 mg NaCl (sodium chloride) and 134 mg of KCl (potassium chloride) were measured into seven different beakers and 10 mL of HPLC water was added, respectively, to make 7000 ppm metal stock solutions. 10 mL solutions containing 140 ppm of each metal ion were prepared individually from the above solutions with the appropriate dilution.
For the regeneration experiments, 100 mL of 0.01 mol L−1 EDTA solution was prepared as a stock solution for regeneration studies by dissolving 372 mg of EDTA in 100 mL of HPLC water. ICP grade MERCK standard was used for all experiments.
Pb2+ adsorption isotherm
Into three different 15 mL Falcon tubes was placed 10 mg of NPLD and 5 mL of HPLC water was added to each. The solutions were dispersed using a sonicating bath and sonicated for 15 min. Finally, 5 mL of the previously prepared three stock solutions of Pb(II), 200, 500 and 1300 mg L−1, were added separately to each tube to obtain the desired concentrations of lead(II) ions, i.e. 100, 250 and 650 mg L−1, respectively.All of the three final solutions were shaken well to make them homogenous and magnetic pellets of 15 mm in length were added to each solution. They were placed on a magnetic stirrer and stirred at 200 rpm at room temperature for 24 h to facilitate the adsorption of Pb2+ by NPLD. After 24 h, the magnetic stirrers were switched off and the solutions were allowed to settle down. After 24 h of adsorption, the Pb2+ coated NPLD settled down at the bottom of the falcon tube towards the magnetic stirrer because of its superparamagnetic nature. To measure the amount of adsorbed Pb2+ ion concentration, 5 mL of the supernatant was removed from each solution. ICP-OES (inductively coupled plasma-optical emission spectrometry) was performed to measure the Pb2+ concentration.
The samples for the ICP-OES measurements were prepared as follows: each of the 5 mL supernatant samples was centrifuged at 11000 rpm at room temperature for 10 min, then acidified with 20% HNO3, then kept in a rocker overnight, again the solution was centrifuged at 11000 rpm at room temperature for 10 min and filtered using a 60 mL syringe with an AXIVA 25 mm/0.2 μm sterile filter. After filtration, 2.7 mL of the previously derived 100 mg L−1 Pb2+ solution, 4 mL of the 250 mg L−1 Pb2+ solution and 3.9 mL of the 650 mg L−1 Pb2+ solution were placed in three separate 15 mL falcon tubes and filled with 7.3, 6, and 6.1 mL of HPLC water, respectively, to reach the minimum volume of 10 mL to make them eligible for ICP-OES. In a similar way, a blank solution of 1000 mg L−1 of lead(II) solution was prepared and ICP-OES was performed.
5 mL of the previously prepared 200 mg L−1 stock solution was taken and added to the 5 mL NPLD solution while resting on the magnetic stirrer and adding magnetic pellets simultaneously. A stopwatch was started at the contact time and a series of 1 mL aliquots of the supernatant was taken out at 2, 5, 10, 30 and 60 min intervals and poured into five different 15 mL Falcon tubes. 4 mL of HPLC water was added individually to each of the newly prepared solutions, each of them was centrifuged at 11000 rpm at room temperature for 10 min, then acidified with 20% HNO3, then kept in a rocker overnight, then again each of the solutions was centrifuged at 11000 rpm at room temperature for 10 min and filtered using a 60 mL syringe and an AXIVA 25 mm/0.2 μm sterile filter. After filtration, 4, 4, 4.9, 4.5, and 4.6 mL from the respective five solutions of Pb2+ were placed in five separate 15 mL Falcon tubes and filled up with 6, 6, 5.1, 5.5, and 5.4 mL of HPLC water respectively to reach the minimum volume of 10 mL to carry out the ICP-OES measurements.
000 rpm at room temperature for 10 min, then acidified with 20% HNO3, and kept in a rocker overnight. Again, the solution was centrifuged at 11000 rpm at room temperature for 10 min and filtered using a 60 mL syringe and an AXIVA 25 mm/0.2 μm sterile filter, 4 mL of the experimental solution was removed and topped up with 6 mL of HPLC water for the ICP-OES measurements. The entire process was repeated three times by separating and collecting 18, 17 and 16 mg of NPLD nanoparticles consecutively via the aforementioned experiments. 18 mg of the NPLD nanoparticles was dispersed with 9 mL of HPLC water and 9 mL of the previously prepared 200 mg L−1 Pb2+ solution. The recollected 17 mg of NPLD was mixed with 8.5 mL of HPLC water and 8.5 mL of the previously prepared 200 mg L−1 Pb2+ solution and the last 16 mg of recollected NPLD was dissolved in 8 mL of HPLC water and 8 mL of the previously prepared 200 mg L−1 Pb2+ solution.
Selectivity tests
Selectivity experiments were performed with Na+, K+, Ca2+, Zn2+, Mg2+, Cd2+, and Pb2+ ions. Firstly, 10 mg of NPLD was placed individually into seven different 15 mL Falcon tubes using a microbalance, along with 5 mL of HPLC water using a micropipette. The solutions were dispersed using an ultrasonic bath as described previously. 5 mL of the previously prepared 20 ppm stock cationic solution of Na+, K+, Ca2+, Zn2+, Mg2+and Cd2+ ions were added individually to the seven aforementioned 15 mL Falcon tubes, respectively. For the preparation of the mixed cationic solution for the breakthrough experiment, 715 μL of each cationic solution of the previously prepared 140 ppm stock solution was added to a 5 mL aqueous solution containing the dispersed 10 mg NPLD nanomaterial to give a total volume of 10 mL. The final concentration of all metal ions was 10 ppm. In addition, 715 μL of each of the other six cations, other than lead, of the previously prepared 7000 ppm stock solution, and 715 μL of 140 ppm Pb(II) were added to another 5 mL aqueous solution containing the dispersed 10 mg NPLD nanomaterial to give a total volume of 10 mL. The final concentration of all cations, except for lead(II), was 500 ppm and the final concentration of lead(II) was 10 ppm in this solution. All of the final solutions were shaken well to ensure homogeneity and magnetic pellets of 15 mm length were added into each solution. They were placed on a magnetic stirrer and stirred at 200 rpm at room temperature for 24 h to facilitate the adsorption of cations by NPLD. After completion, the colloidal nanoparticles were allowed to settle and were removed using magnetic separation, 5 mL of the supernatant solution was taken from each and 5 mL of HPLC water was added individually to all the solutions giving a total volume of 10 mL. The solutions were then centrifuged at 11000 rpm at room temperature for 10 min, no particles were observed, then they were acidified using 20% HNO3, then kept in a rocker overnight, the solutions were again centrifuged at 11000 rpm at room temperature for 10 min and filtered using a 60 mL syringe and an AXIVA 25 mm/0.2 μm sterile filter. Finally, 10 mL of each of the experimental solutions was used for ICP-OES measurements. A blank metal solution of 10 ppm was prepared using the same procedure used in the ICP-OES process.
000 rpm at room temperature for 10 min, no particles were observed. They were then acidified with 20% HNO3, kept in rockers for 12 h, the solutions were again centrifuged at 11000 rpm at room temperature for 10 min and filtered using a 60 mL syringe and an AXIVA 25 mm/0.2 μm sterile filter and 10 mL of each of the experimental solutions was used for ICP-OES measurements.
Cell culture
WI38 cells were cultured in the lab supplemented with a 5% CO2 humidified atmosphere at 37 °C using Dulbecco's modified eagle's medium (DMEM) containing 10% fetal bovine serum, kanamycin sulfate (110 mg L−1), penicillin (50 units per mL), and streptomycin (50 μg mL−1), trypsin–EDTA (1×) solution was used for cell splitting.Cell viability assay
WI38 cells were treated with the NPLD and an MTT assay was performed to check the cellular viability. The MTT assay is a colorimetric analysis in which MTT is reduced to purple formazan using cellular reductase enzymes of live cells. Dead cells do not produce cellular reductase, and hence are unable to develop the purple color. Therefore, the number of dead cells can be quantitatively estimated from the absorbance study. Using this phenomenon, we checked the number of cells that were alive after treatment with NPLD with respect to cells (control) which were not treated with the compound. The Y-axis of the bar plot represents the % viability of cells (the percentage of live cells compared to the control) and the X-axis represents the various concentrations of NPLD. The absorbance at 550 nm was measured using the Multiskan™ GO Microplate Spectrophotometer and the % viability was calculated. Cells were seeded at a density of 10000 cells per well in a 96-well plate before 24 h of treatment. Cells were treated with 3.125, 6.25, 12.5, and 25 μg mL−1 solutions of NPLD in serum free media for 4 h. After that the cells were incubated for 48 h in complete media. The MTT solution (5 mg mL−1) was prepared in PBS. 50 μL of MTT solution was added into each well and incubated at 37 °C for 4 h. Purple colored formazan was dissolved in 1:1 (v/v) DMSO/MeOH and the absorbance of the wells was measured at 550 nm using a micro-plate ELISA reader. The % viability was calculated from these absorbance values. The data show that the % viability remains over 90% upon increasing the concentration of NPLD.
Result and discussion
A schematic illustration for the construction of the perylene diimide coated magnetic nanoparticle (NPLD) and its application for the removal of lead(II) from water is shown in Fig. 1, in which LDPI was formed by reacting L-DOPA with PTCDA. The LDPI was synthesized following the previous report,61–63 using imidazole as a solvent. The LDPI coated nanoparticles were synthesized using the “in situ” method64 to obtain a reddish black powder that exhibits a magnetic response in the presence of an external magnet. It showed an exceptional stability of more than 6 years in a dry state as its dispersibility in water and the magnetic response remains the same, with dopamine outside, which is strongly susceptible to Pb(II).65 To corroborate the presence of the desired functional groups, FTIR spectroscopy was performed for pure LDPI, as well as NPLD. The infrared spectra were measured in the range 4000–400cm−1. Table 1 shows the FTIR data65,66 and Fig. 2a shows the peaks in the FTIR spectra. As shown in Fig. 2a, the six characteristic major bands corresponding to the functional groups –O–H stretching (–COOH group), –C![[double bond, length as m-dash]](https://www.rsc.org/images/entities/char_e001.gif) O stretching (–COOH group and imide group), –C–O stretching (–COOH group) and –O–H bending (–COOH group), were analyzed for both LDPI and NPLD, which are summarized in Table 1. The shifting of the major bands towards a lower frequency region indicates the formation of conjugated nanomaterials, as –O–H groups and oxygen of the carbonyl groups are interacting with iron oxide, and hence the subsequent bond order decreases.64 The peaks at 567 and 429 cm−1 correspond to the vibration of the tetrahedral and octahedral site of Fe3+/Fe2+–O2−.62 X-ray diffraction (XRD) was performed to analyze the crystalline orientation of the magnetic core, Fe3O4. The six characteristic peaks of Fe3O467 were found in Fig. 2b at 0.485, 0.298, 0.253, 0.210, 0.171, 0.161 and 0.148 nm which give the corresponding characteristic planes (111), (220), (311), (400), (422), (511) and (440) of the cubic inverse spinel Fe3O4 structure68,69 further supporting the structure of the NPLD nanomaterial.
O stretching (–COOH group and imide group), –C–O stretching (–COOH group) and –O–H bending (–COOH group), were analyzed for both LDPI and NPLD, which are summarized in Table 1. The shifting of the major bands towards a lower frequency region indicates the formation of conjugated nanomaterials, as –O–H groups and oxygen of the carbonyl groups are interacting with iron oxide, and hence the subsequent bond order decreases.64 The peaks at 567 and 429 cm−1 correspond to the vibration of the tetrahedral and octahedral site of Fe3+/Fe2+–O2−.62 X-ray diffraction (XRD) was performed to analyze the crystalline orientation of the magnetic core, Fe3O4. The six characteristic peaks of Fe3O467 were found in Fig. 2b at 0.485, 0.298, 0.253, 0.210, 0.171, 0.161 and 0.148 nm which give the corresponding characteristic planes (111), (220), (311), (400), (422), (511) and (440) of the cubic inverse spinel Fe3O4 structure68,69 further supporting the structure of the NPLD nanomaterial.
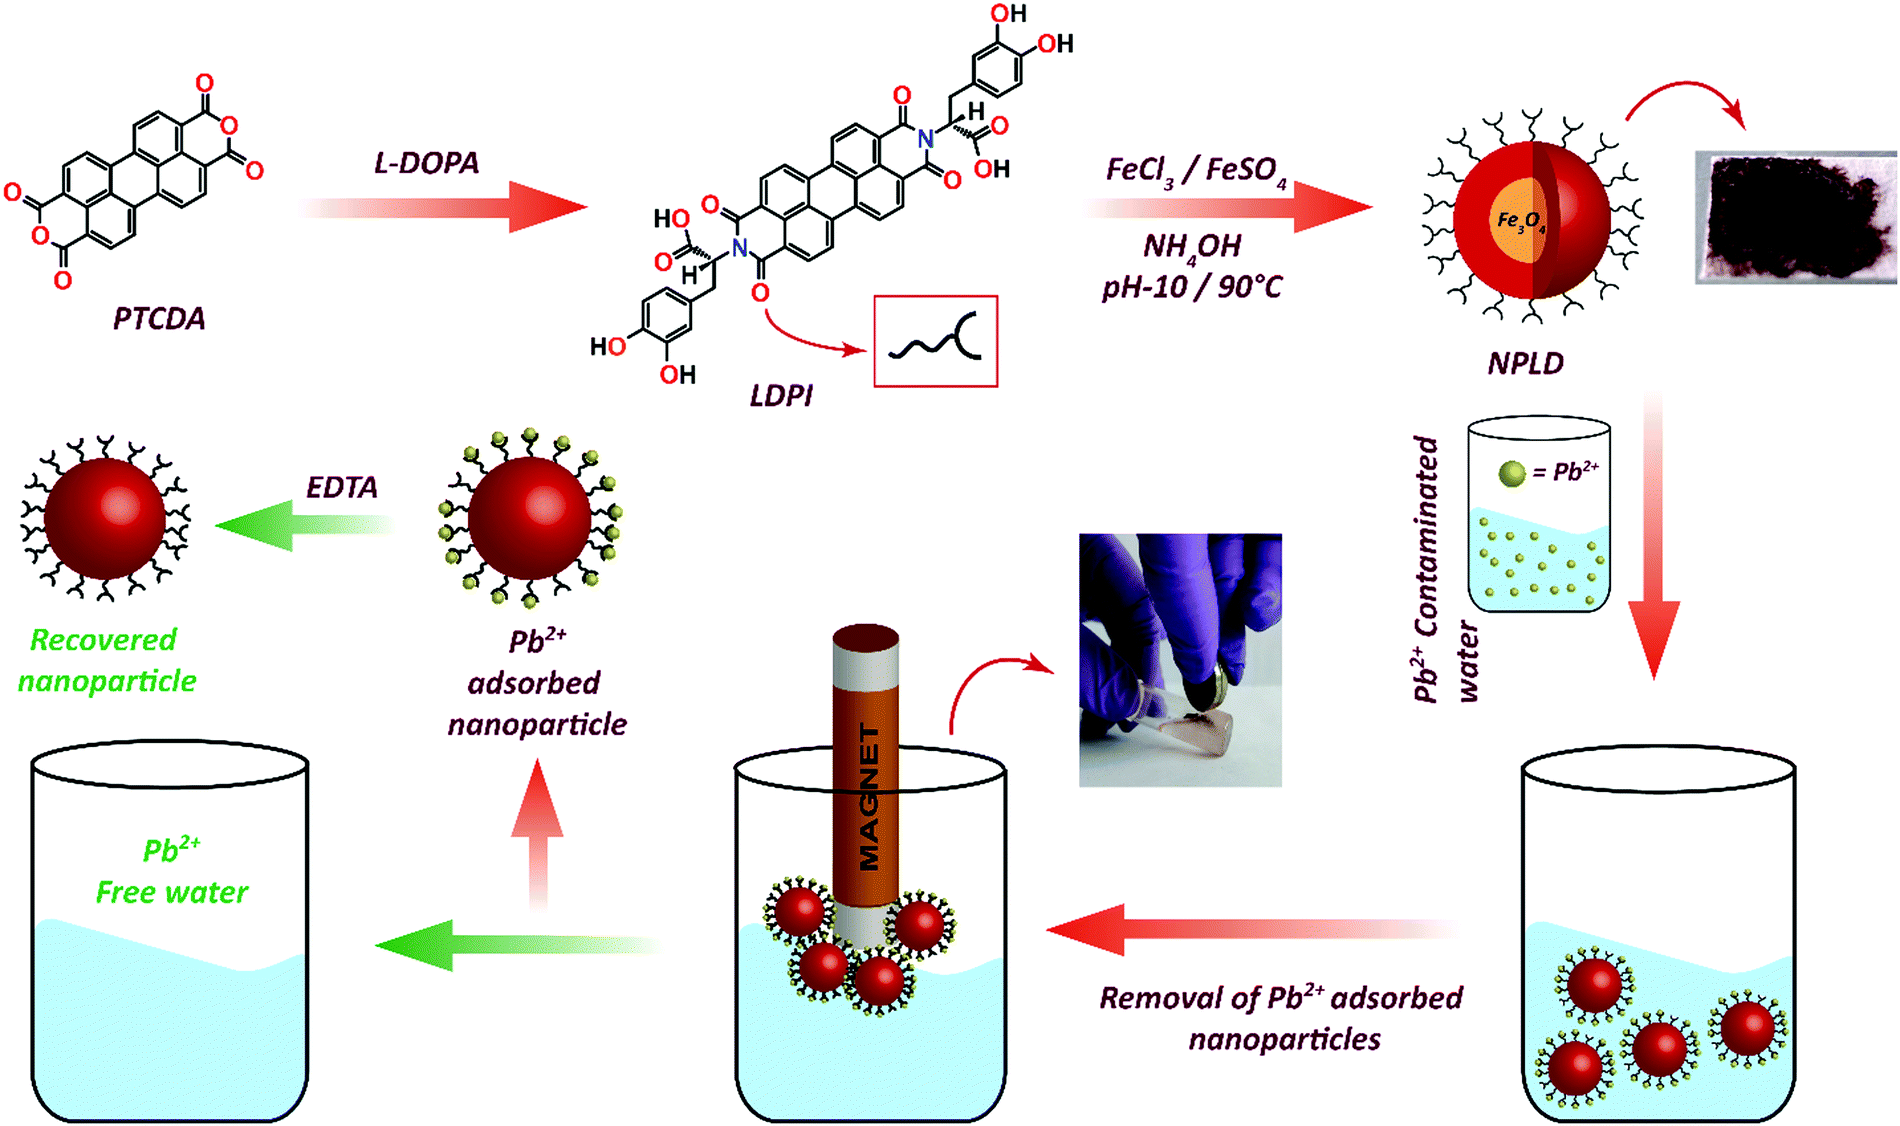 | ||
| Fig. 1 Schematic illustration of the synthesis of perylene diimide coated magnetic nanoparticles (NPLD) and its application for the removal of Pb2+ ions from contaminated water. | ||
| Peak assigned for bands | LDPI (cm−1) | NPLD (cm−1) |
|---|---|---|
| (1) –O–H stretching (–COOH group) | 3455–2830 | 3452–2832 |
| (2) –CO stretching (–COOH group) |
1693 | 1686 |
| (3) –CO stretching (imide group) |
1651 | 1643 |
| (4) –O–H bending (–COOH group) | 1438 | 1401 |
| (5) –C–O stretching (–COOH group) | 1342 | 1342 |
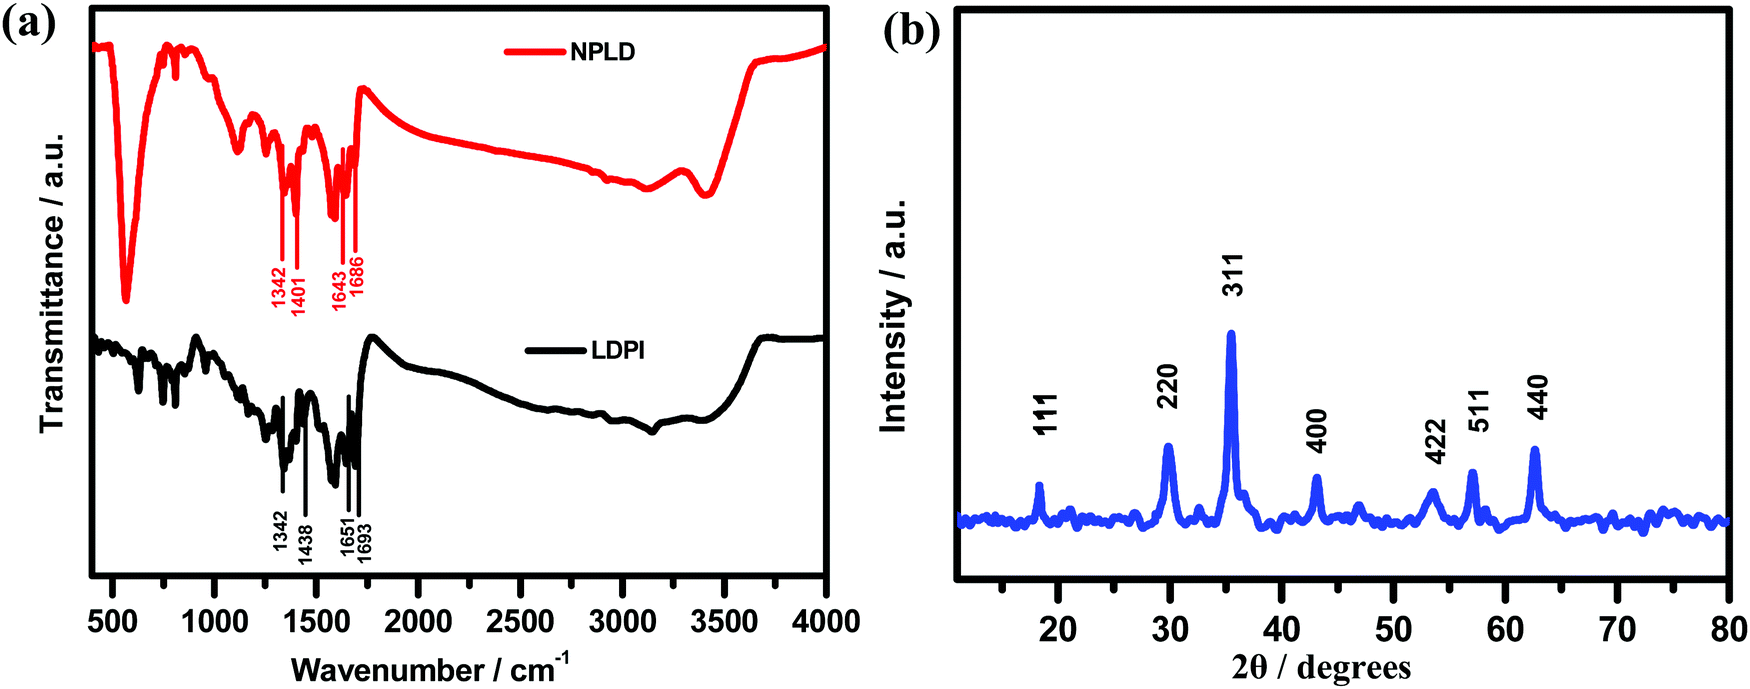 | ||
| Fig. 2 (a) FTIR of NPLD and pure LDPI. (b) XRD pattern of NPLD, showing the distinct plane (111), (220), (311), (400), (422), (511) and (440) of the cubic inverse spinel Fe3O4 structure (JCPDS number-19-0629). | ||
High-resolution transmission electron microscopy revealed the morphological state of the NPLD-magnetic core, which has a cloud-like periphery encircling a black nexus with prominent crystal planes. In this context, as shown in Fig. 3a, the image shows no agglomerated structure and the cloud-like periphery represents the shell of the aggregated perylene diimide molecules via coordination bonding induced by the hydroxyl group and the –COOH group present at the imide position on the magnetic core. The core is depicted as the black nexus of Fe3O4, as clearly shown in Fig. 3b and c. Fig. 3a and b reveals the formation of 20–30 nm sized core–shell nanoparticles. Fig. 3b and c provides information about the size of the core and the shell of the NPLD nanoparticles, which are 21–26 and 4–6 nm respectively. Energy dispersive X-ray analysis (EDX) proved65 the presence of iron with a typical iron peak value of 6.4, as shown in Fig. 3d. The superparamagnetic nature of the inverse spinel magnetite was confirmed by using a cryogenic physical property measurement system superconducting quantum interference device (SQUID) magnetometer.70,71 The hysteresis curve obtained, as shown in Fig. 4a reveals that they are superparamagnetic at room temperature and exhibit a narrow hysteresis loop at 4 K with a coercivity of 215 Oe, which indicates a reversible magnetization–demagnetization nature. The saturation magnetization value is ∼8.5 emu g−1 at 300 K. The zero-field cooled (ZFC) and field cooled (FC) magnetization curves shown in Fig. 4b exhibit a distinct blocking temperature of 130 K (measured at 100 Oe), which is also characteristic of superparamagnetism. The superparamagnetic characteristic of the magnetic iron core of NPLD is responsible for the attraction to the external magnetic field, which is the key feature of separating lead from lead-contaminated water.
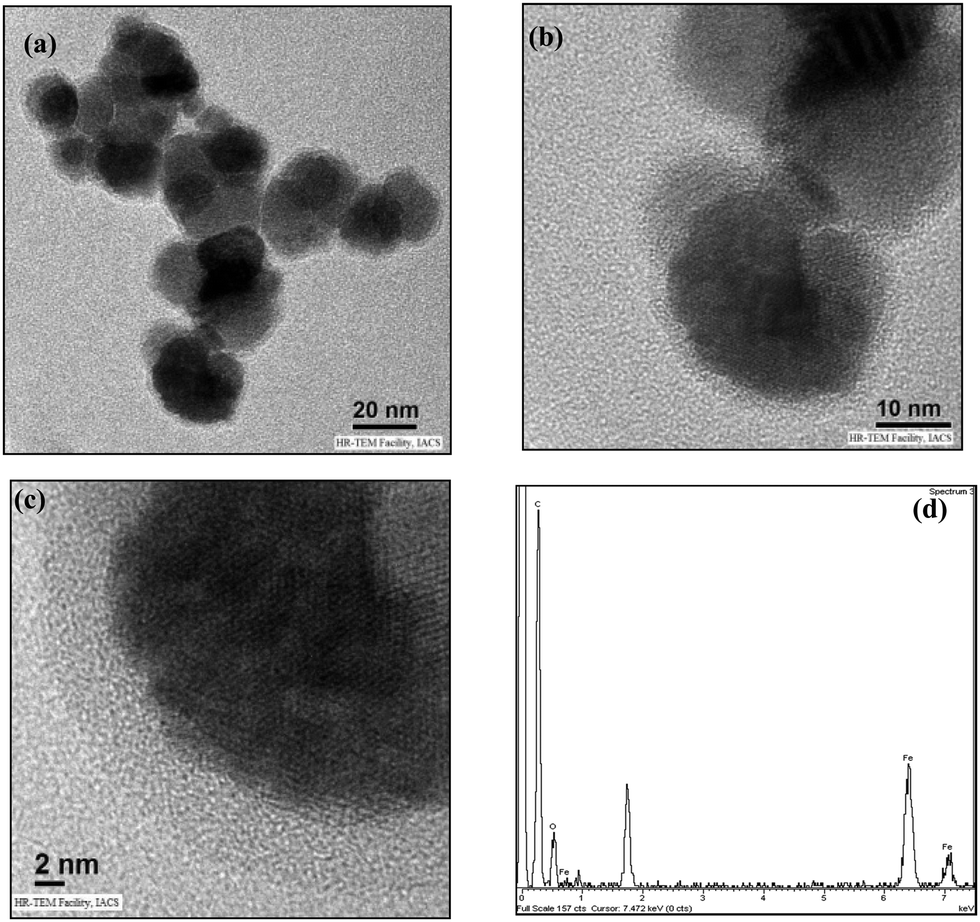 | ||
| Fig. 3 (a–c) Show low to high resolution HRTEM images of NPLD nanoparticles. (a) The nanoparticles are not agglomerated, from (b) the size is determined to be 24 nm and (c) clearly shows the dark magnetic iron oxide core encircled by an aggregated L-DOPA functionalized perylene diimide (shell). (d) EDX showing characteristic peaks of Fe present in NPLD. | ||
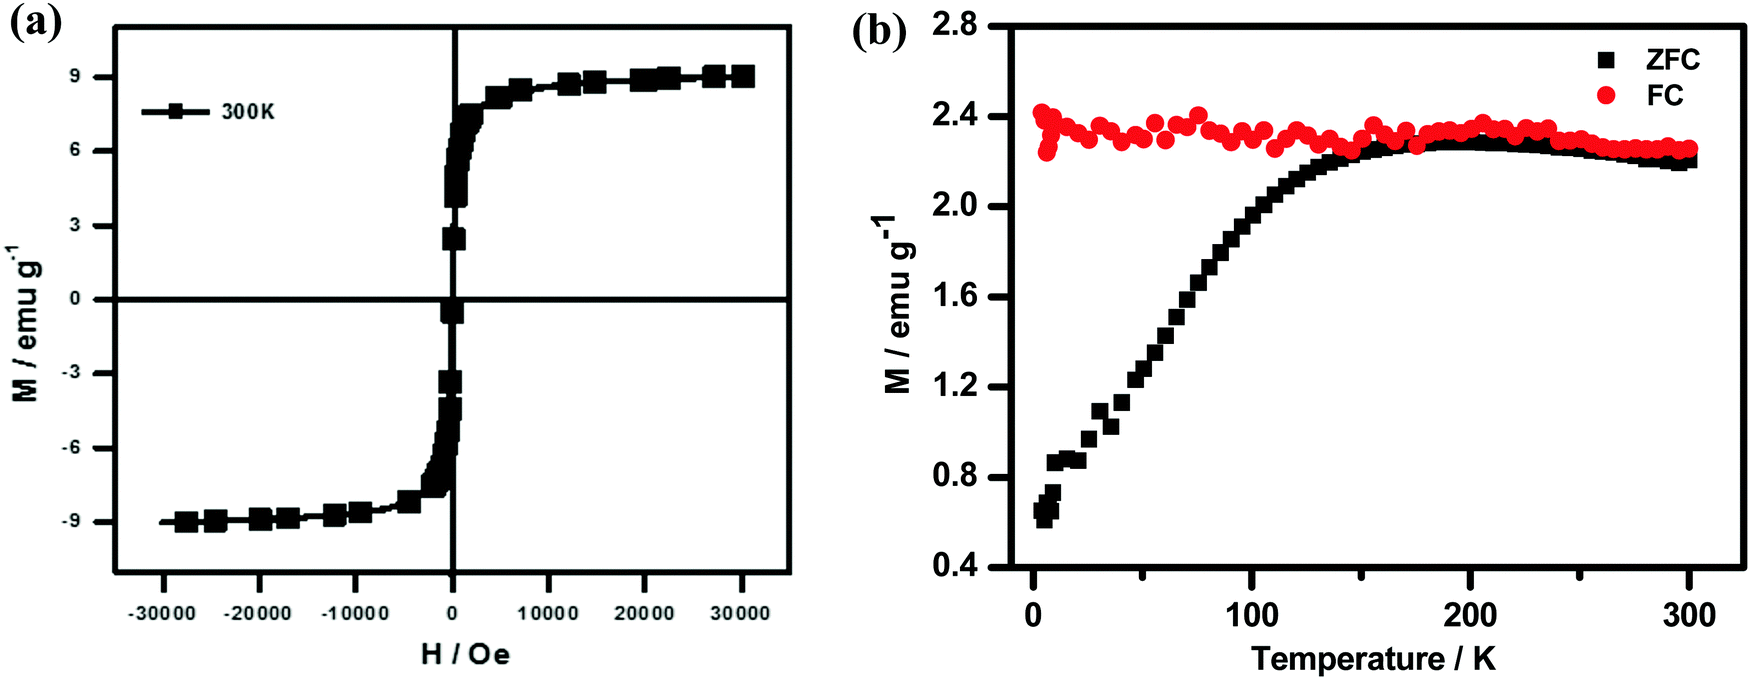 | ||
| Fig. 4 (a) Magnetic hysteresis loops of NPLD magnetic nanoparticles at 300 K. (b) A distinct blocking temperature of 130 K (measured at 100 Oe) shown by ZFC and FC magnetization curves. | ||
The latest literature surveys portrayed different organic compounds with distinct chelating ligands showing their capabilities for the removal of heavy metals such as. Pb2+, Hg2+, Cd2+, Cu2+ and so forth42,43,46,70,72 from water. Yu and co-workers42 developed a three dimensional porous MOF {[Zn3L3(BPE)1.5]·4.5DMF}n (1, H2L = 4,4′-azoxydibenzoic 5 acid, BPE = bis(4-pyridyl)ethylene, DMF = N,N-dimethylformamide) functionalized with O− groups in which oxygen showed 99.27% significant binding with Pb2+ ions and 17.46% for cadmium adsorption. The maximum lead(II) adsorption was 616.64 mg g−1 owing to the strong electrostatic interaction between them, the activated negatively charged oxygen formed co-ordination bonds with lead. Also, being a Lewis acid, Pb2+ has a large ionic radius along with a low hydration energy which facilitates the formation of the acid–base adduct with the Lewis base O−. Monier and Abdel-Latif reported a cross-linked magnetic chitosan–phenylthiourea resin for the adsorption of Hg(II), Cd(II) and Zn(II) ions from aqueous solutions of 135 ± 3, 120 ± 1 and 52 ± 1 mg g−1 respectively.70 Sun et al. also made MOFs using a polydopamine composite which proved to have a strong affinity to the dopamine ligand for Pb2+ and Hg2+ ions with an adsorption capacity of 394 and 1634 mg g−1 respectively,43 however, these MOFs face purification issues after use. Again, Charpentier et al. succeeded in heavy metal removal using magnetic chitosan (CS) and carboxymethylchitosan (CMC) nanocomposites with an adsorption capacity for lead(II), copper(II), and zinc(II) of 243, 232 and 131 mg g−1 respectively.46 These literature surveys42,43,46,56,73,74 reveal that the –OH or –COOH functionality can bind lead ions in water. Keeping that in mind, we were interested to apply our material, NPLD, for Pb(II) removal. NPLD remarkably reduced the amount of lead ions (Pb2+) from 4000 to 7 ppb, which is below the permissible limit (10 μg L−1) set by the WHO. This excellent preliminary result was encouraged us to quantify the actual Pb2+ adsorption efficiency using our materials. Hence, we have explored the adsorption isotherm study to assess and quantify the effectiveness of NPLD for removing lead from water by varying the concentration of Pb2+ from 100 to 650 mg L−1 with the help of ICP-OES. The qe (equilibrium adsorption capacity) increased upon increasing the concentration of Pb2+ (Fig. 5). Langmuir models fitted the experimental isotherm equilibrium data with a high correlation coefficient of 0.9927 (Fig. 6). These values gave the best fit for the experimental data of the NPLD magnetic nanoparticles in the entire range of concentrations of Pb2+ that were studied. According to the Langmuir model, the adsorbent surface has a finite number of binding sites of identical energy and each adsorbate ion is located at a single site. The maximum adsorption capacity was calculated to be 1407.5 mg g−1 using the following equation.42
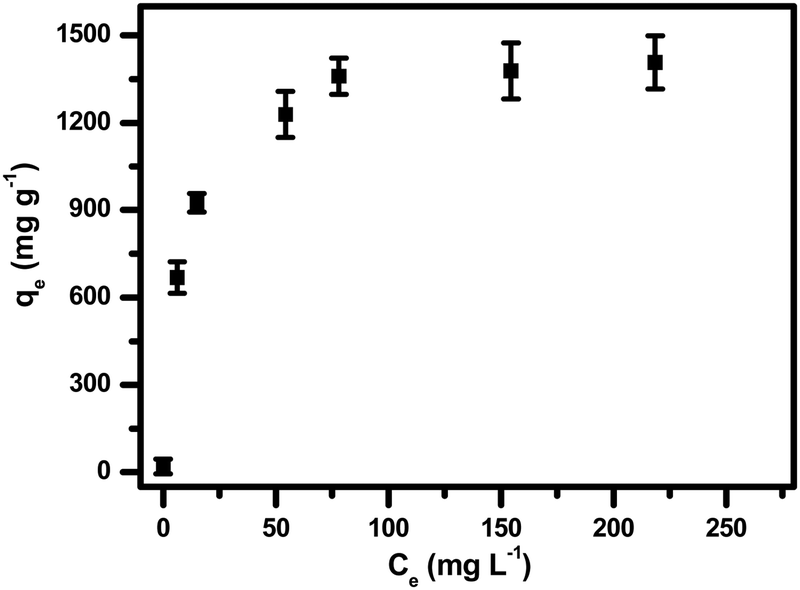 | ||
| Fig. 5 Adsorption isotherms of Pb(II), in which qe and Ce represent the amount of adsorbed Pb2+ (mg g−1) and the Pb(II) concentration in solution (mg L−1) at equilibrium. The value of qe increased with the increasing amount of Pb2+. | ||
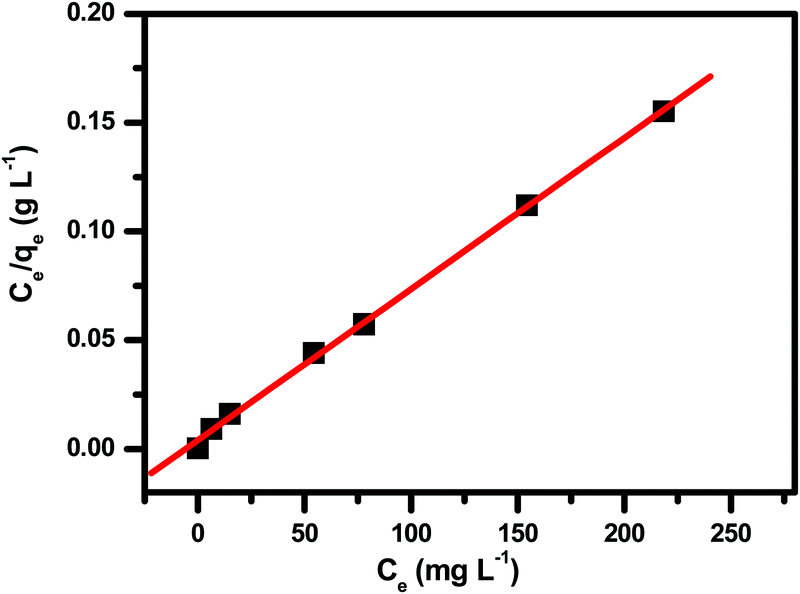 | ||
| Fig. 6 Langmuir adsorption fitting for the adsorption of Pb2+ by NPLD. | ||
Next, it was needed to determine how fast NPLD can take up Pb2+ from water and therefore we have performed a kinetic adsorption study75–77 for Pb(II). To determine the effectiveness of the NPLD nanomaterial for adsorbing lead with time, a kinetic adsorption isotherm of Pb(II) on NPLD was acquired using PbCl2 solution, in which the concentration of Pb2+ was 100 mg L−1.
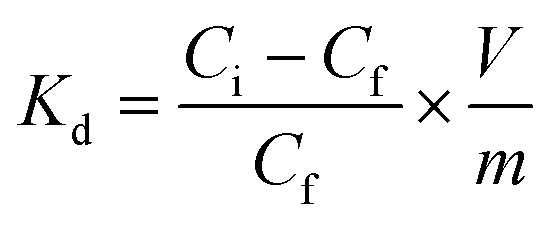
The incredibly fast uptake of lead ions by NPLD within 30 min of contact time, as represented in Fig. 7, shows the reduction from 100 to 3.675 ppm, which sets a new benchmark in the series of previously reported adsorbents, indicating its high surface area for adsorption. The unit measure of the affinity of a sorbent for a specific metal ion is the distribution coefficient (Kd) measurement:42,43,75–81
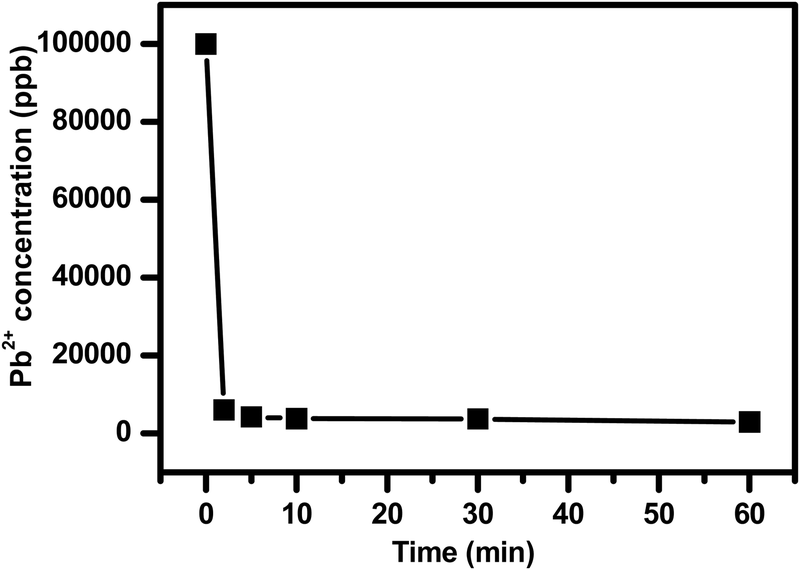 | ||
| Fig. 7 The kinetic adsorption study of the NPLD nanoparticles was measured, in which NPLD was 10 mg for a 10 mL Pb2+ solution having an initial concentration of 100 mg L−1 at room temperature. The graph shows that more than 90% of lead ions were adsorbed within 10 min and it reaches equilibrium within 30 min. | ||
| Entry | Adsorbent material | Adsorption capacity (mg g−1) of Pb2+ | Distribution coefficient (Kd) | Reference |
|---|---|---|---|---|
| 1 | CS and CMC magnetite nanoparticles | 243 | Not reported | 46 |
| 2 | Fe3O4–SO3H MNPs | 108.93 | Not reported | 48 |
| 3 | Fe3O4@GA-AAm | 158.73 | Not reported | 77 |
| 4 | L-Cys–Fe3O4NPs | 18.8 |
Not reported | 50 |
| 5 | MIL-101(Fe)/GO | 128.6 | Not reported | 78 |
| 6 | Three-dimensional (3D) porous framework {[Zn3L3(BPE)1.5]·4.5DMF}n functionalized with O– | 616.64 | 2.3 × 10⁶ mL g−1 | 42 |
| 7 | Graphene oxide–MnFe2O4 magnetic nanohybrids | 673 | Not reported | 49 |
| 8 | MoS4-LDH | 290 | Not reported | 79 |
| 9 | EDTA/chitosan/PMMS | 210 | Not reported | 80 |
| 10 | Fe-BTC/PDA MOF | 394 | 1.7 × 10⁶ mL g−1 | 43 |
| 11 | NPLD | 1407.5 | 1.14 × 10⁶ mL g−1 | This work |
Owing to the very high distribution coefficient and adsorption capacity of lead ions, we were interested in studying its selectivity among the alkaline earth metals and other coordination metals. Common cations such as Na+, K+, Mg2+ and Ca2+ exist ubiquitously in aquatic environments and may undergo competitive adsorption with Pb2+. Hence, a selective adsorption experiment was performed in the presence of Na+, K+, Mg2+, Cd2+, Zn2+ and Ca2+ with concentrations of 10 ppm for each metal ion.42,43 The results showed that the adsorption ability of NPLD was exceptionally higher for Pb2+ compared to other metal ions, and to some extent for Cd2+. In the presence of mixed (Na+, K+, Mg2+, Cd2+, Zn2+ and Ca2+) ions, 99.27% of Pb2+ was removed, whereas, 24.68% of Cd2+ was removed. In contrast, other metal ions, except for lead and cadmium, had a removal efficiency below 10%, as observed in Fig. 8a owing to their reduced electrostatic attraction with the NPLD magnetic nanoparticle. Common cations such Na+, K+, Mg2+ and Ca2+ that are present at a high concentration might lead to competitive adsorption with the Pb2+ ion, we have carried out a competitive experiment with molar ratios of Na+/Pb2+, K+/Pb2+, Ca2+/Pb2+, Mg2+/Pb2+, Zn2+/Pb2+, and Cd2+/Pb2+ at 1 and 50 (Fig. 8b). There was a minor decrease for Pb2+ removal efficiencies, changing from 99.83% to 96.27% with Na+, 99.63% to 96.38% with K+, 99.76% to 95.81% with Ca2+, 94.28% to 93.6% with Mg2+ and 94.28% to 93.6% with Zn2+. Removal efficiency was excellent when the molar ratio of Cd2+/Pb2+ was 1. When it was 50, the removal efficiency decreased to 53.42%. In a natural water environment, it is rare to find a high concentration of Cd2+. Therefore, the effect on the removal efficiency of Pb2+ by Cd2+ can be neglected for practical applications. This selectivity can be explained by the hard and soft (Lewis) acids and bases (HSAB) principle.42,81–83 Pb2+ is a borderline acid, whereas oxygen is a borderline base, hence interaction between them is very much compatible. Cd2+ is a soft acid and hence binds to oxygen to some extent, but hard acids such as Mg2+, Zn2+, and Ca2+ do not bind with oxygen owing to the less efficient pairing. The alkaline earth metal does not quite bind with NPLD. Soft Cd2+ has a comparable size and charge distribution and hence shows some amount of selectivity towards NPLD. The outstanding adsorption of Pb2+ by NPLD is a result of the electrostatic interaction, which is further supported by the zeta potential.42,60 The zeta potential of NPLD–Pb2+ is less negative in comparison to bare NPLD (Fig. S1, ESI†).
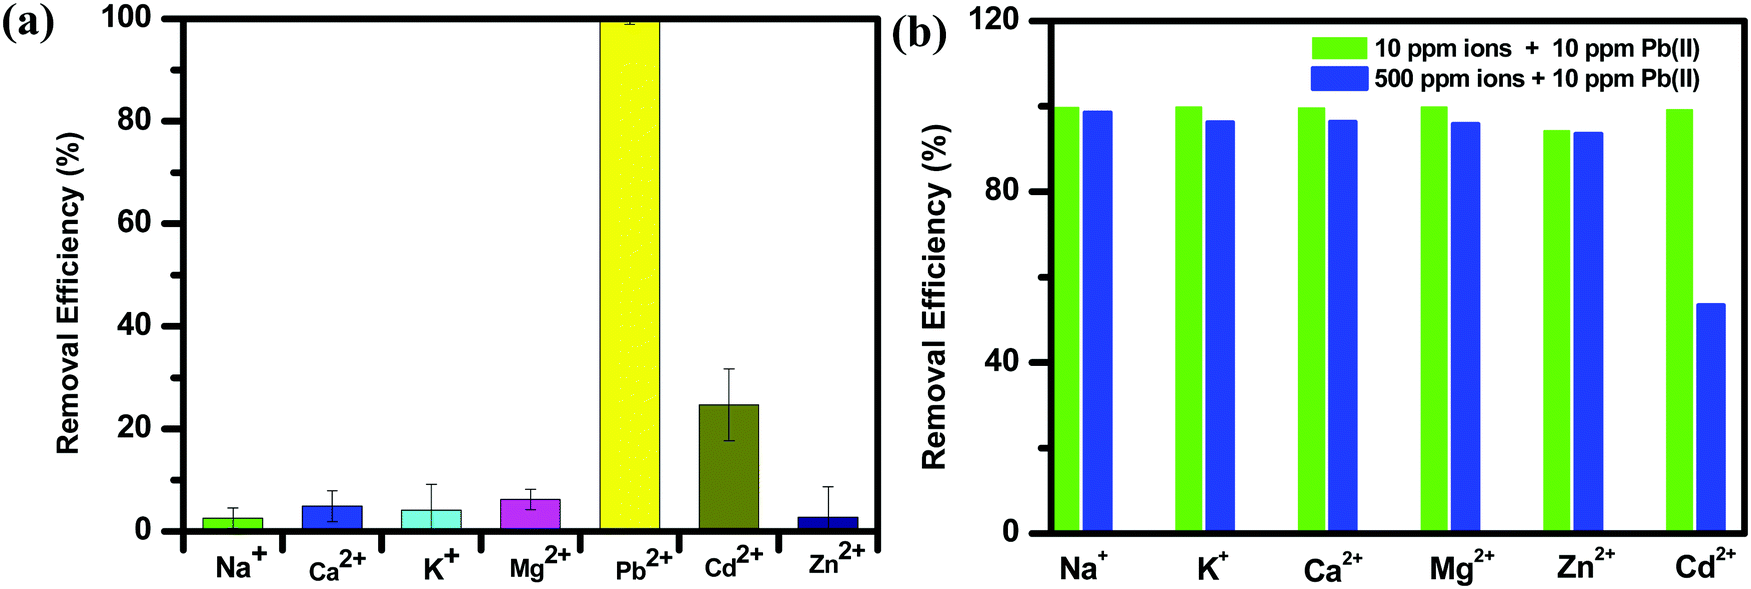 | ||
| Fig. 8 (a) Response of other coexisting different metal ions on the removal of Pb2+ ions, measured using ICP-OES. (b) The effects of competing ions on the Pb2+ adsorption by NPLD (Pb2+ concentration: 10 ppm; mixed ions concentration: a mixed solution containing Na+, K+, Ca2+, Mg2+, Zn2+ and Cd2+ with concentrations of 10 ppm and 500 ppm for each ion). | ||
The removal of lead can be detected by the naked eye if its concentration remains high in water. When an aqueous solution of Na2S was added to water containing Pb2+, the color immediately changed blackish owing to the formation of PbS, which enables us to confirm the presence or absence of lead(II) without any ICP measurement. We have also carried out the same experiment to track lead separation from water by treating lead contaminated water with NPLD. Fig. 9a shows the aqueous solution of Pb(II) just after dispersion of NPLD with different concentrations of Pb2+ ranging from high to low. Fig. 9b shows the solution after stirring for 30 min and then allowing to settle. It has been observed that after stirring with NPLD, the concentrated solution appeared to be clear, whereas excess NPLD remains visibly dispersed in the less concentrated solution of Pb2+, proving the effective binding of the nanoparticle with lead(II). This is because NPLD–Pb2+ complex gets heavier in case of high concentration of Pb2+ and is therefore settle down quickly in the presence of a magnetic bar. Now the same amount of Na2S solution was added to the same amount of the two solutions (one before treatment with NPLD and another after treatment with NPLD). The pure Pb2+ solution gave an instant black precipitate of lead sulphide, whereas the NPLD treated solution remained clear proving the reduction of the concentration of the Pb2+ ion using NPLD, as exhibited in Fig. 9c. We have further investigated the influence of pH on the adsorption and found that NPLD gave a fine adsorption of Pb2+ even at a very low pH (2) and this slightly increased upon increasing the pH to 8, the relative deprotonation became higher when the pH increased, which is represented in the bar plot given in Fig. S2 (ESI†). This high adsorption efficiency in a broad pH range proves that the material can be useful in industrial applications. For future applications we propose making of a cost efficient cartridge out of this material following magnetic separation technique. Furthermore, the regeneration studies are important from an industrial point of view in order to understand the reusability. The Pb2+ loaded NPLD was regenerated by collecting it with the assistance of a magnet and they were washed thoroughly using distilled water to remove any unabsorbed Pb2+, then 0.01 mol L−1 of a 20 mL EDTA solution was added, the solution was shaken mechanically for 24 h as reported previously43,46,73,74 and this was repeated four times. The nanoparticles were removed by magnetic separation and ICP-OES was used to investigate the reusability. The regenerated NPLD showed an excellent recyclability with a negligible loss of efficiency. Fig. S3 (ESI†) shows all four cycles and reveals that the recovery is more than 89%, meaning it is an excellent cost-efficient material for industrial use. Now it is highly desirable for a material that is to be used for practical applications to be non-toxic to cells. The toxicity of NPLD was evaluated using WI-38 fibroblasts cell.54,84–86 It was found that more than 90% cells were alive and healthy upon incubation of NPLD with WI-38 for 24 h (Fig. 10). Therefore NPLD will be a suitable candidate for future practical applications in making lead guards for water purifiers.
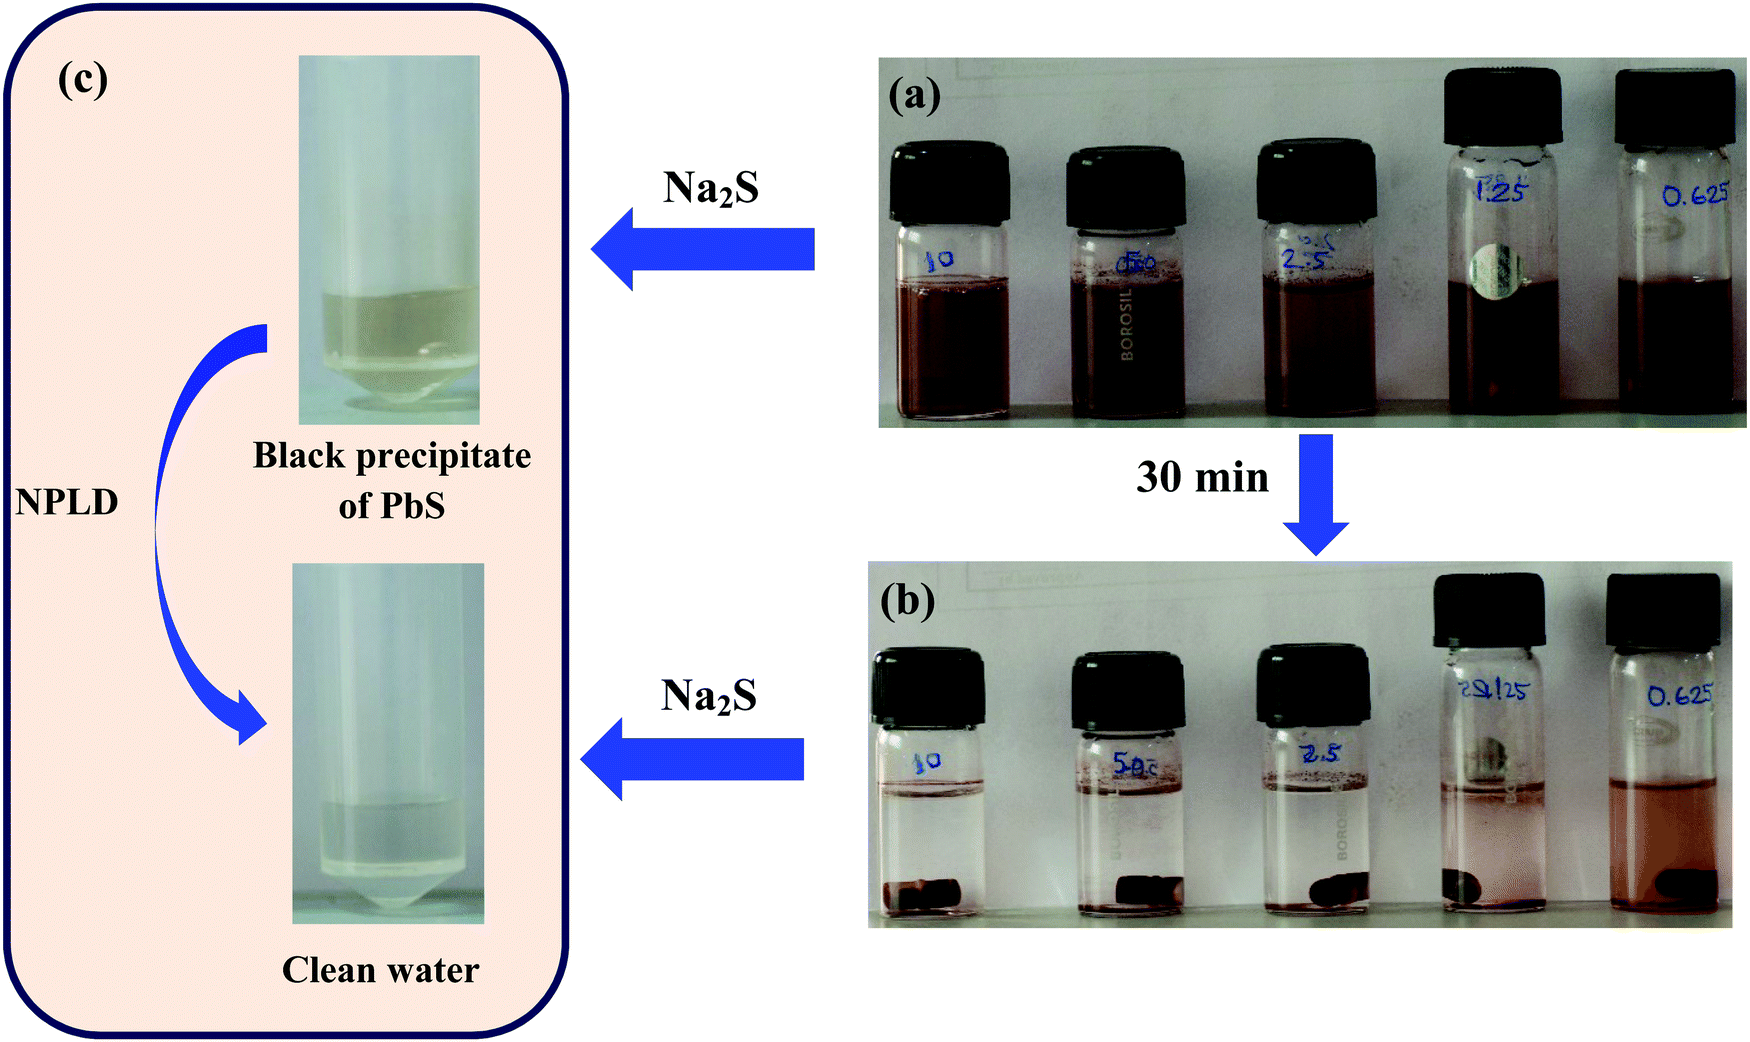 | ||
| Fig. 9 Images of adsorption for different concentrations of Pb(II) solutions by NPLD magnetic nanoparticles: (a) before and (b) after stirring with NPLD. Image (b) shows that higher interaction of NPLD with a high concentration of Pb(II), as indicated by magnetic removal in case of the far left vial. (c) Image taken after the addition of Na2S to the Pb(II) solution before and after treating the Pb(II) solution with NPLD, indicating there is no precipitation (PbS) in the solution that was treated with NPLD. | ||
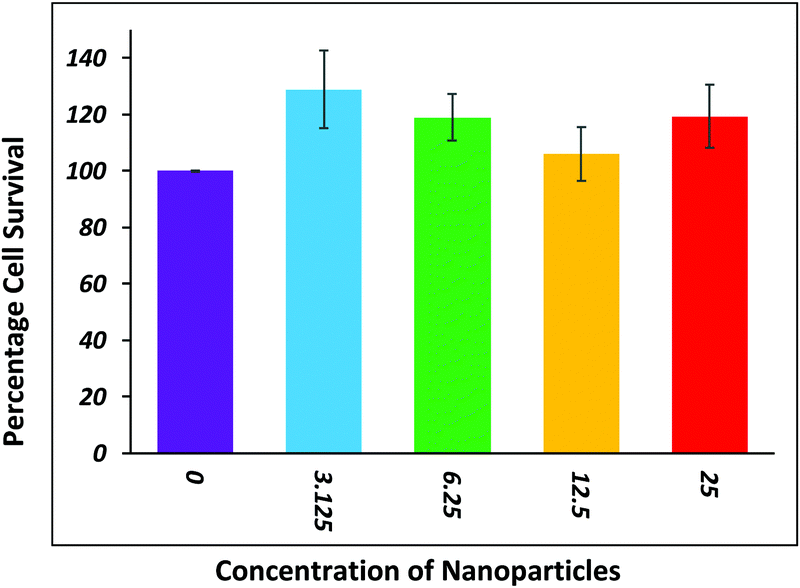 | ||
| Fig. 10 The effect of NPLD on WI-38 cell viability with varying concentrations of NPLD. | ||
Conclusion
Our skillfully engineered nanomaterial composed of PDI is a state-of-the-art material for use in the field of decontamination of lead from water owing to the presence of cost-efficient multifunctional perylene diimide with biocompatible L-DOPA at the imide position. The surface of the magnetic nano particles is coated with photostable and chemically inert rylene derivatives (perylene diimide). Owing to the presence of many hydroxyl and carboxyl groups on the surface of NPLD, it is highly dispersible in water and can capture lead selectively. The mode of application is pH independent and this material can withstand acid or basic harsh environments without affecting the adsorption of lead ions with a high adsorption capacity of 1407.5 mg g−1 and a Kd value of 1.14 × 10⁶ mL g−1. NPLD maintains its high adsorption capacity even upon regeneration and reuse. It is effective in the presence of high concentrations of background metal ions such as Na(I), K(I), Ca(II), Mg(II) and Zn(II). Our magnetic nanomaterial is non-toxic to normal cells, therefore it can be applied practically for making lead guards in water purifiers. The material has excellent future perspectives for application in industry for lead removal from water as giant reactors or cartridges can be prepared containing such nanomaterials, and which will have no separation issues after use as they can easily be separated out by simple magnetic attraction.Conflicts of interest
There are no conflicts to declare.Acknowledgements
Dr. P. K. Sukul acknowledges the DST INSPIRE Faculty project, Department of Science and Technology, Govt. of India (project no. DST/INSPIRE/04/2015/002584) for financial support. S. Dey acknowledges DST, Govt. of India for fellowship. Authors also acknowledge Calcutta University-University with Potential for Excellence (CU-UPE) for infrastructural support of Inductively Coupled Plasma Optical Emission Spectroscopy (ICP-OES). We are thankful to Prof. S. Malik (IACS Kolkata) for valuable discussions. We are immensely indebted to IACS Kolkata for use of the instrumental facilities.Notes and references
- T. Oki and S. Kanae, Science, 2006, 313, 1068–1072 CrossRef CAS PubMed.
- C. J. Vörösmarty, P. B. McIntyre, M. O. Gessner, D. Dudgeon, A. Prusevich, P. Green, S. Glidden, S. E. Bunn, C. A. Sullivan, C. R. Liermann and P. M. Davies, Nature, 2010, 467, 555–561 CrossRef PubMed.
- J. O. Nriagu and J. M. Pacyna, Nature, 1988, 333, 134–139 CrossRef CAS PubMed.
- M. Jaishankar, T. Tseten, N. Anbalagan, B. B. Mathew and K. N. Beeregowda, Interdiscip. Toxicol., 2014, 7, 60–72 Search PubMed.
- Human Lead Exposure, ed. H. L. Needleman, CRC Press, Boca Raton, FL, 1992 Search PubMed.
- D. R. Smith, M. W. Kahng, B. Quintanilla-Vega and B. A. Fowler, Chem.-Biol. Interact., 1998, 115, 39–52 CrossRef CAS.
- M. C. Carpenter, A. S. Shah, S. DeSilva, A. Gleaton, A. Su, B. Goundie, M. L. Croteau, M. J. Stevenson, D. E. Wilcox and R. N. Austin, Metallomics, 2016, 8, 605–617 RSC.
- M. Kirberger, H. C. Wong, J. Jiang and J. J. Yang, J. Inorg. Biochem., 2013, 125, 40–49 CrossRef CAS PubMed.
- E. Bitto, C. A. Bingan, G. E. Wesenberg, J. G. McCoy and G. N. Phillips, J. Biol. Chem., 2006, 281, 20521–20529 CrossRef CAS PubMed.
- C. C. Bridges and R. K. Zalups, Toxicol. Appl. Pharmacol., 2005, 204, 274–308 CrossRef CAS PubMed.
- N. Ballatori, Environ. Health Perspect., 2002, 110, 689–694 CrossRef CAS PubMed.
- S. N. Kelada, E. Shelton, R. B. Kaufmann and M. J. Khoury, Am. J. Epidemiol., 2001, 154, 1–13 CrossRef CAS PubMed.
- I. A. Bergdahl, A. Grubb, A. Schütz, R. J. Desnick, J. G. Wetmur, S. Sassa and S. Skerfving, Pharmacol. Toxicol., 1997, 81, 153–158 CrossRef CAS PubMed.
- F. M. Johnson, Mutat. Res., 1998, 410, 123–140 CAS.
- P. Apostoli, A. Bellini, S. Porru and L. Bisanti, Am. J. Ind. Med., 2000, 38, 310–315 CrossRef CAS PubMed.
- J. Bressler, K. Kim, T. Chakraborti and G. Goldstein, Neurochem. Res., 1999, 24, 595–600 CrossRef CAS PubMed.
- M. H. H. Price, Rep. Prep. Skeena Wild Conserv. Trust., 2013, 64, 9–36 Search PubMed.
- G. J. Atchison, M. G. Henry and M. B. Sandheinrich, Environ. Biol. Fishes, 1987, 18, 11–25 CrossRef.
- R. Srikanth, A. M. Rao, C. S. Kumar and A. Khanum, Bull. Environ. Contam. Toxicol., 1993, 50, 138–143 CrossRef CAS PubMed.
- N. L. Gale, C. D. Adams, B. G. Wixson, K. A. Loftin and Y. Huang, Environ. Geochem. Health, 2004, 26, 37–49 CrossRef CAS PubMed.
- J. E. Poldoski, E. N. Leonard, J. T. Fiandt, L. E. Anderson, G. F. Olson and G. E. Glass, J. Great Lakes Res., 1978, 4, 206–215 CrossRef CAS.
- C. Ingraham, This is How Toxic Flint's Water really is. https://www.washingtonpost.com/news/wonk/wp/2016/01/15/this-is-howtoxic-flints-waterreally-is/.
- M. B. Pell and J. Schneyer, Off the Charts: The thousands of U.S. locales where Lead Poisoning is worse than Flint. http://www.reuters.com/investigates/special-report/usa-lead-testing/, (accessed 2016).
- Maximum contaminant level goals and national primary drinking water regulations for lead and copper; Federal Register, 2010.
- WHO Guidelines for drinking-water quality, World Health Organization, 2005, pp. 104–108.
- M. Kumar and A. Puri, Indian J. Occup. Environ. Med., 2012, 16, 40–44 CrossRef PubMed.
- Lead-Environmental Aspects. Geneva, World Health Organization, Environmental Health Criteria 85, 1989.
- J. Liu, Y. Ma, T. Xu and G. Shao, J. Hazard. Mater., 2010, 178, 1021 CrossRef CAS PubMed.
- L. Jiang and P. Liu, Ind. Eng. Chem. Res., 2014, 53, 2924–2931 CrossRef CAS.
- G. Aragay, J. Pons and A. Merkoçi, Chem. Rev., 2011, 111, 3433–3458 CrossRef CAS PubMed.
- M. Khajeh, S. Laurent and K. Dastafkan, Chem. Rev., 2013, 113, 7728–7768 CrossRef CAS PubMed.
- M. Arbabi, S. Hemati and M. Amiri, Int. J. Epidemiol. Res., 2015, 2, 105–109 Search PubMed.
- A. P. Lim and A. Z. Aris, Rev. Environ. Sci. Biotechnol., 2014, 13, 163–181 CrossRef CAS.
- F. Fu and Q. Wang, J. Environ. Manage., 2011, 92, 407–418 CrossRef CAS PubMed.
- A. Shafaei, M. Rezayee, M. Arami and M. Nikazar, Desalination, 2010, 260, 23–28 CrossRef CAS.
- A. Khelifa, S. Moulay and A. W. Naceur, Desalination, 2005, 181, 27–33 CrossRef CAS.
- P. Vandezande, L. E. M. Gevers and I. F. J. Vankelecom, Chem. Soc. Rev., 2008, 37, 365–405 RSC.
- J. H. Huang, G. M. Zeng, C. F. Zhou, X. Li, L. J. Shi and S. B. He, J. Hazard. Mater., 2010, 183, 287–293 CrossRef CAS PubMed.
- J. Yuan, X. Liu, O. Akbulut, J. Hu, S. L. Suib, J. Kong and F. Stellacci, Nat. Nanotechnol., 2008, 3, 332–336 CrossRef CAS PubMed.
- X. Zhao, X. Bu, T. Wu, S. T. Zheng, L. Wang and P. Feng, Nat. Commun., 2013, 4, 2344 CrossRef PubMed.
- L. Li, S. Xiang, S. Cao, J. Zhang, G. Ouyang, L. Chen and C. Y. Su, Nat. Commun., 2013, 4, 1774 CrossRef PubMed.
- C. Yu, Z. Shao and H. Hou, Chem. Sci., 2017, 8, 7611–7619 RSC.
- D. T. Sun, L. Peng, W. S. Reeder, S. M. Moosavi, D. Tiana, D. K. Britt, E. Oveisi and W. L. Queen, ACS Cent. Sci., 2018, 4, 349–356 CrossRef CAS PubMed.
- X. Tan, H. Zhu, J. Yuan, W. Zhang, M. Fang and X. Wang, Environ. Sci.: Nano, 2019, 6, 261 RSC.
- C. Y. Cao, J. Qu, F. Wei, H. Liu and W. G. Song, ACS Appl. Mater. Interfaces, 2012, 4, 4283–4287 CrossRef CAS PubMed.
- T. V. J. Charpentier, A. Neville, J. L. Lanigan, R. Barker, M. J. Smith and T. Richardson, ACS Omega, 2016, 1, 77–83 CrossRef CAS PubMed.
- K. A. López, M. N. Piña, D. Quiñonero, P. Ballester and J. Morey, J. Mater. Chem. A, 2014, 2, 8796–8803 RSC.
- K. Chen, J. He, Y. Li, X. Cai, K. Zhang, T. Liu, Y. Hu, D. Lin, L. Kong and J. Liu, J. Colloid Interface Sci., 2017, 494, 307–316 CrossRef CAS PubMed.
- S. Kumar, R. R. Nair, P. B. Pillai, S. N. Gupta, M. A. R. Iyengar and A. K. Sood, ACS Appl. Mater. Interfaces, 2004, 6, 17426–17436 CrossRef PubMed.
- Y. Bagbi, A. Sarswat, D. Mohan, A. Pandey and P. R. Solanki, Sci. Rep., 2017, 7, 7672 CrossRef PubMed.
- D. Görl, X. Zhang and F. Würthner, Angew. Chem., Int. Ed., 2012, 51, 2–23 CrossRef PubMed.
- M. Sun, K. Müllen and M. Yin, Chem. Soc. Rev., 2016, 45, 1513–1528 RSC.
- E. Krieg, H. Weissman, E. Shirman, E. Shimoni and B. A. Rybtchinski, Nat. Nanotechnol., 2011, 6, 141–146 CrossRef CAS PubMed.
- F. Liu, J. Mu, X. Wu, S. Bhattacharya, E. K. L. Yeow and B. Xing, Chem. Commun., 2014, 50, 6200–6203 RSC.
- Z. Luo, T. Liu, Z. Chen, Y. Xiao, G. Zhang, L. Huo, C. Zhong, X. Lu, H. Yan, Y. Sun and C. Yang, Adv. Sci., 2019, 6, 1802065 CrossRef PubMed.
- A. Zhang, W. Jiang and Z. Wang, Angew. Chem., Int. Ed., 2020, 59, 752–757 CrossRef CAS PubMed.
- B. Liu, M. Böckmann, W. Jiang, N. L. Doltsinis and Z. Wang, J. Am. Chem. Soc., 2020, 142, 7092–7099 CrossRef CAS PubMed.
- F. Würthner, C. R. Saha-Möller, B. Fimmel, S. Ogi, P. Leowanawat and D. Schmidt, Chem. Rev., 2016, 116, 962–1052 CrossRef PubMed.
- R. M. Pinder, Nature, 1970, 228, 358 CrossRef CAS PubMed.
- Q. Zhang, Q. Yang, P. Phanlavong, Y. Li, Z. Wang, T. Jiao and Q. Peng, ACS Sustainable Chem. Eng., 2017, 5, 4161–4170 CrossRef CAS.
- C. Huang, S. Barlow and S. R. Marder, J. Org. Chem., 2011, 76, 2386–2407 CrossRef CAS PubMed.
- P. K. Sukul, D. Asthana, P. Mukhopadhyay, D. Summa, L. Muccioli, C. Zannoni, D. Beljonne, A. E. Rowan and S. Malik, Chem. Commun., 2011, 47, 11858 RSC.
- W. Herbst and K. Hunger, Industrial Organic Pigents, Wiley-VCH, Weinheim, 2nd completely revised edn, 1997 Search PubMed.
- L. Guo, Q. Liu, G. Li, J. Shi, J. Liu, T. Wang and G. A. Jiang, Nanoscale, 2012, 4, 5864–5867 RSC.
- L. J. Bellamy, The Infrared Spectra of Complex Molecules, Wiley, 1958 Search PubMed.
- L. Kong, L. Yan, Z. Qu, N. Yan and L. Li, J. Mater. Chem. A, 2015, 3, 15755–15763 RSC.
- G. M. Sheldrick, SHELXS-97 and SHELXL-97, Program for X-ray Crystal Structure Solution, University of Göettingen, Germany, 1997 Search PubMed.
- P. Gong, J. Yu, H. Sun, J. Hong, S. Zhao, D. Xu and S. Yao, J. Appl. Polym. Sci., 2006, 101, 1283–1290 CrossRef CAS.
- S. Thanikaikarasan, T. Mahalingam, K. Sundaram, A. Kathalingam, Y. Deak Kim and T. Kim, Vacuum, 2009, 83, 1066–1072 CrossRef CAS.
- M. Monier and D. A. Abdel-Latif, J. Hazard. Mater., 2012, 209, 240–249 CrossRef PubMed.
- Y. F. Lin, H. W. Chen, P. S. Chien, C. S. Chiou and C. C. Liu, J. Hazard. Mater., 2011, 185, 1124–1130 CrossRef CAS PubMed.
- M. R. Huang, Q. Y. Peng and X. G. Li, Chem. – Eur. J., 2006, 12, 4341–4350 CrossRef CAS PubMed.
- C. S. Kam, T. L. Leung, F. Liu, A. B. Djurišić, M. H. Xie, W. K. Chan and K. Shih, RSC Adv., 2018, 8, 18355–18362 RSC.
- Y. L. F. Musico, C. M. Santos, M. L. P. Dalida and D. F. Rodrigues, J. Mater. Chem. A, 2013, 1, 3789 RSC.
- Y. S. Ho and G. McKay, Chem. Eng. J., 1998, 70, 115–124 CrossRef CAS.
- Y. Shin, G. E. Fryxell, W. Um, K. Parker, S. V. Mattigod and R. Skaggs, Adv. Funct. Mater., 2007, 17, 2897–2901 CrossRef CAS.
- A. Moradi, P. N. Moghadam, R. Hasanzadeh and M. Sillanpää, RSC Adv., 2017, 7, 433–448 RSC.
- M. Lu, L. Li, S. Shen, D. Chen and W. Han, New J. Chem., 2019, 43, 1032 RSC.
- L. Ma, Q. Wang, S. M. Islam, Y. Liu, S. Ma and M. G. Kanatzidis, J. Am. Chem. Soc., 2016, 138, 2858–2866 CrossRef CAS PubMed.
- Z. Tan, H. Peng, H. Liu, L. Wang, J. Chen and X. Lu, J. Appl. Polym. Sci., 2015, 132, 4238 Search PubMed.
- R. G. Pearson, J. Am. Chem. Soc., 1963, 85, 3533–3539 CrossRef CAS.
- M. L. Feng, D. Sarma, X. H. Qi, K. Z. Du, X. Y. Huang and M. G. Kanatzidis, J. Am. Chem. Soc., 2016, 138, 12578–12585 CrossRef CAS PubMed.
- L. Zeng, Y. Chen, Q. Zhang, X. Guo, Y. Peng, H. Xiao, X. Chen and J. Luo, Carbohydr. Polym., 2015, 130, 333–343 CrossRef CAS PubMed.
- J. McCarthy and R. Weissleder, Adv. Drug Delivery Rev., 2008, 60, 1241–1251 CrossRef CAS PubMed.
- H. A. Kahil, Rom. J. Biophys., 2020, 30, 39–48 Search PubMed.
- A. Kumar, P. K. Jena, S. Behera, R. F. Lockey, S. Mohapatra and S. Mohapatra, Nanomedicine, 2010, 6, 64–69 CrossRef CAS PubMed.
Footnote |
| † Electronic supplementary information (ESI) available: Zeta potential, pH dependent adsorption efficiency, and reusability of nanoparticle measurements. See DOI: 10.1039/d0ma00477d |
| This journal is © The Royal Society of Chemistry 2020 |