DOI:
10.1039/D0MA00448K
(Paper)
Mater. Adv., 2020,
1, 3009-3021
Nitrogen and sulfur co-doped fluorescent carbon dots for the trapping of Hg(II) ions from water†
Received
24th June 2020
, Accepted 21st October 2020
First published on 24th October 2020
Abstract
An uncomplicated, reliable, and ultrasensitive fluorescent sensor motif based on carbon dots (CDs) co-doped with nitrogen and sulfur atoms has been fabricated using calix[4]arene and benzothiazole moieties for the recognition of toxic mercuric ions (Hg2+) in aqueous medium and the application has been established in Tris–HCl buffer solution, real water samples, and the trapping of Hg2+ ions from aqueous medium. It was observed that the fluorescence intensity of the as-synthesized CDs could be entirely quenched in the presence of Hg2+ ions due to the electron/energy transfer process between the surface functional groups of the CDs and soft closed-shell Hg2+ ions. The proposed nanosensor could proficiently detect Hg2+ ions in aqueous medium with a detection limit of the order of 7.89 nM with high selectivity, sensitivity, and with a relatively low background interference even in a complex medium. The CDs were then further adsorbed on the surface of silica and were investigated for their ability to trap/capture Hg2+ ions using chromogenic and atomic absorption spectroscopy (AAS) method.
Introduction
Having simply identified the detrimental effects of heavy metal (HMs) ions, particularly mercury ions, have not completely prevented the widespread use of mercury salts and organomercury compounds. Industries (oil refining, wood pulping fossil fuel combustion, rubber processing, coal, and gold mining) and anthropological activities involving the use of fossil fuels and agricultural lands exposed to mercury-based fertilizers are conscious acts of humans, which are responsible for the serious ailments prevalent in living beings and adverse effects on the environment due to the high toxicity and bioaccumulation ability of these HMs.1,2 Among various HMs, mercury has long been documented as one of the most toxic HMs and is known to cause serious diseases in human body such as organ failure, prenatal brain damage, cognitive disorder, dysfunctioning of the central nervous system (CNS), and Minamata disease when accumulated in the food chain through various environmental sources.3–5 The use of mercury in the form of medicines such as mercurochrome, vaccines containing thiomersal, and dental amalgams containing up to 40% of mercury are very common.8 Mercury is highly toxic irrespective of the oxidation state; however, Hg2+ is the most widespread and stable from of the pollutant present in the environment. In order to trap Hg2+ ions from the environment, various novel detection strategies have been developed for the selective and sensitive detection of Hg2+ ions. These methodologies, aiming at high sensitivity, selectivity and uncomplicated sample handling, include fluorescent chemosensors, metal–organic frameworks, and porous materials.9–11 Various methods employed for the detection of Hg2+ ions with detection limits as low as of the order of nM to pM include atomic absorption spectroscopy (AAS), inductively coupled plasma-mass spectrometry (ICP-MS), cold vapor-atomic fluorescence spectroscopy (CV-AFS), as well as electrochemical and optical techniques.12–15 Among all these methods, fluorescent chemosensors have provided a sensitive and efficient analytical method for the ultrasensitive detection of Hg2+ ions. However, the major drawback of these methods is that the proposed technique can either detect a particular metal ion sensitively or scavenge the metal ions separately, thus limiting their practical applications.1,16 In addition to this, these proposed techniques display other shortcomings including low sensitivity and selectivity, high-cost operations, need of sample pre-treatment, and interference from other toxic metal ions, which makes the commercial use of these techniques difficult.17,18 Hence, an ingenuous, prompt, highly selective, and inexpensive method for the detection and scavenging of Hg2+ ions is required. Through literature findings, it is known that sulfur groups, due to their π-donating ability, hold obvious affinity towards Hg2+ ions.6,7 Hg2+ ions, owing to their filled d10 electronic configuration, are spectroscopically and magnetically silent and have an induced spin–orbit coupling effect, leading to quenching in the fluorescent signals.19 The detection of Hg2+ ions using NMR and EPR (electron paramagnetic resonance) techniques is not favored and optical detection techniques could be employed as they are simple, time-saving, reliable, and highly sensitive, offering real-time advantages as well as scrutinizing the in situ dynamic biological processes in living cells.20 Also, novel strategies for the development of fluorescent chemosensors for the selective detection of Hg2+ ions in aqueous or semi-aqueous medium are at an early stage.18,21
On account of the remarkable properties of carbon quantum dots (CDs), such as their great resistance to photo-bleaching, strong chemical inertness, less toxicity, excellent water solubility, and decent cost and biocompatibility, they have enticed the research community to explore their applications in the fields of bio-imaging, drug delivery, sensors, and optoelectronic devices.22,23 Also, CDs are an excellent alternative to heavy metal-based semiconductor quantum dots due to their low toxicity, high photostability, and colorful photoluminescence.24 In addition to these, there are many other attributes of CDs over conventional semiconductor quantum dots such as benign chemical composition, simplistic functionalization, exceptional physicochemical stability, and tunable fluorescence emission. Accompanied by other benefits such as low cost and ease of synthesis, CDs are in a promising position for achieving exceptional performance in a diverse range of applications as mentioned above.25 Low quantum yield, complex separation procedures, purification, and ambiguity in their geometry, structure, and composition of most of the reported CDs is still an area that needs to be addressed in order to widen its applications.26 Among various bicyclic ring systems, benzothiazole is a well-known system with marked applications in biological and luminescent materials owing to its remarkable anticancer and antimicrobial properties.27 In the literature, vast studies have been performed with a range of derivatives of benzothiazole to explore its application in the field of luminescent materials owing to its ability to generate UV-visible as well as fluorescent signals as a dual-channel probe.28,29 Bearing in mind the utmost significance of the development of a selective and sensitive fluorescent probe for the detection of Hg2+ ions, a novel sensor motif based on calix[4]arene modified with the benzothiazole moiety was developed. The calix[4]arene derivative was then employed to develop CDs using hydrothermal reaction and it was shown to exhibit a fluorescence “turn-off” response in the semi-aqueous medium towards Hg2+ ions (5 mM; Tris–HCl buffer pH 7.4; DMSO/H2O 1![[thin space (1/6-em)]](https://www.rsc.org/images/entities/char_2009.gif) :2, v/v). The probe was shown to exhibit negligible cytotoxicity, high resistance to photo-bleaching, and outstanding biocompatibility. The probe was then utilized to detect Hg2+ ions in real samples collected from different sources with a percentage recovery as good as 96–100.9%. In addition to this, AAS and the chromogenic method were further employed to determine the Hg2+ ions passed down through the column containing CDs adsorbed on the silica mesh. Traditionally, adsorption-based remediation involves the elimination of contaminants from water with the benefits of minimal water wastage and higher energy efficiency. Various adsorbent materials such as carbon-based materials, metal oxides, metal–organic-frameworks, and polymers, having a large surface area, appropriate pore/cavity size, and suitable binding sites have been employed.30 In this work, we have employed CDs adsorbed on the surface of silica for trapping toxic Hg2+ ions in the aqueous medium. The CDs were characterized using SEM technique and known concentrations of Hg2+ ions were passed through the column under pressure and a controlled flow rate. The results were then compared with a standard method employing dithizone as a metal chelator in aqueous medium. AAS technique was also employed among various analytical techniques reported for the speciation of Hg2+ ions. Chromatographic separation techniques such as high performance liquid chromatography (HPLC) and gas chromatography (GC) in combination with some spectroscopic technique are commonly used; however, these suffer from some disadvantages, for example, the Hg2+ species is required to be converted to a volatile compound before use.31 Hence, we have employed the AAS technique, in which the Hg2+ ions can be determined in the aqueous medium without any prior requirement of pre-conversion to a volatile phase.
:2, v/v). The probe was shown to exhibit negligible cytotoxicity, high resistance to photo-bleaching, and outstanding biocompatibility. The probe was then utilized to detect Hg2+ ions in real samples collected from different sources with a percentage recovery as good as 96–100.9%. In addition to this, AAS and the chromogenic method were further employed to determine the Hg2+ ions passed down through the column containing CDs adsorbed on the silica mesh. Traditionally, adsorption-based remediation involves the elimination of contaminants from water with the benefits of minimal water wastage and higher energy efficiency. Various adsorbent materials such as carbon-based materials, metal oxides, metal–organic-frameworks, and polymers, having a large surface area, appropriate pore/cavity size, and suitable binding sites have been employed.30 In this work, we have employed CDs adsorbed on the surface of silica for trapping toxic Hg2+ ions in the aqueous medium. The CDs were characterized using SEM technique and known concentrations of Hg2+ ions were passed through the column under pressure and a controlled flow rate. The results were then compared with a standard method employing dithizone as a metal chelator in aqueous medium. AAS technique was also employed among various analytical techniques reported for the speciation of Hg2+ ions. Chromatographic separation techniques such as high performance liquid chromatography (HPLC) and gas chromatography (GC) in combination with some spectroscopic technique are commonly used; however, these suffer from some disadvantages, for example, the Hg2+ species is required to be converted to a volatile compound before use.31 Hence, we have employed the AAS technique, in which the Hg2+ ions can be determined in the aqueous medium without any prior requirement of pre-conversion to a volatile phase.
Experimental section
Materials
p-tert-Butyl phenol, formaldehyde (37%), NaOH, K2CO3, 1,2-dibromoethane, p-hydroxy benzaldehyde, 2-(1H-benzo[d]imidazol-2-yl)aniline, dithizone, and Hg(NO3)2·H2O were procured from Sigma-Aldrich and were used without further purification. Sodium dodecyl sulfate (SDS) and silica were purchased from SD Fine Chemicals. Solvents such as diphenyl ether, toluene, acetone, acetonitrile, chloroform, and DMSO were also obtained from SD Fine Chemicals and used as obtained. Deionised water (type-II) was used throughout the experiments and was obtained from a Millipore Water Purification System.
Instrumentation
1H NMR and 13C NMR spectra were recorded on an Avance-II (Bruker) instrument operated at 400 MHz for 1H NMR and at 100 MHz for 13C NMR. The chemical shifts were recorded in ppm relative to trimethylsilane as the internal reference. The mass spectra were recorded on a Waters Micromass Q-Tof Micro instrument in the range of 4000 amu in quadruple and 20000 amu in ToF mode. High Resolution Transmission Electron Microscopy (HR-TEM) was achieved on an FEI-TECNAI G2F-20 electron microscope. Fourier transform infrared spectroscopy (FTIR) was performed on a NICOLET iS50 FT-IR spectrophotometer from ThermoScientific in the range of 400–4000 cm−1. The zeta potential was recorded on a modular dynamic light scattering system by Microtrac. The UV-visible absorption studies were carried out on a JASCO V-770 spectrophotometer and the fluorescence emission profiles were recorded on a RF-5301 PC spectrofluorophotometer by Shimadzu at room temperature with a fixed scanning speed and an emission slit width.
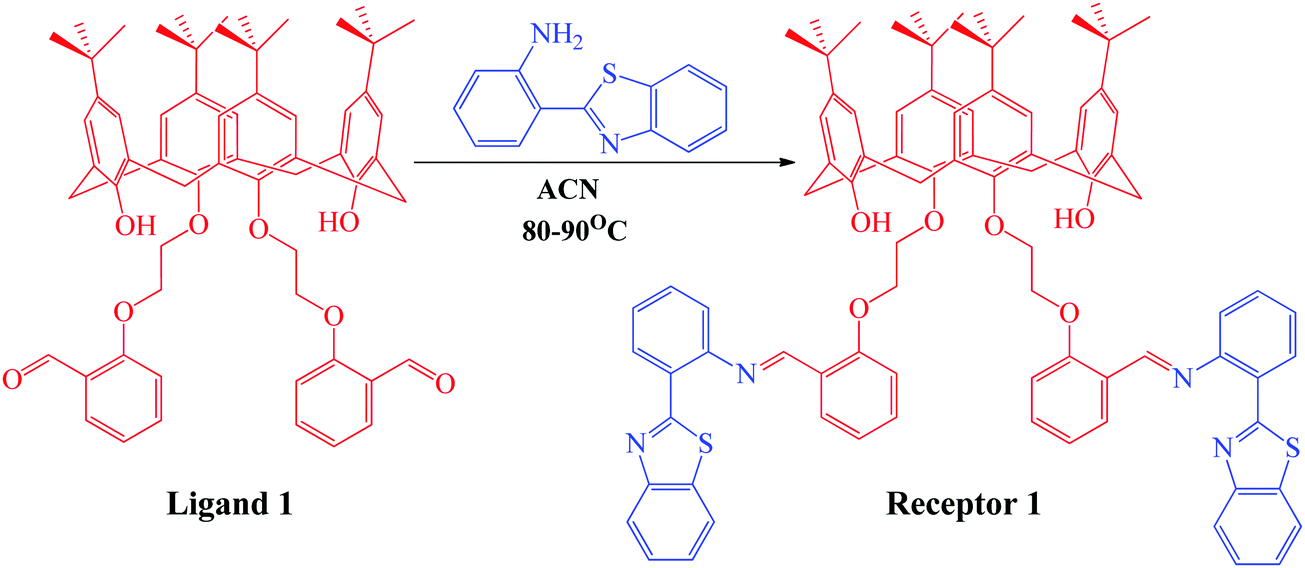
Synthesis of the organic receptor
The organic receptor was synthesized using condensation reaction at reflux conditions between the calix[4]arene derivative and 2-(1H-benzo[d]imidazol-2-yl)aniline in ACN for 16 hours. The calix[4]arene derivative (ligand 1) was first synthesized using a reported method32 and was then condensed with 3 equivalents of 2-(1H-benzo[d]imidazol-2-yl)aniline in ACN solvent for 16 hours to obtain receptor 1, as depicted in Scheme 1. The progress of the reaction was monitored using thin layer chromatography. The product thus obtained was purified by washing with methanol multiple times and was characterized using 1H NMR, 13C NMR, mass spectroscopy (Fig. S1–S3, ESI†), and CHN analysis. The yield of the green colored product was calculated to be 87% (1.23 g) and the texture was powdery. The melting point was measured to be 165–167 °C. 1H NMR (CDCl3, 400 MHz): TMS reference (δ ppm): 1.05 (s, 6H, –CH3), 1.29 (s, 6H, –CH3), 3.2 (s, 4H, –CH2), 3.31 (s, 4H, –CH2), 4.19 (t, 4H, –CH2), 4.38 (t, 4H, –CH2), 6.38 (s, 2H, OH), 6.79 (s, 4H, Ar-H), 6.84 (s, 4H, Ar-H), 6.85 (m, 2H, Ar-H), 6.9 (d, 2H, Ar-H), 7.2 (m, 2H, Ar-H), 7.32 (m, 2H, Ar-H), 7.45 (d, 2H, Ar-H), 7.71 (d, 2H, Ar-H), 7.85 (d, 2H, Ar-H), 7.98 (d, 2H, Ar-H), 8.46 (d, 2H, Ar-H), 8.58 (d, 2H, Ar-H), and 9.31 (s, 1H, ![[double bond, length as m-dash]](https://www.rsc.org/images/entities/char_e001.gif) CH). 13C NMR (CDCl3, 400 MHz): TMS reference (δ ppm): 32, 33, 33.7, 70.2, 72.1, 117, 119.2, 122, 123.4, 124.5, 125.1, 125.7, 126, 126.3, 127.5, 130.4, 132.2, 133, 133.6, 137.6, 142.3, 147.2, 150, 151.4, 155, 157.2, 159.1, and 168. Elemental composition: found: C, 77.12; H, 6.98; O, 6.90; N, 4.52; S, 4.48. Calculated for C88H88N4O6S2: C, 77.61; H, 6.51; N, 4.1; O, 7.05; S, 4.71.
CH). 13C NMR (CDCl3, 400 MHz): TMS reference (δ ppm): 32, 33, 33.7, 70.2, 72.1, 117, 119.2, 122, 123.4, 124.5, 125.1, 125.7, 126, 126.3, 127.5, 130.4, 132.2, 133, 133.6, 137.6, 142.3, 147.2, 150, 151.4, 155, 157.2, 159.1, and 168. Elemental composition: found: C, 77.12; H, 6.98; O, 6.90; N, 4.52; S, 4.48. Calculated for C88H88N4O6S2: C, 77.61; H, 6.51; N, 4.1; O, 7.05; S, 4.71.
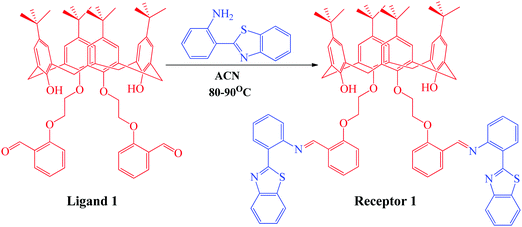 |
| | Scheme 1 Synthetic scheme showing the synthesis of receptor 1 from 2-(1H-benzo[d]imidazol-2-yl)aniline and ligand 1 previously synthesized using the reported methodology. | |
Synthesis of CDs
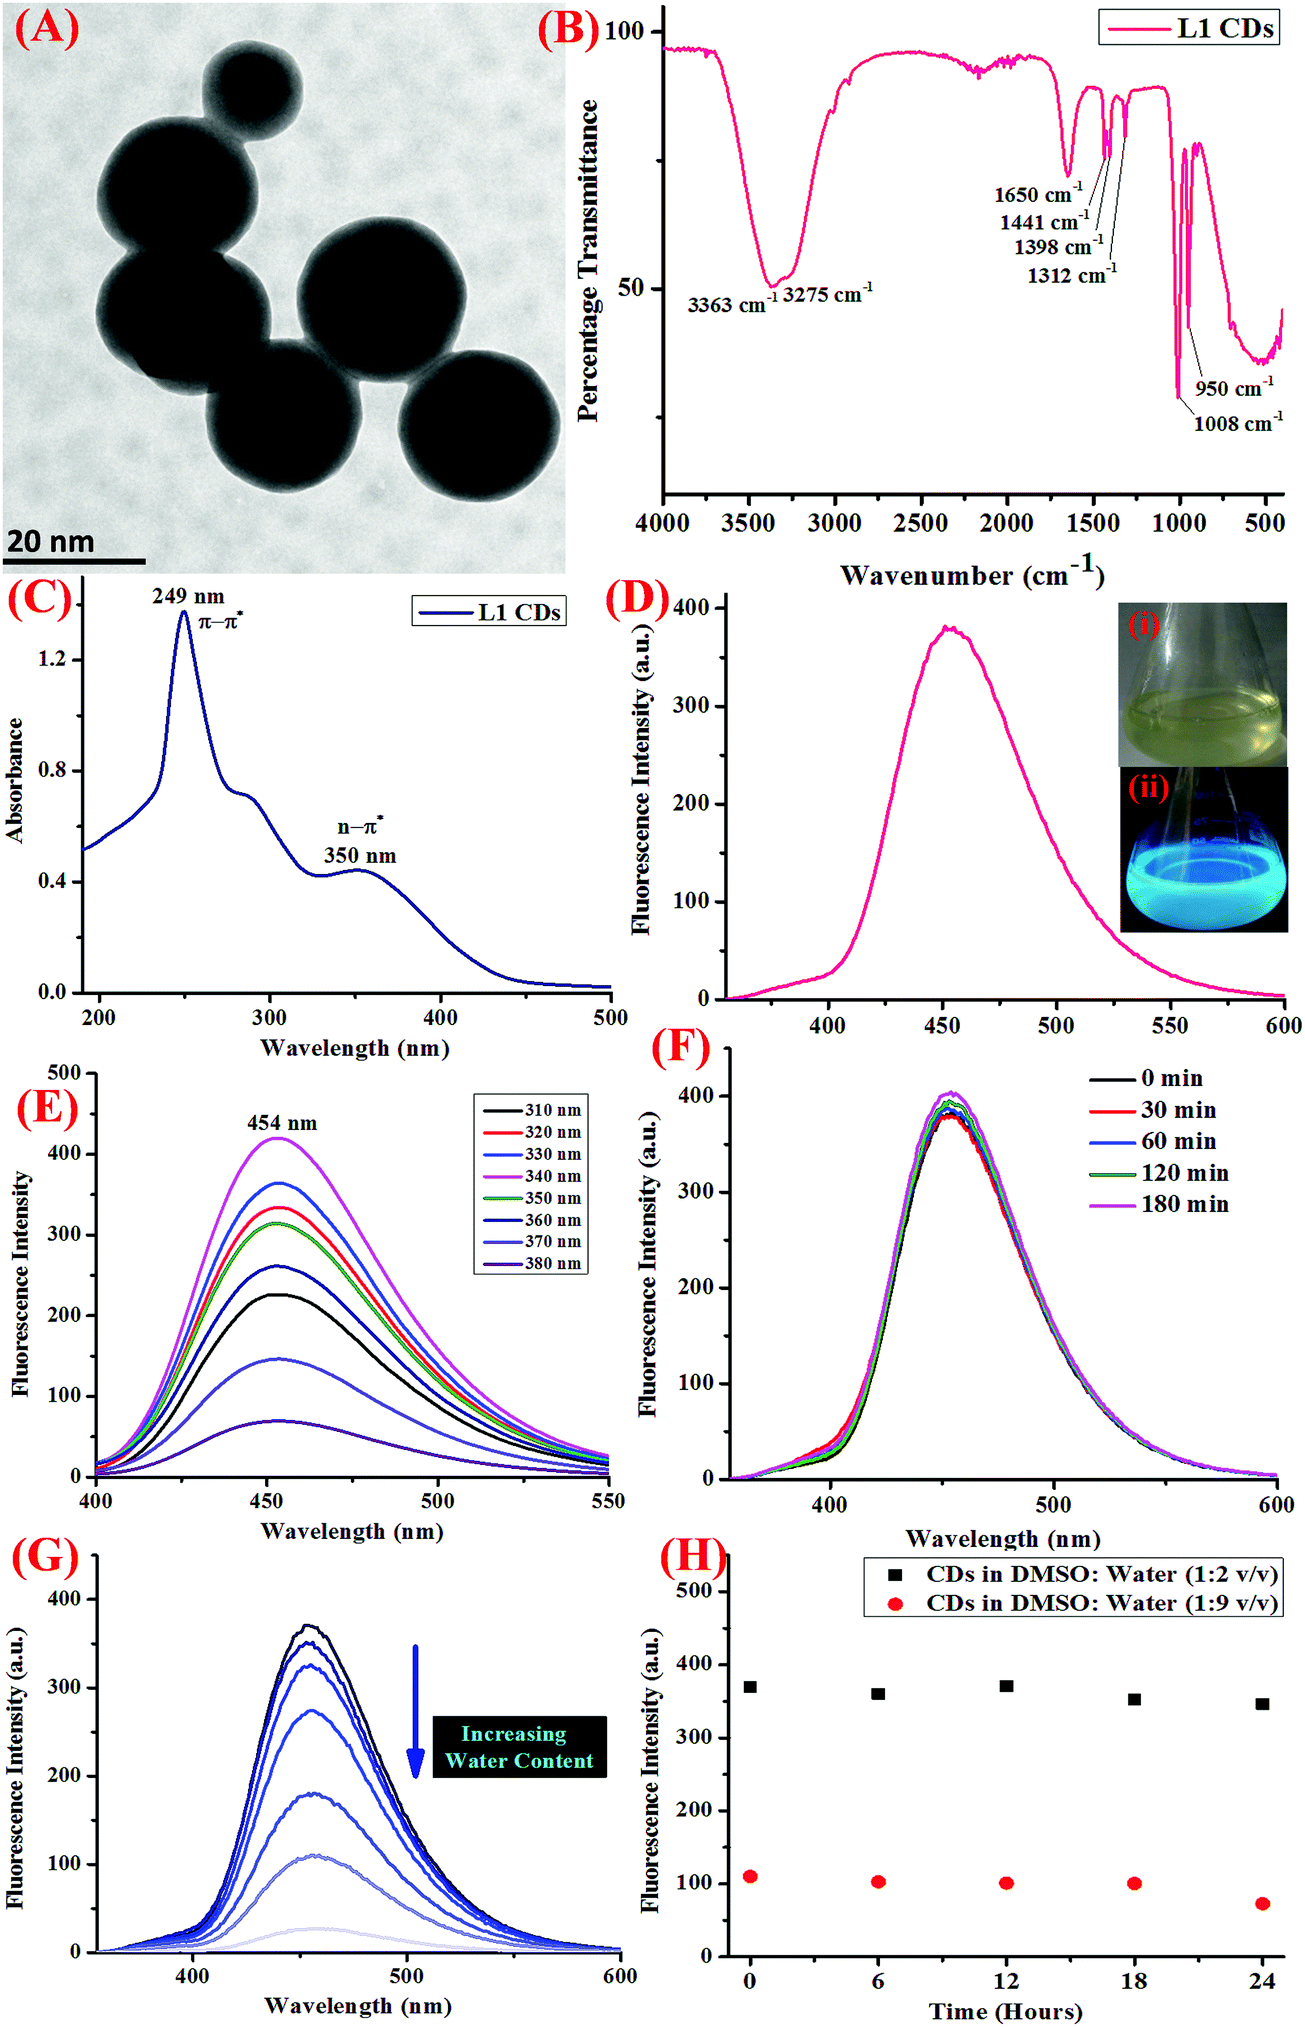
The CDs were synthesized employing a well-known non-toxic, economic, and eco-friendly hydrothermal carbonization reaction.33 For this, an organic precursor was dissolved in a suitable solvent (high boiling) and was then sealed and reacted in a hydrothermal reactor generally at a very high temperature and pressure for a few hours. The reaction mixture was then allowed to cool to room temperature and then purified using centrifugation and dialysis. Herein, we employed a reported methodology for the synthesis of CDs from an organic receptor, which was synthesized as discussed above. The ligand was dissolved in 5 mL of DMSO (0.5 mmol) by heating at 40–50 °C and was then transferred to a Teflon reaction vessel. De-ionized H2O (15 mL) was then added to the same and the vessel was sealed. The autoclave containing the vessel was kept in an oven for 12 hours at 180 °C to obtain the fluorescent CDs. After 12 hours, the autoclave was allowed to cool to room temperature on a heat-resistant plate and the CDs were filtered using a 0.22 μm membrane filter to remove any undesirable reaction precursors. The material was then freeze-dried and purified using centrifugation and dialysis. Under UV irradiation of 365 nm, blue colored fluorescence was observed. The final product was characterized using high-resolution transmission electron microscopy (HR-TEM), Fourier transform infra-red (FTIR) spectroscopy, and UV-visible and fluorescence spectroscopy, confirming the formation of optimum-sized, mono-dispersed CDs in a semi-aqueous medium.
Photophysical properties
Absorption and fluorescence assay of Hg2+ ions.
Using UV-visible and fluorescence spectroscopic techniques, the photophysical properties of the CDs thus obtained were evaluated. The detection of Hg2+ ions was performed in the Tris–HCl buffer (5 mM, pH 7.4) at 25 ± 2 °C. All the experiments were conducted in triplicate. The UV-vis absorption profile of the as-synthesized CDs showed absorption peaks at 249 and 350 nm, which are accountable to the π–π* and n–π* transitions (Fig. 1C). When excited at 340 nm, the emission profile of the same showed an emission peak at 454 nm (Fig. 1D) and the emission profile displayed excitation wavelength-independent fluorescence in the blue region (Fig. 1E).
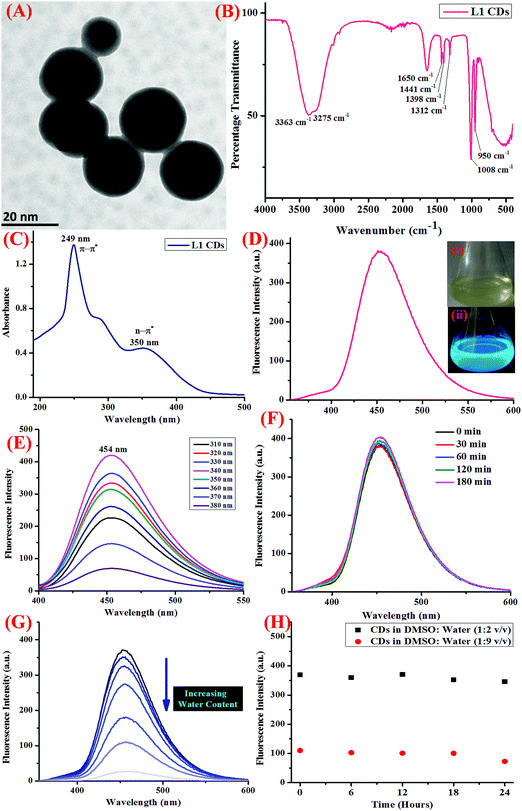 |
| | Fig. 1 (A) The HR-TEM micrograph of the CDs showing the spherical shaped nano-dots with diameter less than 20 nm, (B) the FTIR spectrum of the CDs, (C) the UV-visible absorption spectrum of the CDs showing peaks at 249 and 350 nm, (D) the fluorescence emission spectrum of the CDs showing a peak at 454 nm when excited at a wavelength of 340 nm, inset: the pictorial representation of the CDs in day-light (i) and UV-vis light (ii), when irradiated with 365 nm light, (E) fluorescence emission spectrum of the CDs under varying excitation wavelength from the range of 310 to 380 nm, showing maximum fluorescent intensity at λex = 340 nm, (F) the changes in the fluorescence emission intensity of the CDs at different intervals of time when irradiated with UV light (365 nm), showing excellent resistance to photo-bleaching, (G) the fluorescence emission profile showing the quenching of intensity on increasing the water content due to the self-assembly of CDs in water, (H) the variation in the fluorescence emission intensity at different ratio of DMSO:water, showing aqueous stability up to 24 hours. | |
Further, in order to gain insight into the sensor applications of the CDs, the effect of pH, water content, and increasing the salt concentration was evaluated using fluorescence spectroscopy. The photostability of the CDs was also investigated to understand the ability of the CDs to resist photo-bleaching. For this, the dispersed CDs were irradiated with UV light (365 nm) for at least 180 minutes and the change in the emission intensity was monitored (Fig. 1F). Also, the stability of the CDs on varying the pH was also scrutinized using dilute solutions of HCl (0.1 M) and NaOH (0.1 M), and it was shown to display stability in a wide range of pH (Fig. S4, ESI†). In order to study the effect of the rising concentration of water on the fluorescence response of CDs, different concentrations of CDs with increasing water content were prepared and the emission profile was noted (Fig. 1G). Further, to study the aqueous stability of the CDs, the emission profile of the CDs at two different concentrations of DMSO:water (1:2 and 1:9) were evaluated over a period of time (Fig. 1H).
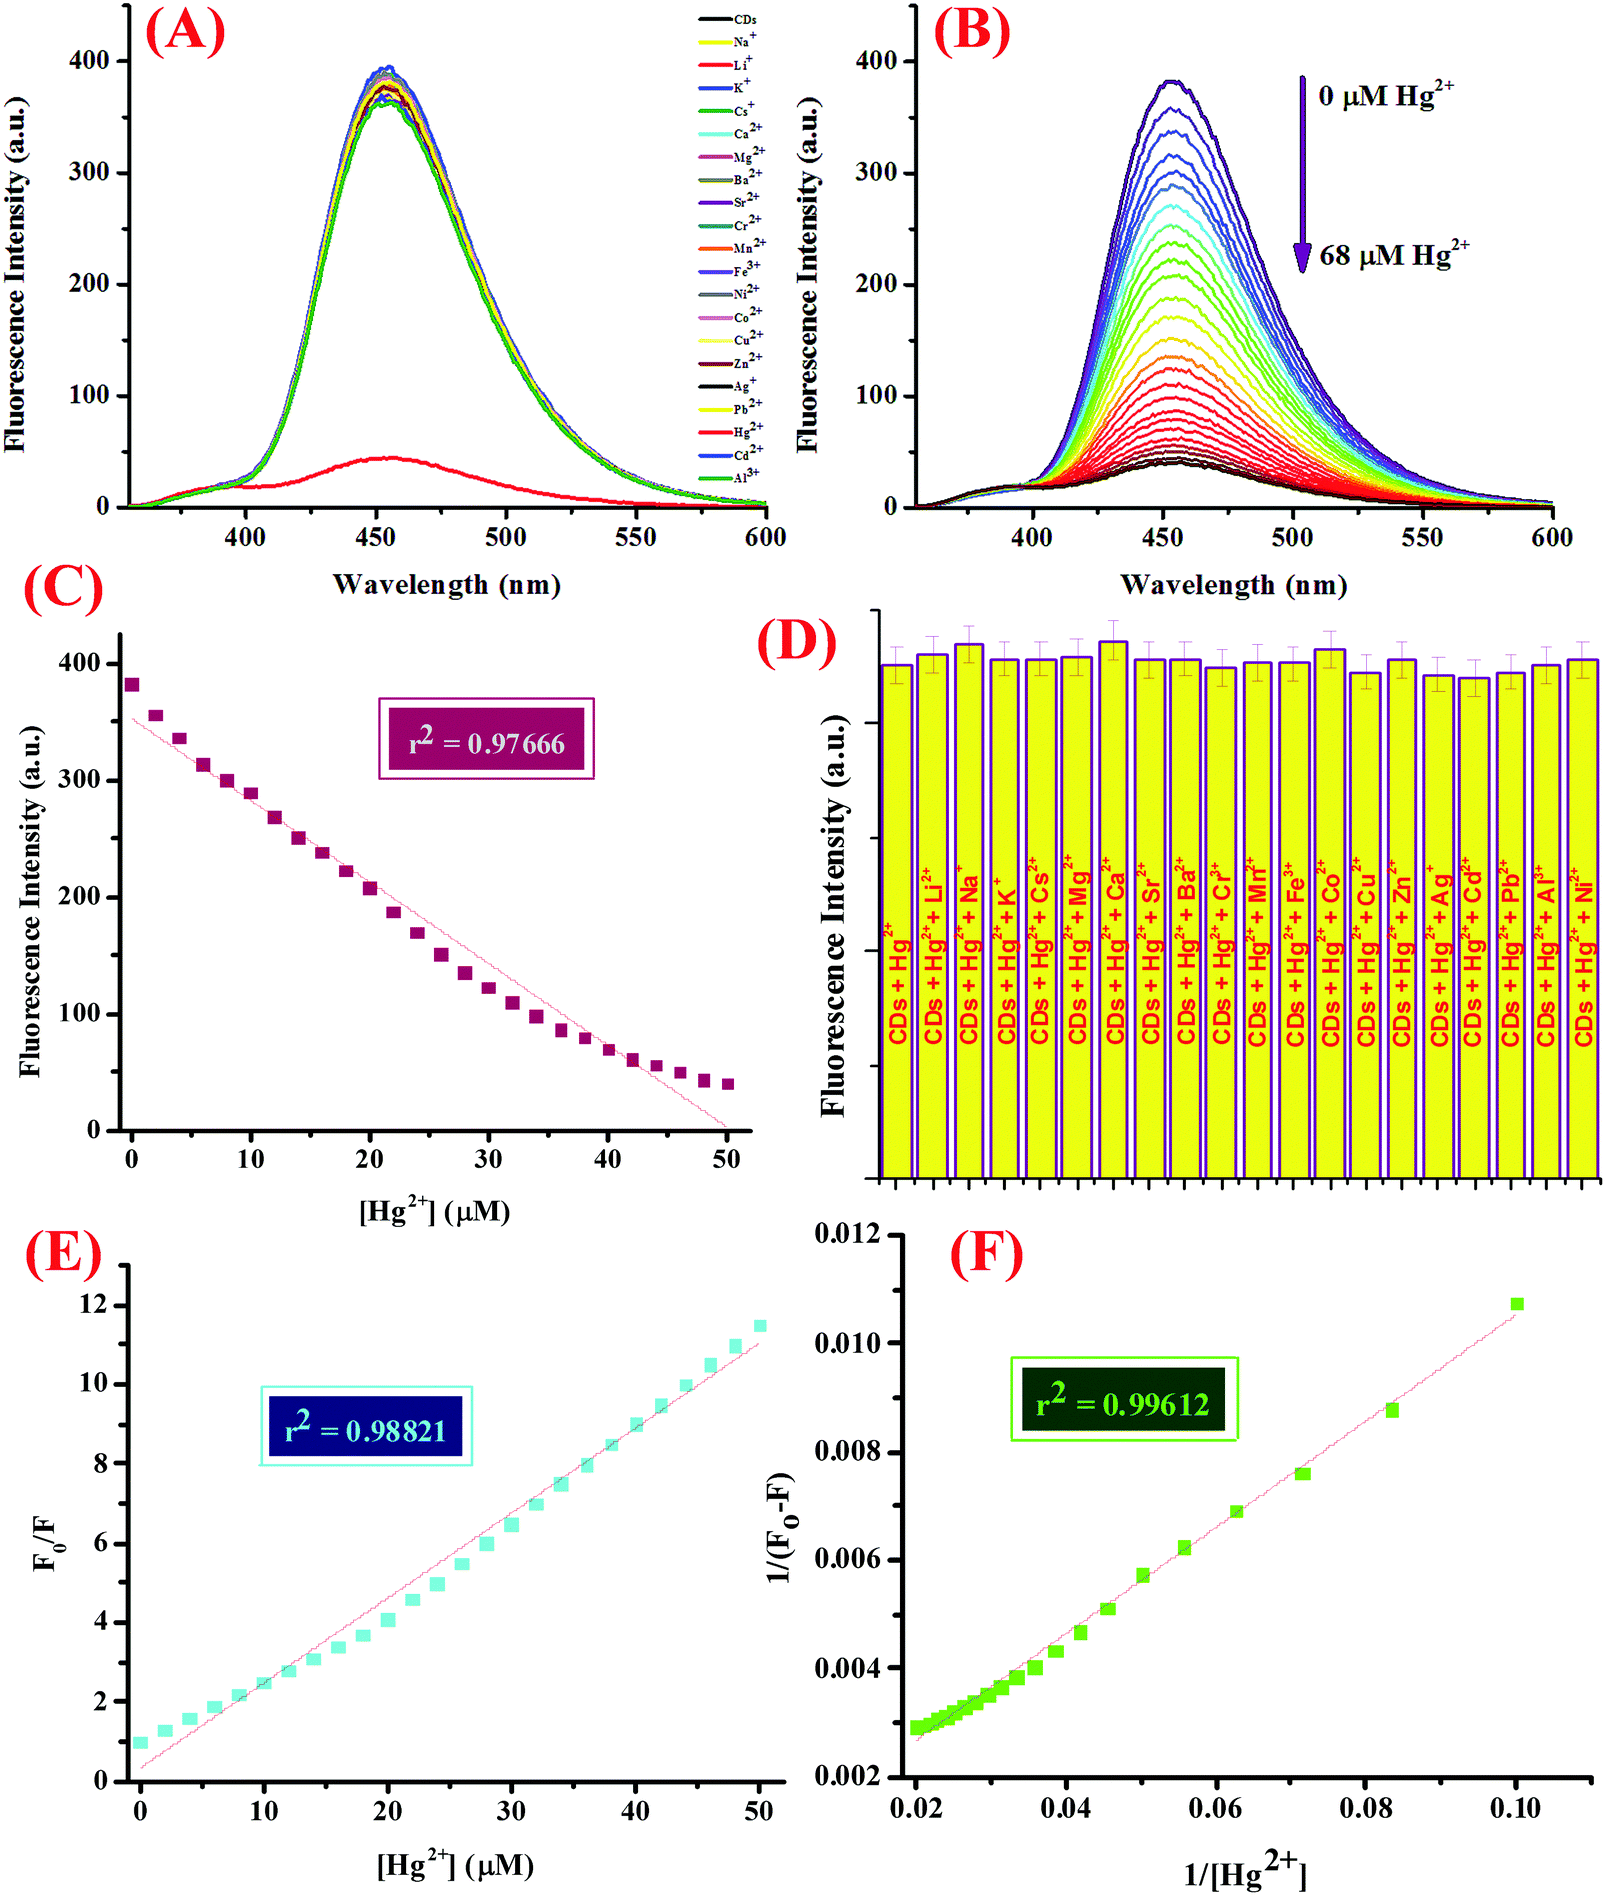
The sensor capability was then investigated, for which 5 mL of CDs in 5 mM Tris–HCl buffer (pH 7.4) was subjected to micro molar quantities of a library of nitrate salts of metal ions (50 μM), namely, Na+, K+, Li+, Cs+, Ba2+, Ca2+, Mg2+, Cr3+, Mn2+, Fe3+, Co2+, Ni2+, Cu2+, Zn2+, Pb2+, Zn2+, Hg2+, Ag+, and Al3+. The fluorescence emission profile was investigated at 25 ± 2 °C after mixing the solutions well and allowing them to set for at least 5–10 minutes (Fig. 2A). For the titration experiment, 5 mL of the CDs were subjected to increasing concentrations of Hg2+ ions (0–68 μM) and the emission spectra were recorded (Fig. 2B). Interference from other potentially interferent molecules was also checked by adding various metal ions to the dispersion of CDs containing 50 μM of Hg2+ ions and the emission spectra were scrutinized (Fig. 2D). In addition, to evaluate the response time of the binding process, varying concentrations of Hg2+ ions were added to the CDs and the emission intensity was investigated with respect to time (Fig. S5, ESI†).
 |
| | Fig. 2 (A) Fluorescence emission spectrum of the CDs displaying the selectivity of CD-based sensor assembly for Hg2+ ions over other metal ions at pH 7.4 in 5 mM Tris–HCl buffer, (B) FL response of the CDs (λex = 340 nm) upon the addition of the increasing concentration of Hg2+ ions in DMSO:water (1:2, v/v) at pH 7.4, (C) calibration plot displaying the linear relationship between the fluorescence intensity and Hg2+ concentration with a linear regression coefficient of 0.97666, (D) the relative fluorescence intensities of the CDs in DMSO:water (1:2, v/v) with different competitive metal ions (50 μM) in the presence of Hg2+ ions (50 μM), (E) Stern–Volmer plot, and (F) the Benesi–Hildeband plot showing a binding constant of 0.164 × 10⁶ M−1. | |
Determining the quantum yield.
9,10-Diphenylanthracene (reported quantum yield = 0.88) was taken as the standard material to determine the quantum yield of the as-synthesized CDs.35 The absorbance was measured using a UV-vis spectrophotometer and in order to confiscate the inner filter and the re-absorption effect, the absorbance was kept below the value of 0.10. Experimentally, five different concentrations of the two compounds were made by dissolving 9,10-diphenylanthracene in ethanol and CDs in water and the emission spectra were noted at the same λmax. Further, the quantum yield was calculated by making a comparison between the integrated fluorescence intensities and the absorbance values by employing the following equation:
| Φs = Φr[Grads/Gradr][ηs2/ηr2] |
where, subscripts ‘s’ and ‘r’ signify the sample and the reference, Φ represents the quantum yield, Grad refers to the gradient value from the plot of integrated fluorescence intensity vs. absorbance, and ‘η’ denotes the refractive index of the solvent used.34 The quantum yield was calculated to be 72%, which is significantly improved.
Trapping of Hg2+ ions in aqueous medium.
The CDs were coated on silica with a mesh size of 60–120 and were characterized using SEM (scanning electron microscopy) as shown in Fig. S6 (ESI†). As perceived from the figure, the SEM images indicate the coating of the CDs on the surface of silica, thereby decreasing the mesh size further. The silica was then loaded into a column having a diameter of 2 cm and known standard concentrations of Hg2+ ions (1 M, 1 mM, and 1 μM) were prepared and passed through the column. In order to calculate the amount of ions trapped by the CDs adsorbed on the surface of silica, diphenylthiocarbazone (dithizone) and an anionic surfactant (sodium lauryl sulfate) were employed to form the metal complex, thereby eliminating tedious solvent extraction procedures, which employ chlorinated solvents. The method employed here for the determination of residual Hg2+ ions in the samples collected after passing through the cartridge allows the determination of metal ions in the nanomolar range in the aqueous phase. The results were further validated using atomic absorption spectroscopy (AAS) and as depicted in Table 3, up to 98% of Hg2+ ions were trapped by the CDs adsorbed on silica. The adsorbed receptor 1 on the surface of silica was further employed to investigate its ability to trap Hg2+ ions from known concentrations and as depicted in Table 3, the receptor was shown to exhibit comparatively weak ability to trap Hg2+ ions. This could be ascribed to the fact that as CDs are developed from the organic receptor, the surface area increases in addition to a decrease in the flexibility of the organic receptor, which opens up binding sites to trap more analyte species.
Results and discussion
The organic receptor was synthesized, as described in the Experimental section and schematically represented in Scheme 1, under reflux conditions from ligand 1 pre-synthesized using the reported methodology.32 The CDs of receptor 1 were then developed by following the hydrothermal route, purified by dialysis, and the quantum yield was calculated to be 72%.
Before analyzing the final product using various spectroscopic techniques, the obtained product was freeze-dried, centrifuged, and dialysis was done to eliminate the possibility of the presence of reactant molecules or by-products. The morphology and shape of the as-synthesized CDs were then characterized using HR-TEM (high resolution transmission electron microscopy) and it was observed that the CDs displayed decent mono-dispersity and uniformity with an average particle size of 20 nm (Fig. 1A). FT-IR (Fourier transfer infra-red) spectroscopy was also carried out (Fig. 1B), which showed peaks at 3275 and 3363 cm−1, which could be ascribed to O–H and N–H stretching vibrations. Other peaks at 1650 cm−1 (C–N stretching vibrations), 1441 cm−1 (C–N bending vibrations), 1312 cm−1, 1008 cm−1, and 950 cm−1 are accountable for C–OH stretching vibrations.26 All the functional groups on the surface of the CDs are known to enhance the hydrophilicity as well as the stability in aqueous medium, thereby opening up the scope for sensing applications in aqueous medium.
The well-known optical properties of the CDs are reliant on the concept of quantum confinement as well as defective state emission.36 Also, the strong fluorescent properties could be ascribed to the existence of defect sites (for example, non-radiative states, swaying bonds, and free radicals) and an assemblage of sp2 carbon, leading to an upsurge in the band gap.37 These defect sites also account for low quantum yields and photo-bleaching. The photophysical properties of the CDs were assessed using UV-visible and fluorescence spectroscopy. CDs, owing to their chemical structure, may exhibit σ–σ*, σ–π*, π–π*, or n–π* transitions, and these are also known to possess tunable excitation as well as emission spectra, thus enabling us to choose an appropriate excitation wavelength.38 The UV-visible absorption profile of the CDs is anticipated to show a peak in the UV region, which is accountable for the π–π* transitions of the CC bonds, followed by a tail extended in the visible region, which are ascribed to n–π* transitions of the CO bonds.39 The absorption profile of the CDs showed an absorption peak at 294 nm, which is accountable to the π–π* transitions (CC bonds), and another peak at 350 nm is likely due to the n–π* transitions due to the CO bonds (Fig. 1C). The CDs showed blue colored fluorescence under UV irradiation (inset of Fig. 1D) and displayed an emission peak at 454 nm when excited at 340 nm (Fig. 1D) with a Stoke's shift of 114 nm allocated to the splitting of the exciton states by electron–hole exchange interactions via the de-excitation mechanism. Also, the sharp fluorescence emission profile of the CDs could be apportioned to the stabilization of the sharp energy traps in the CDs. Further, in order to examine the optical properties of the CDs, the fluorescence emission profile of the same were recorded at progressively increasing excitation wavelengths from 310 to 380 nm (Fig. 1E), which was shown to exhibit excitation wavelength-independent phenomenon, consistent with the literature findings.37 It is observed in the emission profile that an attenuation in the fluorescence intensity was observed as the excitation wavelength was increased from 310 to 380 nm.
Another important prevalent feature of the CDs is the solvent-dependent optical response and to study the behavior of CDs in the presence of increasing concentration of water; the CDs were subjected to the gradual addition of water and as shown in the emission profile, the decrease in the fluorescence intensity on increasing the water content is likely due to the self-assembly of the CDs (Fig. 1G).40 Further, the stability of the CDs in water over a period of 24 hours was examined using fluorescence spectroscopy and it was shown to unveil an aqueous consistency up to 24 hours (Fig. 1H). The photo-stability of the CDs is another significant property, especially in fluorescence detection methods.41 Therefore, the emission profile of the CDs was scrutinized under UV irradiation (365 nm) for 180 minutes (Fig. 1F) and no change in the fluorescence intensity was observed, thus substantiating the photo-stability of the CDs. This is worthwhile that there are a few reported CDs that display undesirable photo-bleaching irrespective of their high quantum yields.42 In order to examine the selectivity, sensitivity, and stability of the CDs in fluorescence detection, assorted physical parameters were required to monitor parameters such as effect of pH, high salt concentration, and water content. The CDs were subjected to increasing concentration of tetrabutyl ammonium perchlorate salt to investigate the effect of high salt concentration on the CDs; the emission profile displayed a negligible change and the response of the CDs was believed to be selective irrespective of high salt concentration in the medium (Fig. S7, ESI†). The consistent fluorescence intensity even in the presence of high ionic strength could be assigned to the non-ionization of the surface groups.26 Also, the effect of varying the pH on the binding behavior in the absence and presence of the analyte was evaluated and it was established that the CDs work best in the pH range of 3.5 to 11.5 in the absence of the analyte and in the range of 4 to 11 in the presence of the analyte; also, the stability of the CDs in a wide pH range suggests that the sensor response was not affected by the analyte (Fig. S4, ESI†). The ability of the sensor to display stable fluorescence under extreme pH conditions could be comprehended in terms of variation in the surface charge due to protonation–deprotonation.37,43 Subsequently, we selected 7.4 as the optimal pH and carried out all the studies at this pH using Tris–HCl buffer (5 mM). Exercising the same experimental conditions and using Tris–HCl buffer so as to maintain constant pH conditions, the photophysical sensor properties of the CDs towards an array of metal ions was investigated using fluorescence spectroscopy. For the sensor studies, the CDs were excited at 340 nm and the emission profile was evaluated at 454 nm and the temperature was maintained at 25 ± 2 °C. In the volumetric flasks, 5 mL dispersion of CDs was taken and 50 μM of nitrate salts of various metal ions, namely, Na+, K+, Li+, Cs+, Ba2+, Ca2+, Mg2+, Cr3+, Mn2+, Fe3+, Co2+, Ni2+, Cu2+, Zn2+, Pb2+, Zn2+, Hg2+, Ag+, and Al3+. The solutions were then mixed properly and allowed to sit undisturbed for at least 5–7 minutes before recording the emission spectra. As perceived from the emission profile (Fig. 2A), the fluorescence intensity was seen decline abruptly in the presence of nitrate salt of Hg2+ ions, whereas negligible change was identified with any other metal ion. The soft closed-shell Hg2+ cation has a pronounced affinity towards sulfur-donor ligands owing to Pearson's HSAB principle.3 The quenching of the fluorescence intensity on the addition of Hg2+ ions could be accounted for by the electron-transfer process between the electron deficient Hg2+ ions and the electron-rich CDs (presence of donor groups such as S/N atoms) of receptor 1. In order to authenticate the binding process, the titration experiment was carried out to demonstrate the mode of binding. For this, Hg2+ ions were added gradually with increasing concentration from 0 to 68 μM to the CDs and the fluorescence emission spectra were noted after each addition (Fig. 2B). As established by the calibration plot (Fig. 2C), the fluorescence intensity was seen to decrease linearly with a linear regression coefficient of 0.97666 when the concentration of Hg2+ ions was progressively increased. The Hg2+ ions are reported to induce quenching in the fluorescence intensity of the CDs through redox reactions besides the electron-transfer mechanism. Generally, it is anticipated that sulfur atoms in the case of the S-doped CDs display high affinity towards Hg2+ ions, leading to fluorescence quenching, which is prompted by the state of sulfur impurities as well as the structure of the CDs, which is inherited upon by the methodology employed and the carbon source expended.44,45 The decrease in the fluorescence intensity of the CDs upon binding with Hg2+ ions could be accounted for the electrostatic interactions between the negatively charged surface of the CDs due to the presence of hydroxyl groups and Hg2+ ions.1 The negatively charged surface of the CDs was authenticated by measuring the zeta potential in a semi-aqueous medium at pH = 7 and temperature = 29.25 °C and the value obtained was −54.1 mV, as shown in the ESI† (Fig. S8). Also, it is well reported in the literature that the nanomaterials containing the functional groups containing either or all of O/N/S the heteroatoms and sp2 bonded carbon atoms display high affinity towards Hg2+ ions through π–π stacking, electrostatic interactions, or chemical reaction.46 In addition, the quenching event may also be accounted for by the electron transfer from the CDs to the Hg2+ ions or the surface adsorption of the ions.35,47 Hence, the quenching due to Hg2+ ions may be attributed to synergetic strong electrostatic interactions (electron/energy transfer) and metal–ligand coordination between the functional groups on the surface of the CDs and Hg2+ ions.
The detection limit was calculated using the 3σ method as described below and it found to be 7.89 nM, which is better than or analogous to the fluorescent probes for Hg2+ ions reported in the literature, as shown in Table 2.48 United States Environmental Protection Agency has allowed the upper limit of Hg2+ ion concentration in drinking water to be 0.002 mg L−1 (2 ppb, 10 nM).46,49 Our system could successfully detect Hg2+ ions beyond this level in the aqueous medium with high selectivity. The quenching efficiency (F0/F) versus the Hg2+ ion concentration plot displayed a good linear relationship in the range of 0.1 to 50 μM (Fig. 2E), where F0 and F are the fluorescence intensities of the CDs in the absence and presence of Hg2+ ions, respectively. The emission titration data was then exploited to determine the binding constant by using the Benesi–Hildebrand method and it found to be 0.164 × 10⁶ M−1. The proposed sensing system was entitled to have a prominent sensitivity and maintains a great competence for a number of applications. In addition to this, the binding towards Hg2+ ions was further explored using the UV-vis titration experiment. For this, CDs were subjected to increasing concentration of Hg2+ ion (0–55 μM) (Fig. S9, ESI†) and as perceived from the absorption profile, a hyperchromic shift in the absorption peak at 249 nm was observed accompanied by a reduction in the peak at 350 nm, which could be accounted for by the electrostatic interaction between the Hg2+ ions and the surface functional groups of the CDs. In addition to this, the fluorescence emission profile of the CDs in the presence of tetrabutylammonium salts of various anions, viz., HSO4−, NO3−, Cl−, F−, Br−, I−, H2PO4−, and CH3COO− was investigated and it was shown to display negligible change in the emission intensity upon the addition of any of the above mentioned anions (Fig. S10, ESI†). Further, in order to explore the selectivity of the system, the emission spectra was investigated upon the addition of various biologically relevant metal ions viz., Ca2+, Mg2+, Zn2+, and Fe2+ ions and other metal ions such as Na+, K+, Li+, Cs+, Ba2+, Cr3+, Mn2+, Ni2+, Cu2+, Pb2+, Ag+, and Al3+ (50 μM) to the CDs containing 50 μM of Hg2+ ions under the same experimental conditions (Fig. 2D). In addition, the emission spectra was also scrutinized upon the addition of an array of tetrabutylammonium salts of anions, viz., HSO4−, NO3−, Cl−, F−, Br−, I−, H2PO4−, and CH3COO− and a negligible change in the emission intensity was observed (Fig. S11, ESI†). It could be observed that the fluorescence intensity remains unaltered even in the presence of various environmentally and biologically pertinent coexisting foreign substances, thus delineating our sensing system to be highly specific and selective. In addition to this, the response of the proposed sensing system as a function of time was also investigated by scrutinizing the variation in the emission profile (Fig. S5, ESI†). In this experiment, varying concentrations of Hg2+ ions were added to CDs (0–40 μM) taken in volumetric flasks and the emission spectra were recorded at regular intervals at 25 ± 2 °C. It was witnessed that Hg2+ tends to bind CDs in the first 40 seconds independent of the concentration added and a negligible change in the emission profile was observed thereafter. In addition, in order to understand the effect of changeable pH on the response of the sensor specifically towards Hg2+ ions, the pH of the complex (CDs–Hg2+) was altered using dilute solutions of HCl (0.1 M) and NaOH (0.1 M), and the fluorescence emission profile was observed (Fig. S4, ESI†); it was realized that the system is reasonably stable in a wide range of pH (4 to 11). As no inconsistency in the fluorescence intensity was seen, the CDs are anticipated to perform well in various environments, hence, diversifying the conceivable applications of the CDs, which are well explored in this report.
Determining the detection limit
In order to determine the detection limit of the proposed probe, the 3σ/m method was employed, where ‘m’ is the slope of the graph and ‘σ’ is the standard deviation of the blank. To calculate the standard deviation of the blank, the fluorescent titrations were evaluated and the emission intensity of the CDs was measured 10 times in the absence of Hg2+ ions. Further, Hg2+ ions were added, triplicate measurements were performed using fluorescence spectroscopy, an average of the readings was plotted with respect to the concentration of Hg2+ ions added, and the slope was then determined. The detection limit was then calculated to be 7.89 nM.
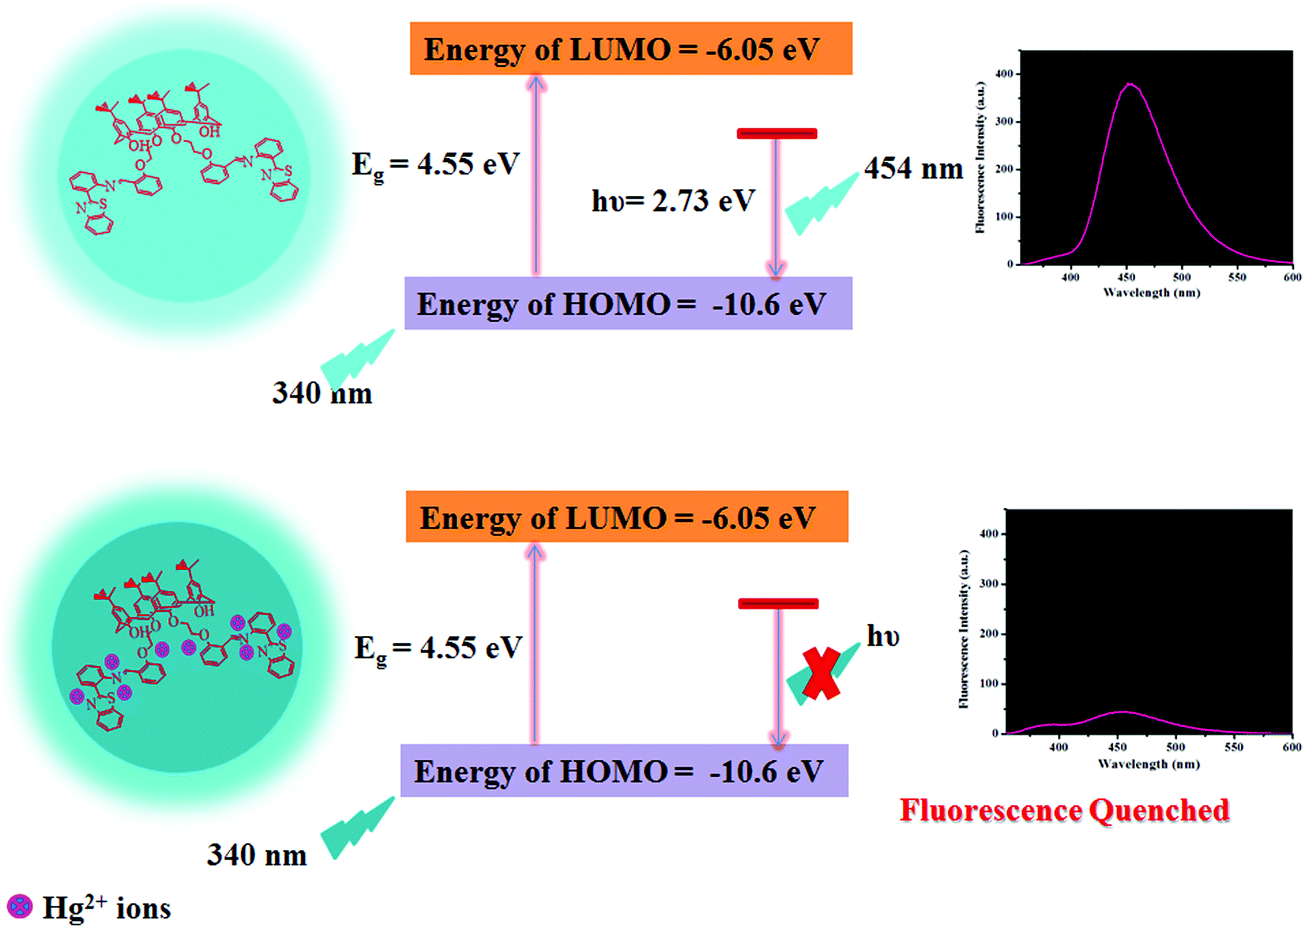
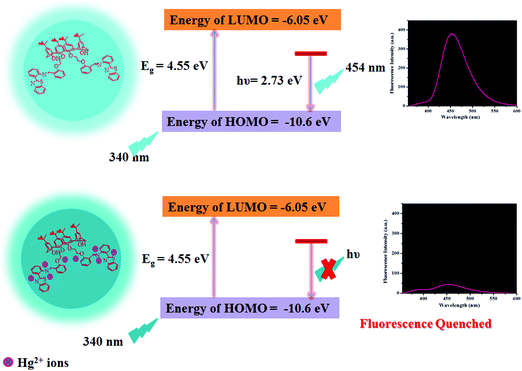
Plausible mechanism of fluorescence response of the CDs towards Hg2+ ions
As reported in the literature, N/S containing functional groups exhibit great binding affinity for Hg2+ ions,46 considering that we are reporting herein a mechanism for Hg2+-mediated fluorescence quenching of CDs by a non-radiative electron transfer process, as shown in Scheme 2. The highest occupied molecular orbital (HOMO) and lowest unoccupied molecular orbital (LUMO) energy levels could be predicted using the following empirical formula.50,51
where, Eox denotes the inception of oxidation potential and Ered denotes the onset of reduction potential of the CDs. The Eox was determined to be −0.49 V as perceived from the cyclic voltammogram of the CDs in DMSO (Fig. S12, ESI†) and the EHOMO was calculated to be −10.6 eV, employing the above equation. However, ELUMO could not be calculated because of the irreversible oxidation behavior. Thus, in order to determine the ELUMO, we related Eox with the optical band gap (Eg, as obtained from the absorption edge in the absorption spectra, i.e., TAUC plot) and Eg was calculated to be 4.55 eV, as depicted in Fig. S13 (ESI†). Therefore, the ELUMO was then calculated using the following equation.
The ELUMO was determined to be −6.05 eV. Thus, it is demonstrated that the complexation of Hg2+ ions with the CDs leads to the transfer of electrons from the excited state of the CDs to the vacant orbitals of Hg2+ ions, thus restraining electron transition in the radiation form, leading to FL quenching (Scheme 2). The results are consonant with those obtained in the FL spectrum.
 |
| | Scheme 2 Schematic representation of the plausible mechanism for the binding of Hg2+ ions with the as-synthesized CDs. | |
Analytical application of the sensor probe
In order to detect Hg2+ ions in contaminated water samples and to explore the analytical utility of the sensor probe, the polluted water samples were collected from different sources, viz., industrial area, agricultural fields, laboratory waste water, and packaged drinking water. Firstly, the sensor probe was quantified in the presence of known concentrations of Hg2+ ions (0–10 μM) and a calibration plot was plotted. All the samples except packaged drinking water were diluted 10-folds and in order to minimize the interference due to a number of plausible interfering contaminants in the samples, the Hg2+ ions were then determined by employing the standard addition method.20 The polluted water samples were first centrifuged at 10000 rpm for 20 minutes and then filtered using a 0.22 μm membrane. The fluorescence emission spectra of all the three samples and a spiked water sample were then evaluated and the results obtained were excellent when plotted with respect to the standard calibration curve. Hg2+ ions were quantified from the recovered samples in the range of 96 to 100.9% (Table 1), and the fluorescence of the solutions was found to be enhanced under UV irradiation.
Table 1 Estimation of Hg2+ ions in the water samples collected from different sources and spiked with known concentrations of Hg2+ ions
| S. no. |
Sample source |
Sample ID |
Concentration of Hg(II) ions (μM) |
Hg(II) ions recovered |
% recovery |
| 1 |
Industrial waste |
I1 |
22 |
21.17 ± 0.18 |
96.22 |
| 2 |
Agricultural land |
A1 |
14 |
13.78 ± 0.08 |
98.42 |
| 3 |
Laboratory waste |
L1 |
16 |
16.15 ± 0.12 |
100.93 |
| 4 |
Packaged drinking water |
D1 |
8 |
7.89 ± 0.28 |
98.6 |
The experiment demonstrated that the sensor probe has a great potential to detect Hg2+ ion contamination in environmental samples with high sensitivity and selectivity. Also, the fluorescence response and detection limit of the CDs was compared with those of various other fluorescent chemosensors based on the organic receptor or the organic/inorganic quantum dots for Hg2+ ion detection in various solvent media, signifying that our proposed strategy has the lowest detection limit (Table 2).
Table 2 Tabular representation of a few Hg2+ ion fluorescent chemosensors reported lately
| S. no. |
Ligand/receptor |
Fluorescence response |
Detection limit |
Solvent used |
Ref. |
| 1 |
Pyrene based Schiff's base |
Enhancement |
2.82 μM |
DMSO:water (7:3 v/v) |
17
|
| 2 |
Graphitic carbon nitride quantum dots |
Quenching |
37 nM |
Water |
52
|
| 3 |
BODIPY derivative |
Enhancement |
38 nM |
DMSO/water (20:80 v/v) |
53
|
| 4 |
Cysteamine capped silver nanoparticles |
Quenching |
0.55 ppb |
Water |
54
|
| 5 |
Bipodal histidine based on thiocarbamate scaffold |
Enhancement |
20 ppb |
MeOH/water (80:20 v/v) |
55
|
| 6 |
N,S co-doped CDs |
Quenching |
7.89 nM |
DMSO/water (1:2 v/v) |
Present work |
Trapping of Hg2+ ions in the aqueous medium by CDs adsorbed on silica
The CDs previously obtained were adsorbed on the surface of silica having a mesh size of 60–120 and the adsorption was confirmed using SEM analysis (Fig. S4, ESI†). Considering the ability of the CDs to bind Hg2+ ions in the aqueous medium, as evident from the fluorescence emission spectroscopy results, the binding capability of the CDs adsorbed on the silica surface towards Hg2+ ions was scrutinized using atomic absorption spectroscopy (AAS). For this, modified silica was loaded into a column having a diameter of 2 cm and a known concentration of Hg2+ ions was then passed through it under pressure and lots were then collected in test tubes (C1–C3). The AAS results indicate that most of the ions (∼98%) bonded to the CDs adsorbed on the surface of silica. Also, the results were further validated using a known standard procedure employing dithizone and an anionic surfactant SDS as the metal ion chelator. For this, dithizone (10 mg) was dissolved in 10% SDS solution and sonicated for half an hour. Known concentrations of Hg2+ ions were prepared in distilled water and were mixed with equal volume of dithizone solution at pH = 2 to form the M(H2Dz)n complex, where ‘M’ is the metal ion employed (Hg2+ in our case) and ‘n’ is the valency of the metal ion. The formation of the complex with known concentration of Hg2+ ion yielded the value for epsilon (ε), which came out to be 178. Further, when the lots of Hg2+ ions collected from the column were complexed with dithizone, the residual concentration of Hg2+ ions could be effectively calculated using Beer–Lambert's law. The results obtained by this method as well as that obtained using the AAS technique were comparable and are shown in Table 3. We also modified silica with receptor 1 and scrutinized its ability to bind Hg2+ ions from an aqueous solution of known concentration (R1–R3) and the results are depicted in the comparison with silica modified with CDs in Table 3. The silica modified with CDs was shown to bind up to 98% of the metal ions, whereas the receptor adsorbed on silica was able to trap only up to 66% of the Hg2+ ions.
Table 3 The AAS results of extracted Hg2+ ions after passing through the cartridge of silica coated with the receptor and CDs
| S. no. |
Sample ID |
Hg(II) ions passed |
Hg(II) ions recovered (AAS method) |
Percentage extracted (%) |
| 1 |
CDs |
1 μM |
0.02 ± 0.01 μM |
98 |
| 2 |
1 mM |
0.14 ± 0.04 mM |
86 |
| 3 |
1 M |
24 ± 1.7 mM |
97.6 |
|
|
| 4 |
Receptor |
1 μM |
0.34 ± 0.04 μM |
66 |
| 5 |
1 mM |
0.55 ± 0.08 mM |
45 |
| 6 |
1 M |
0.43 ± 0.12 M |
66 |
This could be attributed to the increase in the surface areas and decreased the flexibility in the organic receptor upon the development of CDs in semi-aqueous medium, thus allowing the binding sites to trap more of Hg2+ ions from the aqueous medium. In addition to this, material recovery was also addressed, for which the modified silica bound with Hg2+ ions was treated with EDTA to extract all the Hg2+ ions so that the sensor material could be reused. This could also be achieved using tetrabutylammonium salt of hydroxide instead of EDTA. The quenched fluorescence emission intensity of the CDs containing Hg2+ ions was found to increase upon the addition of aqueous solution of EDTA as well as tetrabutylammonium hydroxide (Fig. S14, ESI†); hence, the system is proposed to be recyclable, convenient, and eco-friendly for environmental use.
Preparation of cartridge to trap Hg2+ ions in the spiked water sample from different sources
For this, silica coated with CDs was loaded into a column-shaped container of diameter 4 cm and length of 15 cm. The column was fitted with a screw on the upper side, which was then connected to a receiver unit. The other side of the column was connected to a pump, followed by a stop cork to control the flow rate. The schematic representation of the assembly is shown in Fig. 3A and the inset of the figure depicts the pictorial representation of the as-prepared cartridge. Further, packaged drinking water, laboratory wastewater, industrial effluent from a local rubber processing unit, and water discharge from agricultural land was collected and processed as discussed in the above section. The water samples were then spiked with known concentrations of Hg2+ ions and the known volume of the samples were then loaded into the reservoir and allowed to pass through the cartridge at a controlled flow rate. Prior to the experiment, certain parameters such as the flow rate, volume of the sample to be passed down the cartridge, and other physical parameters such as pH and temperature were optimized. For this, the pH of the sample was varied using dilute HCl (0.1 M) and NaOH (0.1 M) solutions. The sample solutions were then passed through the cartridge and the trapped concentration of Hg2+ ions was investigated using the AAS method; it was observed that the maximum amount of Hg2+ ions were trapped in the cartridge in the pH range from 4 to 9 (Fig. 3C). Hence, it could be perceived that the optimum pH range at which the cartridge could perform well is 4 to 9.
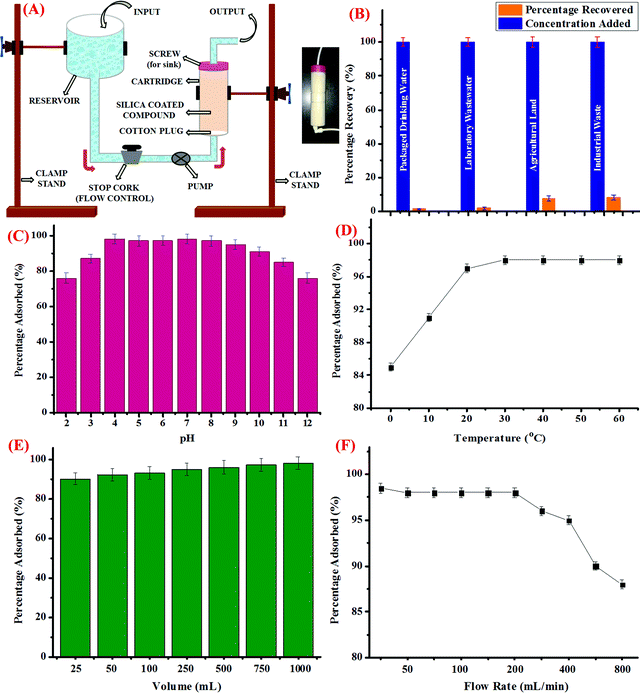 |
| | Fig. 3 (A) Diagrammatic representation of the assembly to trap Hg2+ ions from water samples of different origin using the cartridge formed from silica-coated CDs; inset: pictorial representation of the cartridge, (B) bar graph depicting the percentage removal of Hg2+ ions from spiked water samples, (C) effect of pH on the removal efficiency of the cartridge thus developed, (D) effect of varying temperature conditions on the removal efficiency of the cartridge, (E) effect of increasing volume of the sample on the performance of the cartridge, and (F) the effect of the varying rate of flow of the water sample containing known concentration of Hg2+ ions on the performance of the cartridge. | |
In addition, variation in the temperature conditions was studied and it was observed that as the temperature rises from 0 °C to 25 °C, the percentage of Hg2+ ions adsorbed increases, which got stagnant thereafter, irrespective of the further increase in temperature up to 60 °C (Fig. 3D). Also, the effect of increase in the volume of the sample to be passed through the cartridge to trap Hg2+ ions was evaluated. As could be evidently seen in Fig. 3E, as the volume of sample increases, the percentage of adsorbed Hg2+ ions increases and nearly 98% of Hg2+ ions were trapped when 1 L of the sample is subjected to silica coated with CDs. In addition to this, the rate of flow of the sample is another important parameter, which was studied carefully. For this, the rate of flow from the reservoir held at a certain position above the ground level was controlled using a stop cork and a pump. As depicted in Fig. 3F, when the flow rate was less than 50 mL min−1, maximum percentage of Hg2+ ions were adsorbed in the cartridge, which remained almost constant up to a flow rate of 200 mL min−1. However, when the flow rate was further increased, fewer amounts of Hg2+ ions were trapped in the silica coated with CDs, which could be due to the fact that less time was given for the interaction to take place. Hence, for conducting the experiment, 1000 mL of the water sample from different sources was passed through the cartridge at a flow rate of 200 mL min−1 at neutral pH and room temperature and as can be seen in Fig. 3B, the maximum amount of Hg2+ ions got trapped in the cartridge when packaged drinking water and laboratory waste water were employed. However, comparatively lesser amount of Hg2+ ions was adsorbed in case of industrial and agricultural effluents, which could be attributed to the presence of certain impurities and interferent species. Conclusively, it could be perceived that the as-synthesized CDs, when adsorbed on silica, could be efficiently used to trap Hg2+ ions from real water samples and the silica bed thus developed could be employed as a cartridge in our water purification system.
In addition, the capturing efficiency of the silica loaded with CDs towards Hg2+ ions was compared with literature findings. Table 4 displays the adsorption capacity (Q) of the CDs for Hg2+ ions and it was found out that the capacity of the as-synthesized CDs is higher than those from several reports in the literature, which employed various adsorbents such as carbon nanotubes, graphene oxide derivatives, and nanocomposites.56–67 It was also discovered that in spite of the higher surface area in case of carbon nanotubes, silica-loaded CDs exhibit significantly higher adsorption capacity owing to the presence of specific surface functionalities that are unique to the metal ions. The CDs outperformed several other adsorbent materials and provided positively superior support for real-time water remediation. It is also worth mentioning here that the adsorbents with higher surface area displayed lower adsorption capacity than the CDs, indicating that larger surface area is not a sufficient parameter for adsorbing Hg2+ ions with high specificity, whereas the presence of appropriate chemical functionalities on the surface exhibits paramount importance.
Table 4 Comparison table displaying the adsorption capacity (Q) of various adsorbents towards Hg2+ ions
| S. no. |
Adsorbent |
Adsorption capacity (Q) (mg g−1) |
Conditions |
Ref. |
| MWCNTs is multi-walled carbon nanotubes, SWCNTs is single-walled carbon nanotubes, GO is graphene oxide, Ox is oxalate, and Ci is the initial concentration of the adsorbate. |
| 1 |
Nanostructured carbon florets |
395 |
C
i = 50 ppm |
58
|
| 2 |
CoFe2O4–chitosan–graphene |
361 |
pH = 7; T = 323 K; |
59
|
| 3 |
Amino-functionalized magnetic graphene composite |
158.5 |
T = 298 K |
60
|
| 4 |
EDTA-functionalized magnetic graphene oxide |
268.4 |
pH = 4.1; T = 318 K |
61
|
| 5 |
Phenolic hydroxyl functional group P-MWCNTs |
28.22 |
pH = 4.3; Ci = 4 mg L−1 |
62
|
| 6 |
L-Cystine functionalized exfoliated GO |
79.36 |
|
63
|
| 7 |
OH-MWCNTs |
89.42 |
pH = 4.3; Ci = 4 mg L−1 |
62
|
| 8 |
Magnetic cobalt ferrite–rGO nanocomposites |
157.9 |
pH = 4.6; T = 298 K |
64
|
| 9 |
Ox-MWCNTs impregnated chitosan beads |
181.8 |
pH = 4; Ci = 1000 mg L−1 |
65
|
| 10 |
Amino and thiolated fucntionalized MWCNTs |
83.33 |
pH = 6; Ci = 100 mg L−1; T = 25 °C; time = 60 min |
66
|
| 11 |
Thiol derivatized SWCNTs |
74.2 |
pH = 5; Ci = 40 mg L−1; time = 1 h; adsorbent dose = 0.25 mg mL−1; T = 298 K |
67
|
| 12 |
Calix[4]arene-based CDs coated on silica |
786.31 |
C
i = 1 mM; adsorbent dose = 0.25 g; T = 298 K; neutral pH |
Present work |
Conclusions
Concisely, we have developed an ingenuous method to selectively detect Hg2+ ions with high sensitivity employing CDs based on organic receptor having calix[4]arene and benzothiazole moieties. Hydrothermally synthesized CDs displayed excitation wavelength-independent fluorescence emission profile. The developed nanosensor is expected to show the on-site detection of Hg2+ ions in real samples owing to certain advantages in the form of its ability to resist photo-bleaching, wide pH stability, virtuous aqueous stability, and exceptional fluorescent properties due to its high quantum yield at neutral pH. Conspicuously, the report suggests that the CDs thus obtained have a distinctive potential as a promising fluorescent probe for the detection of Hg2+ ions with distinguished selectivity and sensitivity. This economical sensor motif offers rapid detection within a fraction of seconds, low detection limit (lower than that permitted by the US Environment Protection Agency) in aqueous medium, and a broad linear response. Also, this strategy excludes the use of semiconductor quantum dots for the detection of metal ions apart from eradicating the need of organic solvents. In addition to this, the sensor was also applied for the removal of Hg2+ ions from aqueous medium by adsorbing CDs on the surface of silica and investigating its Hg2+ binding ability using the standard method, in which dithizone in 10% SDS solution was used as a metal ion chelator in acidic pH; the results obtained were comparable with those obtained from ion exchange chromatography. In addition, modified silica could be reused for the removal of Hg2+ ions after washing with aqueous solution of EDTA or tetrabutylammonium hydroxide as perceived from the fluorescence emission results, in which fluorescence was recovered after the addition of aqueous EDTA or tetrabutylammonium hydroxide into the CD-containing Hg2+ ions. In addition to this, the silica-coated CDs were further experimentally shown to trap Hg2+ ions from real water samples of different origin and thus could be successfully employed to be used as a pre-filtration cartridge in water purification systems used for industrial and domestic purposes.
Conflicts of interest
There are no conflicts to declare.
Acknowledgements
N. K. is thankful to SERB, India, for research funding through research project sanctioned to her (File No. EMR/2017/003438).
References
- S. Kumari and G. S. Chauhan, ACS Appl. Mater. Interfaces, 2014, 6, 5908–5917 CrossRef CAS.
- W. C. Li and H. F. Tse, Environ. Sci. Pollut. Res., 2015, 22, 192–201 CrossRef CAS.
- S. A. Rahaman, B. Roy, S. Mandal and S. Bandhyopadhyay, Inorg. Chem., 2016, 55, 1069–1075 CrossRef CAS.
- T. Ghosha, S. Chatterjeeb, K. Bhayania and S. Mishra, New J. Chem., 2020, 44, 6601–6609 RSC.
- S. B. Maity, S. Banerjee, K. Sunwoo, J. S. Kim and P. K. Bharadwaj, Inorg. Chem., 2015, 54, 3929–3936 CrossRef CAS.
- J. Huang, Y. Xu and X. Qian, J. Org. Chem., 2009, 74, 2167–2170 CrossRef CAS.
- M. Dong, Y.-W. Wang and Y. Peng, Org. Lett., 2010, 12, 5310–5313 CrossRef CAS.
- J. P. Baker, Am. J. Public Health, 2008, 98, 244–253 CrossRef.
- Y. Oh, C. D. Morris and M. G. Kanatzidis, J. Am. Chem. Soc., 2012, 134, 14604–14608 CrossRef CAS.
- M. Khajeh, S. Laurent and K. Dastafkan, Chem. Rev., 2013, 113, 7728–7768 CrossRef CAS.
- H. Ju, D. J. Chang, S. Kim, H. Ryu, E. Lee, I.-H. Park, J. H. Jung, M. Ikeda, Y. Habata and S. S. Lee, Inorg. Chem., 2016, 55, 7448–7456 CrossRef CAS.
- L. N. Suvarapu and S.-O. Baek, J. Anal. Methods Chem., 2015, 2015, 372459 Search PubMed.
- C. Gao and X.-J. Huang, Trends Anal. Chem., 2013, 51, 1–12 CrossRef CAS.
- R.-M. Kong, X.-B. Zhang, L. L. Zhang, X.-Y. Jin, S.-Y. Huan, G.-L. Shen and R.-Q. Yu, Chem. Commun., 2009, 5633–5635 RSC.
- S. Kraithong, R. Sangsuwan, N. Worawannotai, J. Sirirak, A. Charoenpanich, P. Thamyongkit and N. Wanichachewa, New J. Chem., 2018, 42, 12412–12420 RSC.
- S.-Y. Ding, M. Dong, Y.-W. Wang, Y.-T. Chen, H.-Z. Wang, C.-Y. Su and W. Wang, J. Am. Chem. Soc., 2016, 138, 3031–3037 CrossRef CAS.
- M. Shellaiah, Y. C. Rajan, P. Baluand and A. Murugan, New J. Chem., 2015, 39, 2523–2531 RSC.
- A. Pathak and B. D. Gupta, ACS Appl. Nano Mater., 2020, 3, 2582–2593 CrossRef CAS.
- E. M. Nolan and S. J. Lippard, Chem. Rev., 2008, 108, 3443–3480 CrossRef CAS.
- P. Srivastava, S. S. Razi, R. Ali, R. C. Gupta, S. S. Yadav, G. Narayan and A. Misra, Anal. Chem., 2014, 86, 8693–8699 CrossRef CAS.
- S. Manivannan, Y. Seo, D.-K. Kang and K. Kim, New J. Chem., 2018, 42, 20007–20014 RSC.
- P. K. Gupta, D. Chauhan, Z. H. Khan and P. R. Solanki, ACS Appl. Nano Mater., 2020, 3, 2506–2516 CrossRef CAS.
- D. Wang, J. Liu, Z. Liu, Z. Zhang, Z. Sun, C. Wu and G. Wang, ACS Appl. Nano Mater., 2020, 3, 2214–2220 CrossRef CAS.
- J. Zhang and S.-H. Yu, Mater. Today, 2016, 19(7), 382–392 CrossRef CAS.
- S. Y. Lim, W. Shen and Z. Gao, Chem. Soc. Rev., 2015, 44, 362–381 RSC.
- H. Zhang, Y. Chen, M. Liang, L. Xu, S. Qi, H. Chen and X. Chen, Anal. Chem., 2014, 86, 9846–9852 CrossRef CAS.
- M. T. Gabr, N. S. El-Gohary, E. R. El-Bendary, M. M. El-Kerdawy, N. Ni and M. I. Shaaban, Chin. Chem. Lett., 2015, 26, 1522–1528 CrossRef CAS.
- K. Aich, S. Goswami, S. Das, C. D. Mukhopadhyay, C. K. Quah and H. K. Fun, Inorg. Chem., 2015, 54, 7309–7315 CrossRef CAS.
- K. Ghosh and D. Kar, J. Inclusion Phenom. Macrocyclic Chem., 2013, 77, 67–74 CrossRef CAS.
- M. Moronshing, A. Sah, V. Kalyani and C. Subramaniam, ACS Appl. Nano Mater., 2020, 3, 468–478 CrossRef CAS.
- X. Jia, Y. Han, C. Wei, T. Duan and H. Chen, J. Anal. At. Spectrom., 2011, 26, 1380–1386 RSC.
- N. Singh, M. Kumar and G. Hundal, Tetrahedron, 2004, 60, 5393–5405 CrossRef CAS.
- Y. Liu, Q.-X. Zhou, Y.-Y. Yuan and Y. Wu, Carbon, 2017, 115, 550–560 CrossRef CAS.
- Y. M. Guo, Z. Wang, H. W. Shao and X. Y. Jiang, Carbon, 2013, 52, 583–589 CrossRef CAS.
- L. N. Neupane, E. T. Oh, H.-J. Park and K.-H. Lee, Anal. Chem., 2016, 88, 3333–3340 CrossRef CAS.
- S.-T. Yang, X. Wang, H. Wang, F. Lu, P. G. Luo, L. Cao, M. J. Meziani, J.-H. Liu, Y. Liu, M. Chen, Y. Huang and Y.-P. Sun, J. Phys. Chem. C, 2009, 113, 18110–18114 CrossRef CAS.
- Y. Dong, H. Pang, H. B. Yang, C. Guo, J. Shao, Y. Chi, C. M. Li and T. Yu, Angew. Chem., Int. Ed., 2013, 52, 7800–7804 CrossRef CAS.
- Y. Park, J. Yoo, B. Lim, W. Kwon and S.-W. Rhee, J. Mater. Chem. A, 2016, 4, 11582–11603 RSC.
- H. Ding, S.-B. Yu, J.-S. Wei and H.-M. Xiong, ACS Nano, 2016, 10, 484–491 CrossRef CAS.
- A. Zhang, C. Dong, H. Liu and J. Ren, J. Phys. Chem. C, 2013, 117, 24592–24600 CrossRef CAS.
- T. Ming, J. Suntivich, K. J. May, K. A. Stoerzinger, D. H. Kim and Y. Shao-Horn, J. Phys. Chem. C, 2013, 117, 15532–15539 CrossRef CAS.
- S. Zhu, Q. Meng, L. Wang, J. Zhang, Y. Song, H. Jin, K. Zhang, H. Sun, H. Wang and B. Yang, Angew. Chem., Int. Ed., 2013, 52, 3953–3957 CrossRef CAS.
- A. Savithri, S. Thulasi and R. L. Varma, J. Org. Chem., 2014, 79, 1683–1689 CrossRef CAS.
- W. Wang, Y.-C. Lu, H. Huang, A.-J. Wang, J.-R. Chen and J.-J. Feng, Sens. Actuators, B, 2014, 202, 741–747 CrossRef CAS.
- Y.-C. Lu, J. Chen, A.-J. Wang, N. Bao, J.-J. Feng, W. Wang and L. Shao, J. Mater. Chem. C, 2015, 3, 73–78 RSC.
- M. H. Lan, J. F. Zhang, Y. S. Chui, P. F. Wang, X. F. Chen, C. S. Lee and W. J. Zhang, ACS Appl. Mater. Interfaces, 2014, 6, 21270–21278 CrossRef CAS.
- S. Barman and M. Sadhukhan, J. Mater. Chem., 2012, 22, 21832–21837 RSC.
- A. Singh, A. Singh, N. Singh and D. O. Jang, RSC Adv., 2015, 5, 72084–72089 RSC.
- S. D. Hiremath, K. Kumar Maiti, N. NathGhosh, M. Banerjee and A. Chatterjee, ACS Appl. Nano Mater., 2020, 3, 3071–3079 CrossRef CAS.
- B. Liang, C. Jiang, Z. Chen, X. Zhang, H. Shi and Y. Cao, J. Mater. Chem., 2006, 16, 1281–1286 RSC.
- M. J. Cho, J.-I. Jin, D. H. Choi, J. H. Yoon, C. S. Hong, Y. M. Kim, Y. M. Park and B.-K. Ju, Dyes Pigm., 2010, 85, 143–151 CrossRef CAS.
- Y. Xu, X. Niu, H. Zhang, L. Xu, S. Zhao, H. Chen and X. Chen, J. Agric. Food Chem., 2015, 63, 1747–1755 CrossRef CAS.
- S. B. Maity, S. Banerjee, K. Sunwoo, J. S. Kim and P. K. Bharadwaj, Inorg. Chem., 2015, 54, 3929–3936 CrossRef CAS.
- Y. Bhattacharjee and A. Chakraborty, ACS Sustainable Chem. Eng., 2014, 2, 2149–2154 CrossRef CAS.
- J. Hatai, S. Pal, G. P. Jose and S. Bandyopadhyay, Inorg. Chem., 2012, 51, 10129–10135 CrossRef CAS.
- J. Xua, Z. Cao, Y. Zhang, Z. Yuan, Z. Lou, X. Xu and X. Wang, Chemosphere, 2018, 195, 351–364 CrossRef.
- F. Lu and D. Astruc, Coord. Chem. Rev., 2018, 356, 147–164 CrossRef CAS.
- M. Moronshing, A. Sah, V. Kalyani and C. Subramaniam, ACS Appl. Nano Mater., 2020, 3, 468–478 CrossRef CAS.
- Y. Zhang, T. Yan, L. Yan, X. Guo, L. Cui, Q. Wei and B. Du, J. Mol. Liq., 2014, 198, 381–387 CrossRef CAS.
- X. Guo, B. Du, Q. Wei, J. Yang, L. Hu, L. Yan and W. Xu, J. Hazard. Mater., 2014, 278, 211–220 CrossRef CAS.
- L. Cui, Y. Wang, L. Gao, L. Hu, L. Yan, Q. Wei and B. Du, Chem. Eng. J., 2015, 281, 1–10 CrossRef CAS.
- P. H. Chen, C. F. Hsu, D. D. W. Tsai, Y. M. Lu and W. J. Huang, Environ. Technol., 2014, 35, 1935–1944 CrossRef CAS.
- G. Yu, Y. Lu, J. Guo, M. Patel, A. Bafana, X. Wang, B. Qiu, C. Jeffryes, S. Wei, Z. Guo and E. K. Wujcik, Adv. Compos. Hybrid Mater., 2017, 1, 56–78 CrossRef.
- Y. Zhang, L. Yan, W. Xu, X. Guo, L. Cui, L. Gao, Q. Wei and B. Du, J. Mol. Liq., 2014, 191, 177–182 CrossRef CAS.
- H. A. Shawky, A. H. M. E. Aassar and D. E. A. Zeid, J. Appl. Polym. Sci., 2012, 125, 93–101 CrossRef.
- M. Hadavifar, N. Bahramifar, H. Younesi and Q. Li, Chem. Eng. J., 2014, 237, 217–228 CrossRef CAS.
- N. M. Bandaru, N. Reta, H. Dalal, A. V. Ellis, J. Shapter and N. H. Voelcker, J. Hazard. Mater., 2013, 261, 534–541 CrossRef CAS.
Footnote |
| † Electronic supplementary information (ESI) available. See DOI: 10.1039/d0ma00448k |
|
| This journal is © The Royal Society of Chemistry 2020 |
Click here to see how this site uses Cookies. View our privacy policy here. 
 Open Access Article
 This Open Access Article is licensed under a Creative Commons Attribution-Non Commercial 3.0 Unported Licence
 *b and
Narinder
Singh
*b and
Narinder
Singh