DOI:
10.1039/D0MA00442A
(Paper)
Mater. Adv., 2020,
1, 1745-1752
Fabrication of polydiacetylene particles using a solvent injection method†
Received
22nd June 2020
, Accepted 30th July 2020
First published on 30th July 2020
Abstract
Polydiacetylenes (PDAs) are a class of conjugated polymers with unique optical properties that have practical applications in a diverse range of fields. PDA vesicular particles are typically constructed using a thin film hydration method which suffers from a lack of scalability and requires techniques such as sonication and extrusion to control particle size. These procedures are energy-intensive and limit the application of the thin film hydration method to small-scale vesicle production. We present the first application of the solvent injection method to synthesize PDA vesicles as an alternative method of high throughput production. PDA vesicles are constructed from a range of DA monomers that vary in their total carbon chain length and were analyzed using transmission electron microscopy, dynamic light scattering, and zeta potential measurements. Using the solvent injection method, we found longer alkyl chain length monomers produce smaller particles that are more easily photopolymerized. The function of the PDA is verified for the detection of ammonia gas. 8,10-Henicosadiynoic acid is nominated as the optimum PDA system as it has a moderate chain length which results in both optimum morphology and ammonia detection sensitivity. The results from this study suggest that the solvent injection method is a viable alternative to the thin film hydration method for large scale PDA particle production.
Introduction
Polydiacetylenes (PDAs) are a class of conjugated polymers exhibiting unique optical properties that render them ideal for the construction of colorimetric sensors to detect chemical and biological analytes.1–5 They are synthesized from diacetylene (DA) monomers that undergo photopolymerization (by 254 nm UV light) via a 1,4-addition reaction to generate a polymeric backbone with alternating C![[double bond, length as m-dash]](https://www.rsc.org/images/entities/char_e001.gif) C and C
C and C![[triple bond, length as m-dash]](https://www.rsc.org/images/entities/char_e002.gif) C bonds (ene-yne). Subjecting PDA to stimuli – such as light, heat, pH or a chemical/biological recognition event – can induce a perturbation in the polymer structure. This alters the effective conjugation length, producing a characteristic blue to red color transition that can be easily detected by the naked eye (a shift in absorbance wavelength from 640 nm (blue phase) to 540 nm (red phase)). Carboxy-terminated diacetylene monomers are amphiphilic and readily self-assemble into vesicles in solution. This orients the monomers favorably for photopolymerization and provides an excellent format for functionalization with recognition elements by insertion in or conjugation to the vesicle bilayer.1–9
C bonds (ene-yne). Subjecting PDA to stimuli – such as light, heat, pH or a chemical/biological recognition event – can induce a perturbation in the polymer structure. This alters the effective conjugation length, producing a characteristic blue to red color transition that can be easily detected by the naked eye (a shift in absorbance wavelength from 640 nm (blue phase) to 540 nm (red phase)). Carboxy-terminated diacetylene monomers are amphiphilic and readily self-assemble into vesicles in solution. This orients the monomers favorably for photopolymerization and provides an excellent format for functionalization with recognition elements by insertion in or conjugation to the vesicle bilayer.1–9
The conventional method for synthesis of PDA vesicles is the thin film hydration method (Bangham method) which was developed in 1965 for the production of liposomes from phospholipids.10 Using this method, DA monomers are first dissolved in a suitable polar solvent, typically chloroform or ethanol. The solvent is then evaporated to leave a thin film of DA monomer. The film is hydrated at a temperature greater than the phase transition temperature of the monomer and a heterogeneous mixture of multilamellar vesicles (MLVs) is spontaneously formed. This method is fast and easy which has seen its widespread adoption in lab-scale synthesis of PDA vesicles. Unfortunately, the film hydration method suffers from several drawbacks that limit its application in industrial-scale synthesis. Heterogeneous mixtures of MLVs are undesirable so the vesicles are often subjected to extrusion, sonication, or high-pressure homogenization to produce monodispersed populations of small unilamellar vesicles (SUVs). These procedures can destroy incorporated recognition elements or vesicle cargo. They must also be conducted above the phase transition temperature of the monomers. As the phase transition temperature of DA monomers is quite high (50–80 °C), these techniques become difficult and highly energy-intensive.
Herein, we propose the solvent injection method as a suitable alternative for the synthesis of PDA vesicles over the thin film hydration method (Fig. 1). The solvent injection method was first developed in 1973 to prepare liposomes,11 however its application to PDA vesicle synthesis has not yet been investigated. In this method, we first dissolve the DA monomers in a polar solvent (in this case ethanol). The DA solvent solution is then slowly added to an aqueous medium at above the phase transition temperature of the monomer under vigorous stirring. The ethanol is evaporated, and the amphiphilic diacetylenes self-assemble into vesicles. In the construction of liposomes, it has been demonstrated that control over solvent injection flow rate, lipid concentration, lipid type, and solvent ratio dictate the size and lamellarity of the vesicles.12–16 Optimization of these parameters can yield SUV liposomes without the need for secondary procedures as required in the film hydration method. As a result, this method shows great promise for large scale production of PDA vesicles.
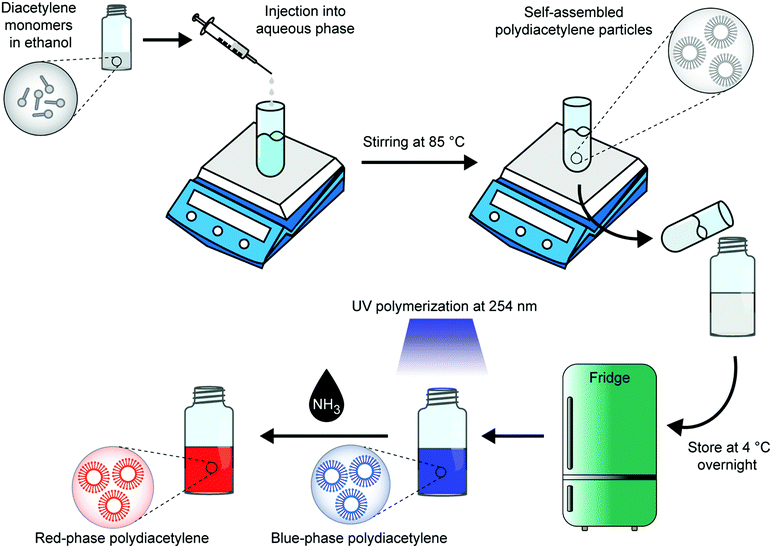 |
| | Fig. 1 Schematic illustration of polydiacetylene (PDA) vesicle synthesis using a solvent injection method. Diacetylene monomers are dissolved in a polar solvent (e.g., ethanol) and then slowly added to an aqueous medium at above the phase transition temperature of the monomer under vigorous stirring. The ethanol is evaporated and the amphiphilic diacetylene monomers self-assemble into vesicles. The diacetylene vesicles are left to anneal at 4 °C and then undergo photopolymerization by 254 nm UV light yielding blue-phase PDA. Subjecting PDA to stimulus, for example ammonia, induces a characteristic blue to red color transition that can be easily detected by the naked eye. | |
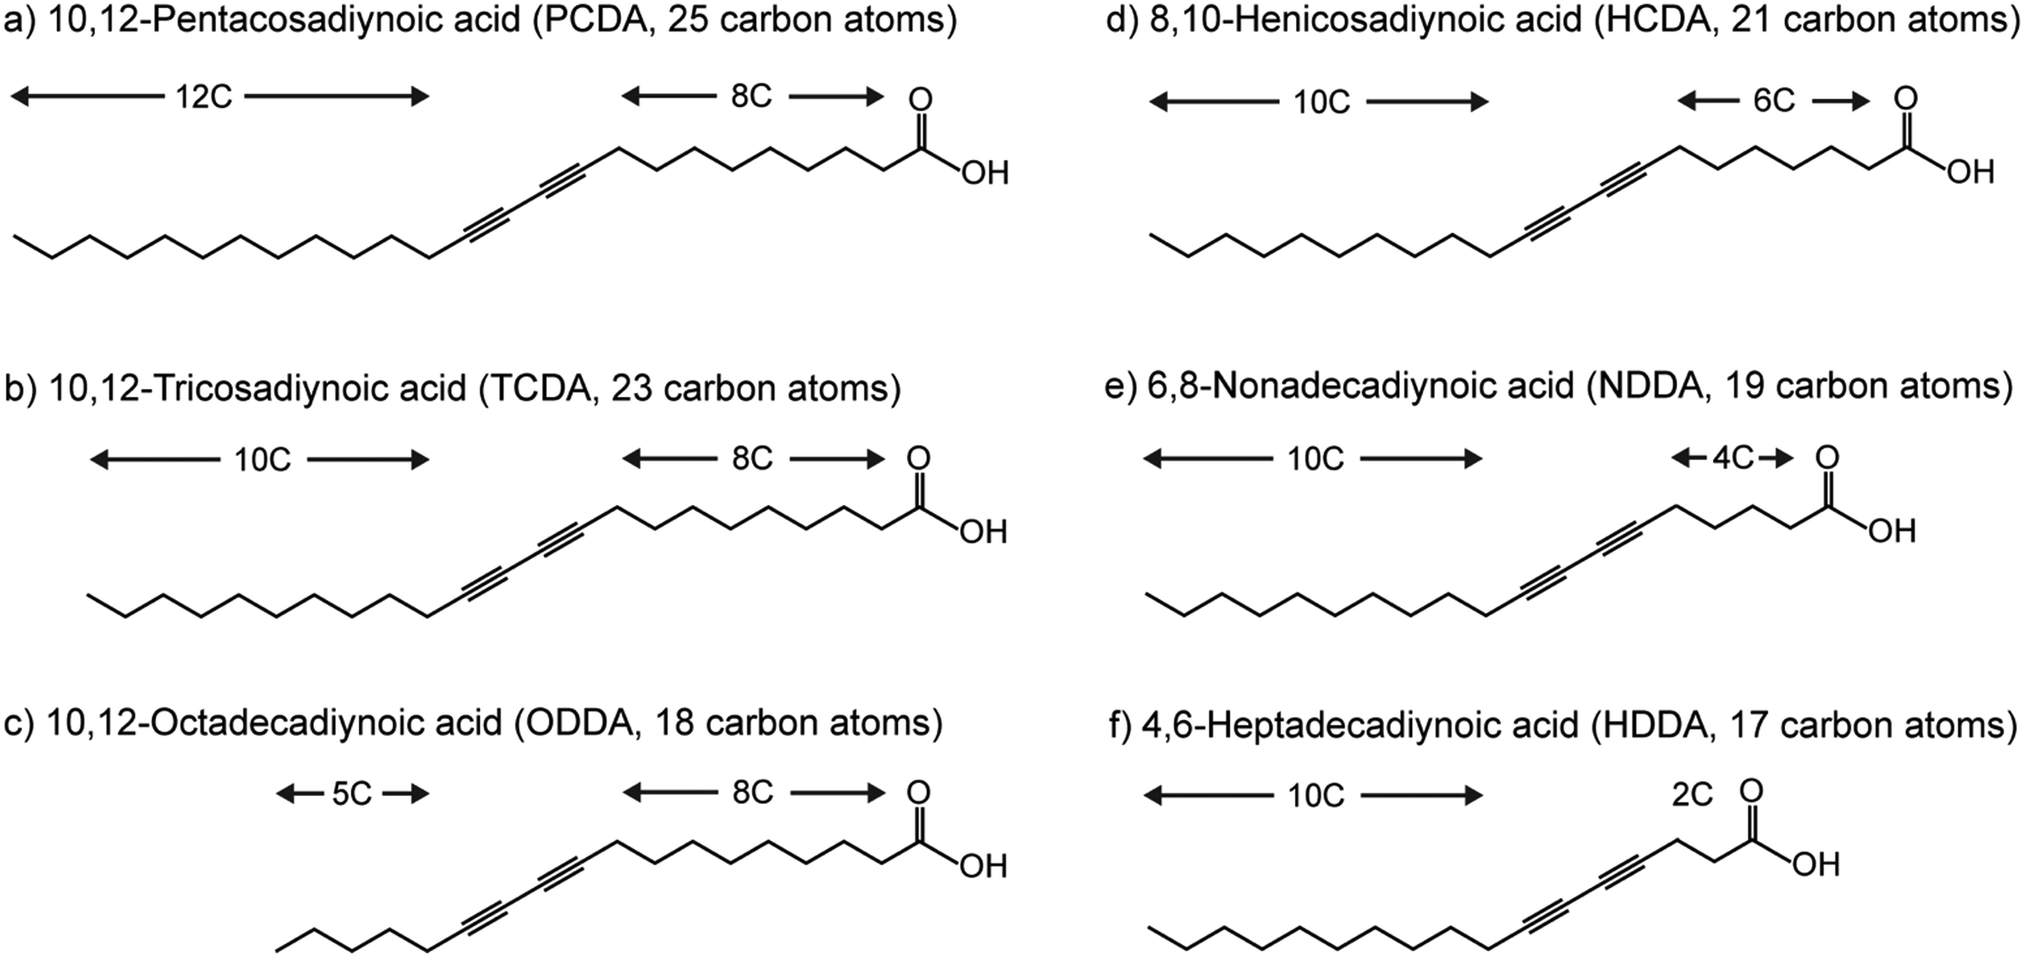
Recently, we discussed how the selection of the DA monomer can be used to tune the chromatic response, sensitivity, and specificity of PDA sensors.1 Herein we present the first investigation of the solvent injection method for the construction of PDA vesicular particles and test its applicability to a range of DA monomers (Fig. 2). The monomers vary in their total carbon chain length, alkyl spacer length, and alkyl tail length. The success of this synthetic method is demonstrated by studying the formation and morphology of the particles, their ability to be photopolymerized, and their chromatic properties.
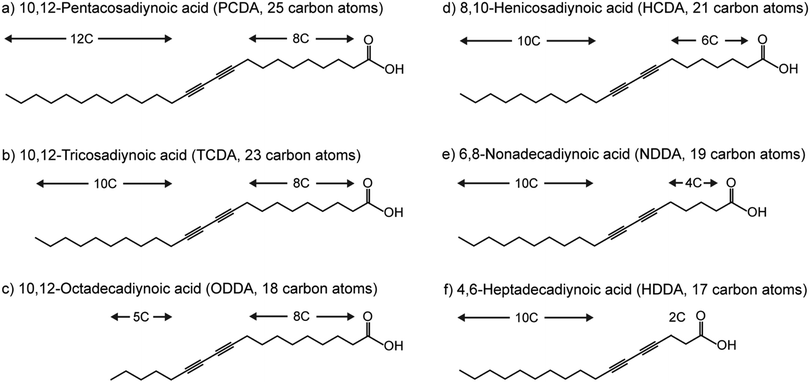 |
| | Fig. 2 Chemical structures of diacetylene monomers used to synthesize polydiacetylene in this study. | |
Materials and methods
Materials
Diacetylene monomers 10,12-pentacosadiynoic acid (PCDA) (>97%), 10,12-tricosadiynoic acid (TCDA) (>98%), and 5,7-hexadecadiynoic acid (HDDA) (97%) were purchased from Sigma-Aldrich (Australia). Diacetylene monomers 10,12-octadecadiynoic acid (ODDA) (95%), 8,10-henicosadiynoic acid (HCDA) (97%), and 6,8-nonadecadiynoic acid (NDDA) (96%) were purchased from Fujifilm Wako Chemicals (USA). Ethanol absolute and ammonia 30% solution were purchased from Chem Supply (Australia). All chemicals were used as received without further purification. Ultrapure water (18.2 MΩ cm−1 resistance) was provided by arium® pro Ultrapure Water Systems (Sartorius).
Synthesis of PDA vesicles
DA monomers were dissolved in ethanol (8 mg ml−1, 500 μl) and injected into a vial containing 10 ml of water at 20 μl min−1 flow rate. During the solvent injection process, the solution was maintained at 85 °C under constant stirring at 1000 rpm. After the DA monomer injection step was complete, the DA/ethanol/water mixture was incubated for further 1 h at 85 °C and 1000 rpm to allow for ethanol evaporation (see ESI†). The self-assembled DA vesicles in water (at 0.4 mg ml−1 monomer concentration) were allowed to cool to room temperature and then stored at 4 °C overnight. Photo-induced polymerization was carried out under 254 nm UV irradiation (UV lamp LF-206.LS, 6W, UVITEC, UK) for 5 minutes to obtain blue-phase PDA.
PDA characterization
Dynamic light scattering (DLS) and zeta potential.
The size and surface charge of PDA particles were determined with a Zetasizer Nano ZS (Malvern, UK; 4 mW He–Ne laser, λ0 = 633 nm, θ = 173°). To measure the size, 1 ml of the PDA samples was transferred to a disposable cuvette (DTS0012) without dilution and equilibrated at room temperature for 5 min. Each sample was measured three times, each measurement consisting of 6 individual runs. The values for the viscosity (0.8872 cP) and refractive index (1.330) of the solvent were the ones provided by the Zetasizer software (V. 7.13). The data were analyzed using the general purpose non-negative least squares (NNLS) fitting algorithm, with a size range analysis of 0.4–10![[thin space (1/6-em)]](https://www.rsc.org/images/entities/char_2009.gif) 000 nm. The vesicles’ size and standard deviation were calculated from the intensity distributions. Zeta potential measurements were collected using a disposable folded capillary cell (DTS1070), containing 0.6 ml of the sample without dilution.
000 nm. The vesicles’ size and standard deviation were calculated from the intensity distributions. Zeta potential measurements were collected using a disposable folded capillary cell (DTS1070), containing 0.6 ml of the sample without dilution.
Transmission electron microscopy (TEM).
TEM micrographs were obtained using a JEOL1400 TEM (JEOL, Akishima, Japan) operating at an accelerating voltage of 100 keV. Samples were drop cast onto formvar-supported copper grids (ProSciTech, Australia) without staining. The size and morphology of the particles were recorded using a Phurona CCD Camera (Emsis) and Radius software (Emsis).
UV-vis spectrophotometer.
The PDA solutions were transferred to 96-well plates and UV-vis absorption spectra were recorded with a SpectraMax M5 microplate reader (Molecular Devices, USA).
Colorimetric response analysis.
The colorimetric response (CR%) is the standard method to quantify blue-to-red color transition of PDA2 and is calculated as:| |  | (1) |
where PB0 and PBf are the initial and final percentages of blue (PB) of the PDA system, respectively. PB is defined as:| | 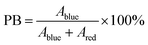 | (2) |
where Ablue is the absorbance value at the selected wavelength for the blue-phase PDA (640 nm) and Ared is the absorbance value at the selected wavelength for the red-phase PDA (540 nm).
Ammonia detection
To verify the functionality of the PDA formed using the solvent injection method, we chose ammonia gas as an example of a target analyte. Ammonia 30% w/w solution was first diluted to ammonia 1% w/w solution with ultrapure water. Varying volume of ammonia 1% solution was added into glass containers (600 ml): 5.06 μl (100 ppm), 15.18 μl (300 ppm), 25.30 μl (500 ppm), 50.59 μl (1000 ppm), 75.88 μl (1500 ppm), and 101.18 μl (2000 ppm). PDA solutions (250 μl) in glass vials were exposed to ammonia gas in air-tight glass containers and the color changes of the PDA were monitored over time. The gas phase concentration of ammonia was determined by the ideal gas law equation:where P is the pressure (1 atm), V is the volume of ammonia gas (L), n is the amount of ammonia gas (mol), R is the ideal gas constant (0.08206 L atm mol−1 K−1), T is the room temperature (298.15 K).
Results and discussion
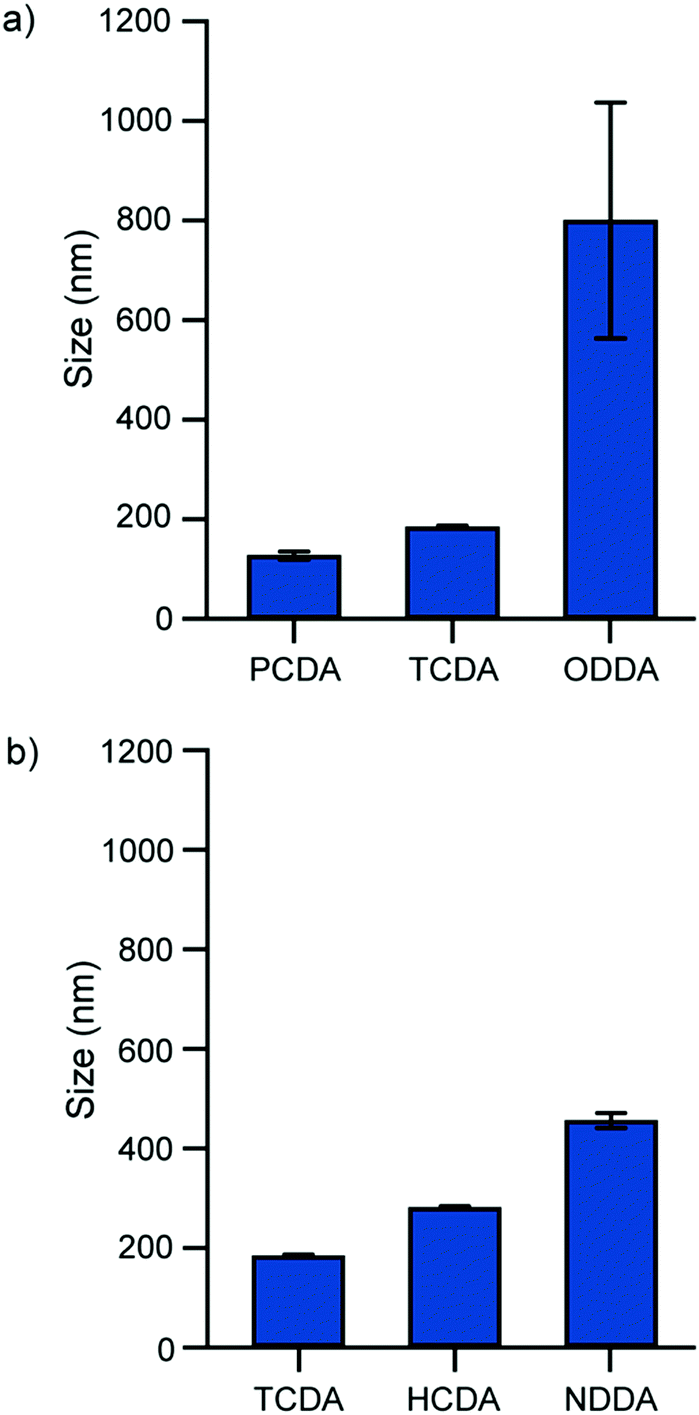
The solvent injection method was employed to synthesize PDA particles from a range of DA monomers. To determine the method's efficacy, a study on the particle size and morphology by DLS and TEM was conducted to confirm colloid formation. Different amphiphilic DA monomer building blocks self-assembled to form vesicles of a characteristic size with their diameters ranging from 127.2 nm to 800.3 nm (Table 1). Longer chain monomers (PCDA 25C; TCDA 23C; HCDA 21C) formed smaller particles with a narrow size distribution (polydispersity index (PDI) ∼ 0.1) compared with shorter chain monomers (NDDA 19C; ODDA 18C). The longer chain monomers have larger intermolecular forces which have been shown to facilitate vesicle formation.17 Monomers with the same length alkyl spacers but longer alkyl tails formed smaller particles (Fig. 3a). Monomers with shorter alkyl spacers between the carboxylic acid head group and the diacetylene group formed larger particles (Fig. 3b). The positioning of the diacetylene group may impact monomer flexibility and its ability to form compact vesicles.
Table 1 Size (from the intensity plot), polydispersity index, and surface charge of PDA particles formed using a solvent injection method
| Monomers |
Diameter (nm) |
PDI |
Zeta potential (mV) |
| PCDA (25C) |
127.2 ± 58.3 |
0.129 ± 0.049 |
−32.2 ± 8.6 |
| TCDA (23C) |
184.1 ± 59.9 |
0.068 ± 0.023 |
−29.0 ± 6.8 |
| HCDA (21C) |
281.9 ± 91.3 |
0.072 ± 0.027 |
−26.7 ± 6.7 |
| NDDA (19C) |
456.1 ± 130.7 |
0.141 ± 0.044 |
−32.0 ± 7.1 |
| ODDA (18C) |
800.3 ± 237.1 |
0.767 ± 0.174 |
−26.9 ± 7.5 |
| HDDA (17C) |
Particle aggregation |
 |
| | Fig. 3 (a) Size of PDA particles synthesized from monomers with the same alkyl spacer length and different alkyl tail length. (b) Size of PDA particles synthesized from monomers with different alkyl spacer length and the same alkyl tail length. n = 3, values represent mean ± standard deviation. | |
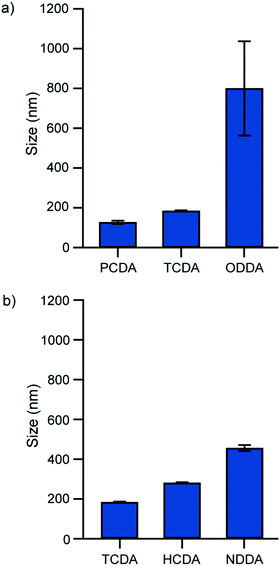
TEM micrographs were obtained to further investigate the morphology of the PDA structures (Fig. 4). Particles formed from long chain monomers (PCDA and TCDA) exhibited a relatively spherical shape, indicating homogenous ordering throughout the PDA structure. As for shorter chain monomers (HCDA and NDDA), rod-shaped and rectangular particles tended to form of a lesser order. ODDA formed both small particles under 100 nm as well as micron-sized structures (see ESI†). These results indicate that at a constant monomer concentration (0.4 mg ml−1) there is a relationship between monomer properties and particle morphology. The TEM micrographs indicate a morphology similar to particles synthesized by the film hydration method,18 confirming the efficacy of the solvent injection method for PDA synthesis.
 |
| | Fig. 4 TEM micrographs of PDA particles synthesized from 5 diacetylene monomers using the solvent injection method. (a) PCDA (25 carbon atoms), (b) TCDA (23 carbon atoms), (c) HCDA (21 carbon atoms), (d) NDDA (19 carbon atoms), and (e) ODDA (18 carbon atoms). | |
DA monomers are amphiphilic and are known to form a thermodynamically favorable bilayer/vesicular structure in an aqueous environment. Despite some disagreement between the exact boundaries of vesicle classification, typically particles with a size range between 20 nm and 100 nm are considered small unilamellar vesicles (SUVs), whilst particles ranging between 100 nm and 300 nm are large unilamellar vesicles (LUVs), and particles with size ≥500 nm are giant unilamellar vesicles (GUVs).19 Based on these classifications, PCDA, TCDA, and HCDA formed LUVs.
The particle charge ranged from −26.9 mV to −32.2 mV (Table 1). The negative surface charge of the PDA vesicles is from partial dissociation of neutral carboxylic head groups into negatively charged carboxylate head groups. Short chain carboxy terminated acids, such as the monomers used in this study, are known to have solution pKa of ∼4.8.20 However, colloids and membrane structures constructed from carboxy terminated constituents are known to exhibit different ionization equilibria with pKas that differ by several orders of magnitude depending on particle structure and packing density.20 All monomers investigated in this study produced particles with a zeta potential of sufficient magnitude to keep the particles suspended in solution.
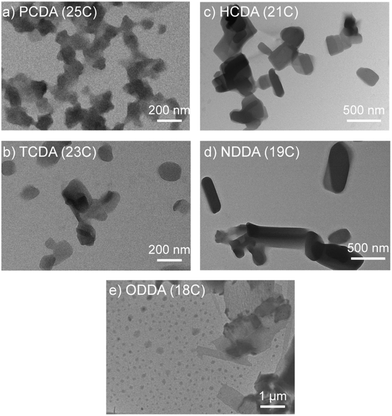
Once PDA particles were formed, they were photopolymerized by 254 nm UV light to yield blue-phase PDA. UV-vis spectroscopy indicated that increasing levels of exposure to UV light increased the color intensity of the blue-phase PDA for all monomers. This is illustrated by the increasing absorbance at the characteristic wavelength of 640 nm (Fig. 5a, c and e). This behavior is expected and is attributed to an increase in the degree of polymerization between neighboring DA monomers upon increased UV exposure.21–23 Okada et al. observed similar results when photopolymerizing PDA vesicles made from monomers of different sizes and head groups.17 Upon exposure to high temperature (65 °C), the PDA vesicles exhibited a characteristic blue to red color transition that could be easily detected by the naked eye and a shift in absorbance peak from 640 nm to 540 nm (Fig. 5b, d, and f).
 |
| | Fig. 5 UV-vis absorption spectra of PDA prepared with different UV irradiation time. Red-phase PDA were obtained by incubating blue-phase PDA at 65 °C. (a), (b) PCDA, (c), (d) TCDA, and (e), (f) HCDA. | |
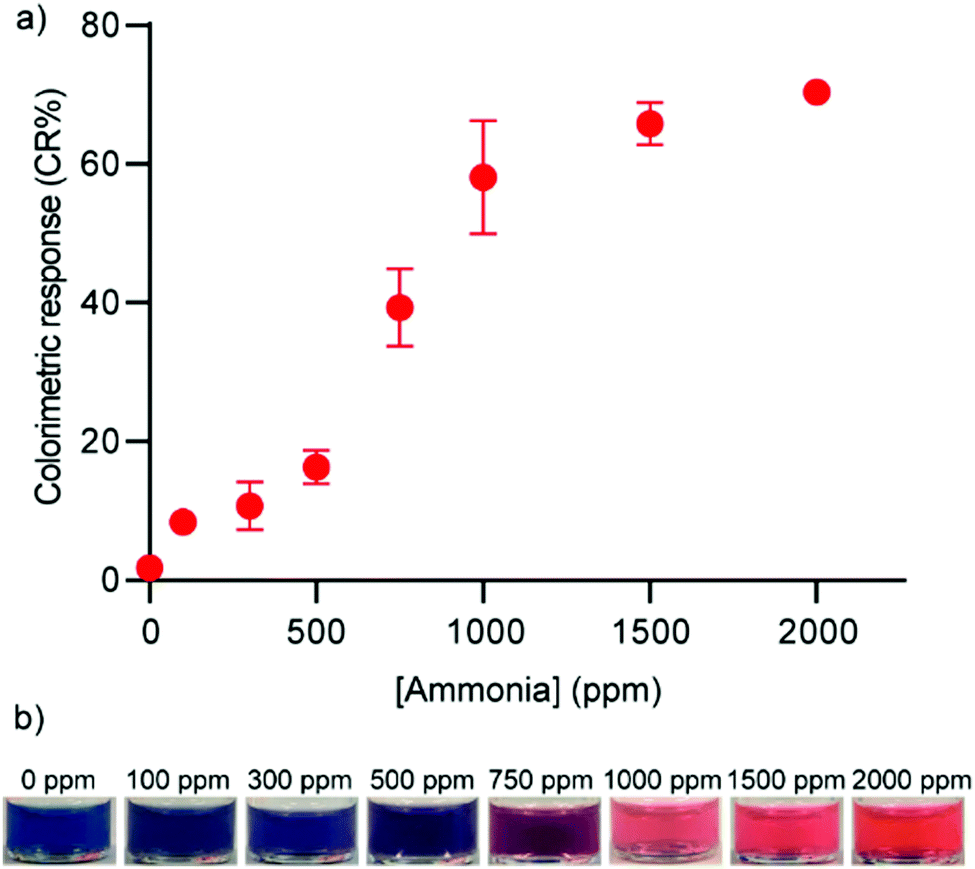
To verify and demonstrate the functionality of the PDA formed using the solvent injection method, we employed them as a colorimetric sensor to detect ammonia gas. Ammonia gas is corrosive and a harmful irritant which can have serious health implications. Ammonia is also an indicator of food spoilage21 and a disease biomarker.24 The detection of ammonia via carboxy-terminated PDA vesicles has been documented in various contexts and formats.21,25,26 Ammonia is a strong base and increases the pH of the PDA environment which encourages dissociation of carboxylic acid head groups. The negatively charged carboxylate head groups repel each other and induce structural rearrangement in the vesicle that produces a blue to red color change.20 When we exposed PDA composed of PCDA, TCDA, or HCDA to ammonia gas at 2000 ppm in a sealed chamber, the solutions underwent a complete blue-to-red color change at t = 90 min, 80 min, and 60 min, respectively. The shorter the alkyl chain length of the monomer, the shorter exposure time required to induce a complete color change. This means that the system can be engineered for greater sensitivity by the selection of shorter chain length monomers. This phenomenon has been documented in systematic studies of the impact of monomer characteristics on sensing properties18,27–30 and has been demonstrated in volatile organic compound detection using PDA.31 We then subjected PDA composed of HCDA to different ammonia concentrations (0–2000 ppm) (Fig. 6a). The resulting color change was detectable by the naked eye when the PDA solution was exposed to ammonia gas more than 500 ppm (Fig. 6b). These results indicate that the PDA particles formed using the solvent injection method maintain their characteristic functional activity upon exposure to ammonia.
 |
| | Fig. 6 (a) Colorimetric response and (b) photographs of HCDA vesicle solutions when exposed to varying concentration of ammonia. n = 3, values represent mean ± standard deviation. | |
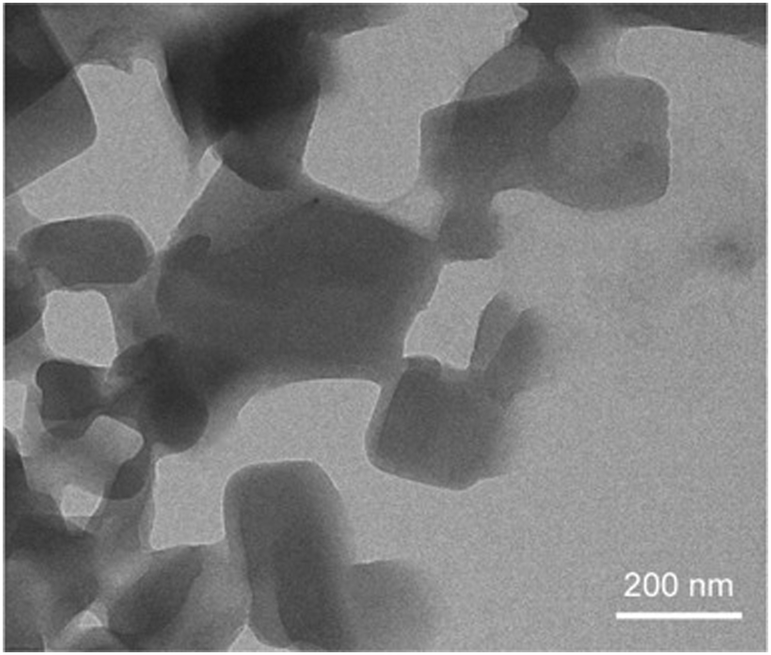
To demonstrate the capability of the solvent injection method to synthesize PDA vesicles for large scale production, experiments on fabricating 10 ml, 100 ml, and 250 ml HCDA vesicle solutions were conducted. A study on the particle size and morphology by DLS and TEM was also conducted to investigate the effect of different scale production on vesicle formation. According to Table 2, HCDA vesicles synthesized under different scales had a similar (within 6% error) characteristic size with an average diameter of ∼280 nm and a narrow size distribution (PDI ∼ 0.1). The particles had a relatively similar surface charge (∼−26 mV). TEM analysis also confirmed the morphology of HCDA vesicles being rectangular in shape when synthesized on a 250 ml batch volume (Fig. 7). Therefore, it is reasonable to conclude that the solvent injection method is suitable to be employed for larger scale PDA vesicle production. After four months, negligible change in size distribution and zeta potential of the PDA vesicles was observed (see ESI†), demonstrating the long-term stability of the PDA vesicles formed via the solvent injection method.
Table 2 Size (from the intensity plot), polydispersity index, and surface charge of PDA composed of HCDA formed under different scales
| Fabrication volume |
Diameter (nm) |
PDI |
Zeta potential (mV) |
| 10 ml |
281.9 ± 91.2 |
0.072 ± 0.027 |
−26.7 ± 6.7 |
| 100 ml |
303.8 ± 109.9 |
0.144 ± 0.015 |
−24.6 ± 7.1 |
| 250 ml |
264.6 ± 89.0 |
0.146 ± 0.088 |
−29.1 ± 7.1 |
 |
| | Fig. 7 A TEM micrograph of PDA composed of HCDA synthesized using the solvent injection method on a 250 ml scale. | |
Conclusions
In conclusion, we have presented the first application of the solvent injection method to successfully synthesize PDA particles from a range of DA monomers with different alkyl chain length and alky spacer length. The formation of self-assembled particles similar to those formed by the film hydration method was confirmed by a study on particle size and morphology using DLS, zeta potential measurements, and TEM imaging. It was found that long chain length monomers formed smaller particles and there exists a relationship between monomer properties and particle morphology. The functionality of the PDA was demonstrated through reactivity with ammonia. PDA vesicles composed of HCDA showed color changes detectable by the naked eye when subjected to ammonia gas >500 ppm. The solvent injection method can be applied to larger scale vesicle production (0.25 L). Compared with the conventional thin film hydration method, the solvent injection technique does not require secondary procedures such as extrusion, sonication, or high-pressure homogenization. PDAs have practical applications in diverse fields, including sensors, drug delivery, and tissue engineering. The ability to perform large-scale manufacturing of PDA structures could accelerate the translational development of these materials.
Conflicts of interest
There are no conflicts of interest to declare.
Acknowledgements
M. W. acknowledges support from the Australian Government Research Training Program Scholarship. K. L. acknowledges support from the National Health and Medical Research Council Career Development Fellowship (NHMRC APP1163786) and the UNSW Scientia Fellowship. R. C. acknowledges support from the National Health and Medical Research Council Emerging Leadership Investigator Grant (NHMRC EL2 APP1173428), the Australian Research Council Discovery Early Career Researcher Award (ARC DECRA DE170100068), and the UNSW Scientia Fellowship. This research used the facilities at the Mark Wainwright Analytical Centre Electron Microscope Unit at UNSW.
References
- M. Weston, A. D. Tjandra and R. Chandrawati, Polym. Chem., 2020, 11, 166–183 RSC.
- J. T. Wen, J. M. Roper and H. Tsutsui, Ind. Eng. Chem. Res., 2018, 57, 9037–9053 CrossRef CAS.
- S. Lee, J. Y. Kim, X. Chen and J. Yoon, Chem. Commun., 2016, 52, 9178–9196 RSC.
- M. Weston, F. Mazur and R. Chandrawati, Smart Sensors Environ. Med. Appl., 2020, 81–102 Search PubMed.
- J. Huo, Q. Deng, T. Fan, G. He, X. Hu, X. Hong, H. Chen, S. Luo, Z. Wang and D. Chen, Polym. Chem., 2017, 8, 7438–7445 RSC.
- E. Lebègue, C. Farre, C. Jose, J. Saulnier, F. Lagarde, Y. Chevalier, C. Chaix and N. Jaffrezic-Renault, Sensors, 2018, 18, 1–16 CrossRef.
- L. H. Nguyen, F. Oveissi, R. Chandrawati, F. Dehghani and S. Naficy, ACS Sens., 2020, 5, 1921–1928 CrossRef CAS PubMed.
- M. Weston, R. P. Kuchel, M. Ciftci, C. Boyer and R. Chandrawati, J. Colloid Interface Sci., 2020, 572, 31–38 CrossRef CAS PubMed.
- M. Weston, R. P. Kuchel and R. Chandrawati, Macromol. Rapid Commun., 2020, 2000172 CrossRef PubMed.
- A. D. Bangham, M. M. Standish and J. C. Watkins, J. Mol. Biol., 1965, 13, 238–252 CrossRef CAS PubMed.
- S. Batzri and E. D. Korn, Biochim. Biophys. Acta, Biomembr., 1973, 298, 1015–1019 CrossRef CAS.
- A. S. Domazou and P. Luigi Luisi, J. Liposome Res., 2002, 12, 205–220 CrossRef CAS PubMed.
- A. Wagner, K. Vorauer-Uhl, G. Kreismayr and H. Katinger, J. Liposome Res., 2002, 12, 259–270 CrossRef CAS PubMed.
- P. Gentine, A. Bubel, C. Crucifix, L. Bourel-Bonnet and B. Frisch, J. Liposome Res., 2012, 22, 18–30 CrossRef CAS.
- J. M. H. Kremer, M. W. Van der Esker, C. Pathmamanoharan and P. H. Wiersema, Biochemistry, 1977, 16, 3932–3935 CrossRef CAS PubMed.
- M. Pons, M. Foradada and J. Estelrich, Int. J. Pharm., 1993, 95, 51–56 CrossRef CAS.
- S. Okada, S. Peng, W. Spevak and D. Charych, Acc. Chem. Res., 1998, 31, 229–239 CrossRef CAS.
- C. Khanantong, N. Charoenthai, T. Phuangkaew, F. Kielar, N. Traiphol and R. Traiphol, Colloids Surf., A, 2018, 553, 337–348 CrossRef CAS.
- S. E. Ahmed, H. G. Moussa, A. M. Martins, M. H. Al-Sayah and G. A. Husseini, Curr. Cancer Drug Targets, 2015, 15, 282–313 CrossRef PubMed.
- S. J. Kew and E. A. H. Hall, Anal. Chem., 2006, 78, 2231–2238 CrossRef CAS PubMed.
- L. H. Nguyen, S. Naficy, R. McConchie, F. Dehghani and R. Chandrawati, J. Mater. Chem. C, 2019, 7, 1919–1926 RSC.
- D. H. Kang, H.-S. Jung, J. Lee, S. Seo, J. Kim, K. Kim and K.-Y. Suh, Langmuir, 2012, 28, 7551–7556 CrossRef CAS PubMed.
- N. Traiphol, K. Faisadcha, R. Potai and R. Traiphol, J. Colloid Interface Sci., 2015, 439, 105–111 CrossRef CAS.
- S. A. Kharitonov and P. J. Barnes, Biomarkers, 2002, 7, 1–32 Search PubMed.
- G. S. Lee, C. Lee, H. Choi, D. J. Ahn, J. Kim, B. P. Gila, C. R. Abernathy, S. J. Pearton and F. Ren, Phys. Status Solidi, 2007, 204, 3556–3561 Search PubMed.
- S. Park, G. S. Lee, C. Cui and D. J. Ahn, Macromol. Res., 2016, 24, 380–384 Search PubMed.
- N. Phonchai, C. Khanantong, F. Kielar, R. Traiphol and N. Traiphol, ACS Appl. Nano Mater., 2019, 2, 4489–4498 Search PubMed.
- A. Kamphan, C. Khanantong, N. Traiphol and R. Traiphol, J. Ind. Eng. Chem., 2017, 46, 130–138 Search PubMed.
- A. Chanakul, R. Traiphol and N. Traiphol, Colloids Surf., A, 2016, 489, 9–18 CrossRef CAS.
- A. Chanakul, N. Traiphol, K. Faisadcha and R. Traiphol, J. Colloid Interface Sci., 2014, 418, 43–51 CrossRef CAS PubMed.
- H. Jiang, Y. Wang, Q. Ye, G. Zou, W. Su and Q. Zhang, Sens. Actuators, B, 2010, 143, 789–794 CrossRef CAS.
Footnote |
| † Electronic supplementary information (ESI) available. See DOI: 10.1039/d0ma00442a |
|
| This journal is © The Royal Society of Chemistry 2020 |
Click here to see how this site uses Cookies. View our privacy policy here. 
 Open Access Article
 This Open Access Article is licensed under a Creative Commons Attribution-Non Commercial 3.0 Unported Licence
 a,
Kang
Liang
a,
Kang
Liang