
 Open Access Article
 This Open Access Article is licensed under a Creative Commons Attribution-Non Commercial 3.0 Unported Licence
Boosted carrier mobility and enhanced thermoelectric properties of polycrystalline Na0.03Sn0.97Se by liquid-phase hot deformation†
Hao
Sun
ab,
Chang
Tan
b,
Xiaojian
Tan
 *b,
Hongxiang
Wang
b,
Yinong
Yin
b,
Yuexin
Song
ab,
Guo-Qiang
Liu
b,
Jacques G.
Noudem
c,
Quanguo
Jiang
a,
Jianfeng
Zhang
a,
Huajie
Huang
*a and
Jun
Jiang
*b
*b,
Hongxiang
Wang
b,
Yinong
Yin
b,
Yuexin
Song
ab,
Guo-Qiang
Liu
b,
Jacques G.
Noudem
c,
Quanguo
Jiang
a,
Jianfeng
Zhang
a,
Huajie
Huang
*a and
Jun
Jiang
*b
aCollege of Mechanics and Materials, Hohai University, Nanjing, 211100, China. E-mail: huanghuajie@hhu.edu.cn
bNingbo Institute of Materials Technology and Engineering, Chinese Academy of Sciences, Ningbo 315201, China. E-mail: tanxiaojian@nimte.ac.cn; jjun@nimte.ac.cn
cNormandie University, ENSICAEN, UNICAEN, CNRS, CRISMAT, Caen 14000, France
First published on 30th June 2020
Abstract
SnSe emerges as a promising thermoelectric material due to an ultrahigh ZT value in its single crystal while polycrystalline SnSe offers much lower ZTs resulting from the weak texturing degree. Here, we report a liquid-phase hot deformation technique to enhance the texturing degree of polycrystalline Na0.03Sn0.97Se, leading to a significantly boosted carrier mobility of 30.1 cm2 V−1 s−1 at room temperature and a remarkable average power factor of 5.73 μW cm−1 K−2 between 300 and 830 K. Moreover, the liquid-phase hot deformation procedure introduces dense dislocation defects and realizes an obviously reduced lattice thermal conductivity of 0.40 W m−1 K−1 at 747 K. Consequently, a peak ZT of 0.9 at 780 K and a high average ZTave of 0.49 from 300 to 830 K were obtained for the polycrystalline Na0.03Sn0.97Se sample. This work indicates that liquid-phase hot deformation is a convenient and energy-saving strategy to enhance the texturing degree and improve the thermoelectric performance in polycrystalline SnSe materials.
1. Introduction
In the last few decades, thermoelectric (TE) materials have drawn great attention due to their capacity of direct conversion between heat and electricity.1–5 The conversion efficiency of TE materials is quantified by the dimensionless figure of merit ZT = α2σT/κ, where α is the Seebeck coefficient, σ is the electrical conductivity, κ is the thermal conductivity (including the carrier κe and lattice κl contributions), and T is the operating temperature. The excellent TE performance could be realized by increasing the power factor (PF = α2σ) or compressing the thermal conductivity as much as possible.6–8 Usually, several strategies such as resonant doping,9,10 band convergence11–13 and carrier concentration optimization14,15 can effectively increase the power factor, while the lattice thermal conductivity κl can be reduced by the all-scale hierarchical structuring16–19 and dense defects20–23 as phonon scattering centers.As an emerging TE material, the earth-abundant and environmentally-friendly binary compound tin selenide (SnSe) has attracted widespread attention owing to its intrinsic ultralow thermal conductivity24–26 and record-high ZT values for both p-type (2.6 at 923 K)27 and n-type (2.8 at 773 K)28 SnSe single crystals. Although the SnSe single crystals exhibit high ZTs, their poor mechanical properties severely limit their practical application in devices. Given this, polycrystalline SnSe has been expected to improve the mechanical properties, but their corresponding ZTs are much lower than those of the single crystals.29–37 This is mainly because of their low oriented degree in polycrystalline samples, in other words, the poor texturing degree of polycrystalline SnSe leads to low electrical conductivity. Many previous studies have shown that the preferred orientation of polycrystalline SnSe grains is beneficial for improving the electronic transport properties.38,39 The widely-used zone melting (ZM) is an efficient method to obtain good orientation, but the products still had poor mechanical properties.40,41 Therefore, there is a need to develop advanced textured sintering methods to prepare polycrystalline SnSe samples with good orientation and mechanical properties.
The liquid-phase sintering (LPS) method was successfully used to enhance the texturing degree and mechanical properties of layered TE materials, such as Bi0.5Sb1.5Te3 and SnSe.42,43 For example, the Na-doped SnSe polycrystalline samples were surrounded by the liquid phase of Te during the sintering process. The optimized orientation led to a greatly improved PFave of 6.01 μW cm−1 K−2 and a higher ZTave of 0.45 between 300 and 830 K.43 Besides, the hot deformation (HD) process was also applied to promote grain alignment and enhance texture modulation in Na-doped SnSe polycrystalline samples. Resulting from the increased μH by texturing in the HD process, a peak ZT value of 1.3 was achieved with a high PF of 10.2 μW cm−1 K−2.44 Obviously, both LPS and HD processes contribute to texture modulation and result in better electronic properties as well as mechanical properties in SnSe-based materials. Nevertheless, the HD procedure is somewhat complicated and energy-consuming with poor repeatability,44–48 while the LPS process may induce a higher thermal conductivity.43,49–51
Recently, the liquid-phase hot deformation (LPHD) technique was proposed in n-type Bi2(Te,Se)3 alloys.52 This unconventional process combined the advantages of LPS and HD closely, generating the excellent TE properties. In this work, we used the LPHD method to prepare polycrystalline SnSe-based materials. During the sintering process, the Na0.03Sn0.97Se solid grains were initially surrounded by the liquid phase Te. Meanwhile, the prepared samples were gradually deformed in a larger graphite die with the extrusion of liquid phase Te. The recrystallization and orientation optimization of grains occurred by plastic deformation. As a result, an enhanced carrier mobility μH and a reasonably reduced lattice thermal conductivity were realized for the enhancement of TE properties in the LPHD polycrystalline Na0.03Sn0.97Se samples.
2. Experimental details
2.1 LPHD synthesis of polycrystalline Na0.03Sn0.97Se
Polycrystalline Na0.03Sn0.97Se samples alloyed with different Te ratios (x = 0, 5 and 15 wt%) were prepared by melting high-purity raw materials in stoichiometric ratios (Sn granules, 5 N; Se granules, 5 N; Na chunk, 3 N; Te chunk, 5 N) in 10 mm vacuum-sealed quartz tubes (10−4 Torr). The mixtures were melted at 1193 K for 1 h in the rocking furnace, ensuring composition homogeneity. The quartz tubes were then kept upright and air-cooled to form regular bulks. The obtained conical ingots were planished up and down to the cylinders (about 30 mm in height and 10 mm in diameter), and directly hot-deformed in larger ϕ 16 mm graphite dies at 753 K under 60 MPa for 15 min parallel to the circular axis direction of the cylinder. In particular, in order to ensure Te extrusion and HD occurring simultaneously, the ingots stayed at 725 K (melting point of Te) for 5 min, and then pressure was applied slowly. Finally, the high-density LPHD samples of 8 mm in height and 16 mm in diameter were obtained.2.2 Characterization
The phase structures and grain orientation were characterized by X-ray diffraction (XRD, Bruker D8, Germany), using Cu Kα radiation (λ = 1.5406 Å). The chemical compositions and morphology were determined using energy dispersive spectroscopy (EDS, HKL MAX, Oxford Instruments) and scanning electron microscopy (SEM, Quanta FEG 250, FEI Co), respectively. The microstructures were investigated by using transmission electron microscopy (TEM, JEOL2100 HR).2.3 Thermoelectric measurements
The electrical conductivity (σ) and Seebeck coefficient (α) were measured simultaneously using a ZEM-3 (Ulvac-Riko, Japan) from 300 to 830 K in a helium atmosphere. The thermal conductivity was determined by κ = ρCPD, where ρ is the sample density, CP is the specific heat capacity, and D is the thermal diffusivity. The density ρ was measured using the Archimedes principle, the thermal diffusivity D was measured using the laser flash method (Netzsch, LFA-457, Germany), and the specific heat capacity Cp was obtained from previous reports.27 Both the electronic and thermal transport properties were measured perpendicular to the pressure direction. The carrier concentration (n) and mobility (μ) were obtained from n = 1/eRH and μ = σRH, where the Hall coefficient RH was measured using a physical properties measurement system (Quantum Design, PPMS-9, US).3. Results and discussion
3.1 XRD and morphology characterization
Fig. 1a shows the powder XRD patterns of the Na0.03Sn0.97Se–x%Te (x = 0, 5 and 15) polycrystalline samples at different prepared processes, including the loose melted bulk before HP, the dense sintered bulks after LPHD, and the ejected materials during the LPHD process. Before HP, the main peaks of SnSe (JCPDS #48-1224) and elemental Te (JCPDS #36-1452) appeared. After HP, there were only peaks for the SnSe phase observed because of the reason that the elemental Te was “squeezed out” during the LPHD process. As shown in Fig. S1 of the ESI,† the extrudate in the x = 15 sample was more than that in the x = 5 sample. Consistent with previous reports,42,43,49 the extrudate was also elemental Te as observed from the XRD results. | ||
| Fig. 1 (a) Powder XRD patterns for Na0.03Sn0.97Se–5%Te in different processes; (b) bulk XRD patterns for Na0.03Sn0.97Se–x%Te (x = 0, 5 and 15) measured on the surface perpendicular to the pressing direction. | ||
The XRD patterns for the bulk samples were measured on the surface perpendicular to the pressure direction as shown in Fig. 1b. All diffraction peaks can be indexed to the orthorhombic phase with a space group Pnma phase without any obviously detectable second phase. It can be seen that the intensities of the (400) and (111) reflection peaks were different among these samples, suggesting that the preferred orientation of LPHD samples seems to be parallel to the (400) plane. Moreover, the (400) peaks shifted toward lower angles with the increasing Te content, which probably results from the thimbleful of Te atoms which entered the Se sites and thereby increased the unit cell volume (see Fig. S2 of the ESI†).
To evaluate the texture degree of the Na0.03Sn0.97Se–x%Te LPHD samples, the orientation factor F of the (hkl) plane was calculated using the Lotgering method by the following equations:
 | (1) |
 | (2) |
 and
and  are the total of all relative intensities of (hkl) for randomly and preferentially oriented samples, respectively.53 The high F value indicates the high orientation degree of the grains. As shown in Table 1, the orientation factor F(400) increases from 0.26 for the initial sample to 0.50 for the Na0.03Sn0.97Se–5%Te sample, indicating that the LPHD process enhance the texture for the compressed samples. However, with more element Te added to liquid-phase sintering, the F(400) value of the Na0.03Sn0.97Se–15%Te sample decreases to 0.32.
| Samples (x content) | ρ (g cm−3) | Relative density (%) | F(400) |
|---|---|---|---|
| x = 0 | 5.76 | 93.1 | 0.26 |
| x = 5 | 6.03 | 97.5 | 0.50 |
| x = 15 | 6.08 | 98.5 | 0.32 |
To further examine the textured structure, the SEM microscopic characterizations of the Na0.03Sn0.97Se–x%Te (x = 0, 5 and 15) LPHD samples are presented in Fig. 2. The initial Na0.03Sn0.97Se sample without the addition of Te exhibits disorderedness and less orientation, similar to most polycrystalline SnSe after the HP process.54,55 However, the grains of the LPHD samples were refined and aligned in order, consistent with the enhanced orientation factor F(400) values.41,43,44 On the one hand, the liquid Te promotes the crystal plane slipping and preferred orientation during the sintering process. On the other hand, the hot deformation process boosts the inversion and recrystallization of the grains. Thus, the combined process of the LPHD technique can enhance the degree of texture of the SnSe-based material effectively. The grain size of the LPHD samples increased significantly compared with the initial sample, in particular, the Na0.03Sn0.97Se–5%Te sample possessed the largest average grain size. Such a phenomenon was also observed in previous reports about SnSe and other layered TE materials,56–58 and it was closely related to the electronic properties.
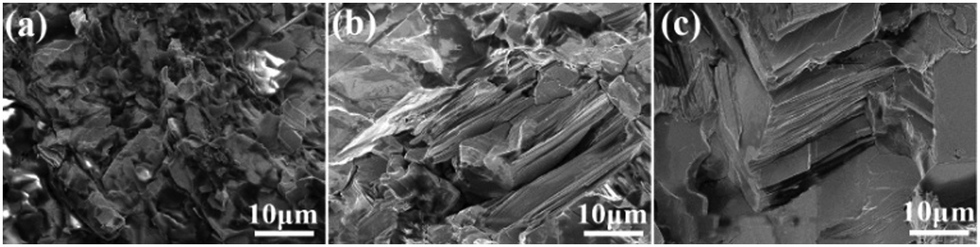 | ||
| Fig. 2 The SEM image of the fractured surfaces parallel to the pressure direction for the Na0.03Sn0.97Se–x%Te samples with (a) x = 0, (b) x = 5, and (c) x = 15. | ||
Furthermore, the compositional homogeneity of the sample was confirmed by the back scattered electron image and EDS results shown in Fig. S3 in the ESI.† The results of Na0.03Sn0.97Se–15%Te indicated that the content of Na is much lower than the nominal one and a thimbleful of Te is also observed in the lattice, consistent with the above XRD results.
3.2 Electronic transport properties
The electronic transport properties of all samples perpendicular to the pressing direction are summarized in Fig. 3. Fig. 3a shows the temperature-dependent electrical conductivity σ of the Na0.03Sn0.97Se polycrystalline samples. For LPHD samples, σ firstly decreased with increasing temperature until ∼670 K and then increased slightly, similar to the changing tendency of the single crystal.25,27 It can be seen that the LPHD technique significantly improved the σ of the Na0.03Sn0.97Se–x%Te samples near room temperatures. Especially for x = 5, the σ reached a maximum value of 218 S cm−1 at 303 K. Compared to the results of HD and LPS methods, the σ of the LPHD sample increased by about 50% and 30%, respectively.43,44 Moreover, the LPHD samples exhibited excellent electrical properties during the whole temperature range. For example, the σ of the Na0.03Sn0.97Se–5%Te sample at 810 K was 74 S cm−1, which was still higher than those of other polycrystalline SnSe.31,34,35,55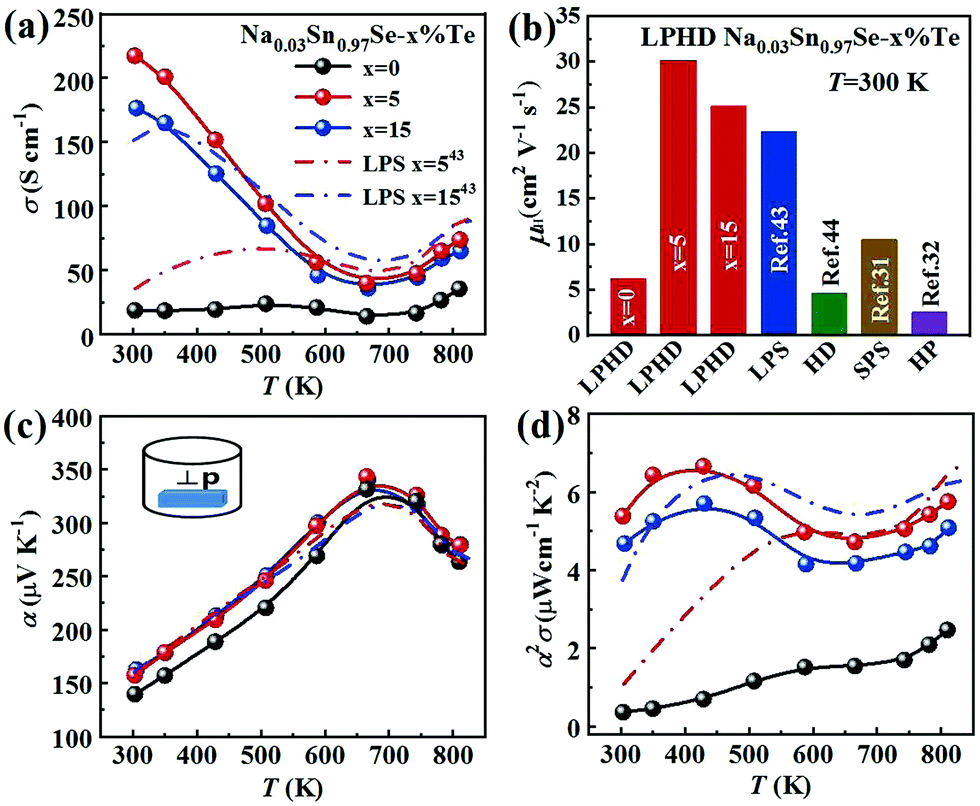 | ||
| Fig. 3 Temperature dependence of Na0.03Sn0.97Se–x%Te (x = 0, 5 and 15) LPHD samples: (a) electrical conductivity, (b) room temperature Hall mobility with some previous reports as a comparison, (c) Seebeck coefficient and (d) power factor. | ||
Fig. 3b and Table 2 present the room temperature carrier concentration (n) and carrier mobility (μH) of the LPHD samples. Similar to the results of previous HD and LPS samples,43,44 the carrier concentrations of the LPHD samples increased slightly and remained at a relatively stable level, mainly owing to the residual Te dopants that generated Sn vacancies.59,60 More importantly, the room temperature carrier mobility improved significantly due to the enhancement of the texture degree. It can be seen that the carrier mobility increases obviously from 6.2 to 30.1 cm2 V−1 s−1 of LPHD–5%Te, which is much higher than those of LPS43 and HD samples.44 A rapidly increased mobility was also observed in previous reports, and it may be due to the barrier-like scattering originated from oxidation, defects or impurities at the grain boundaries of SnSe materials.61–63 The liquid Te may fill the grain gaps and thus reduce the oxidation and defects at the grain boundaries. Additionally, the stress induced by plastic deformation could be released in a timely manner by the extrusion of liquid Te during the HD process. As a result, the weakened grain boundary scattering by the LPHD process significantly improves the carrier mobility. Nevertheless, too much liquid Te (such as 15%Te) would wrap and lubricate the crystal grains, leading to a lower reduction in carrier mobility unexpectedly. As discussed above, the LPHD process enlarged the grain size and the corresponding texture degree was significantly raised (see the F values in Table 1), which were beneficial for the carrier mobility and electrical conductivity.
| Methods | ρ (g cm−3) | n (1019 cm−3) | μ H (cm2 V−1 s−1) | α (μV K−1) |
|---|---|---|---|---|
| ZM | 6.04 | 0.051 | 166 | — |
| HD | 5.72 | 2.67 | 4.7 | 198 |
| LPS | 6.03 | 3.16 | 22.3 | 145 |
| LPHD-0%Te | 5.76 | 1.89 | 6.2 | 139 |
| LPHD-5%Te | 6.03 | 4.51 | 30.1 | 158 |
| LPHD-15%Te | 6.08 | 4.39 | 25.1 | 163 |
Fig. 3c shows the temperature dependence of Seebeck coefficient (α). The relatively high α of all samples were positive, exhibiting p-type transport behavior. With the increasing temperature, the Seebeck coefficients first increased to the maximum and then decreased. The peak value was 327 μV K−1 at 680 K obtained in Na0.03Sn0.97Se–5%Te. Above 680 K, the reduction of α in all samples could be attributed to the thermal excitation of minority carriers (bipolar effect). Compared to the sample without Te addition, the α of Na0.03Sn0.97Se–x%Te increased obviously. It may be a result of the suppression of bipolar effect with improved carrier concentration.43,52
As shown in Fig. 3d, the LPHD samples exhibited a much higher PF (α2σ) than the LPS one due to the significantly increased electrical conductivity. The maxima of α2σ were found to be 6.65 μW cm−1 K−2 at 430 K and 5.75 μW cm−1 K−2 at 830 K for Na0.03Sn0.97Se–5%Te. It is worth noting that the PF value at room temperature is 5.38 μW cm−1 K−2, which is the highest value observed in SnSe-based materials except for SnSe single crystals. Due to the enhanced texture degree, the PF of all LPHD samples were maintained at higher values in the whole temperature range, particularly for Na0.03Sn0.97Se–5%Te. The average PFave of Na0.03Sn0.97Se–5%Te was 5.62 μW cm−1 K−2, which was much higher than most p-type polycrystalline SnSe.32,44,60,64 Such enhanced α2σ was mainly attributed to the optimized texture degree and significantly improved electrical properties during the LPHD process.
3.3 Thermal conductivity and ZT value
Fig. 4a presents the total thermal conductivity κ of all samples as functions of temperature. All the κ gradually reduced with increasing temperature and then an upturn appeared around 743 K, arising from the Pnma–Cmcm phase transition. The LPHD samples, especially the Na0.03Sn0.97Se–5%Te one, exhibited a lower κ than the one without excess Te in the whole temperature range. It is worthy to note that κ was significantly suppressed during the combined LPHD process as compared with the LPS method under the same condition.43 The lowest κ value was 0.45 W m−1 K−1 at 743 K for the Na0.03Sn0.97Se–5%Te LPHD sample.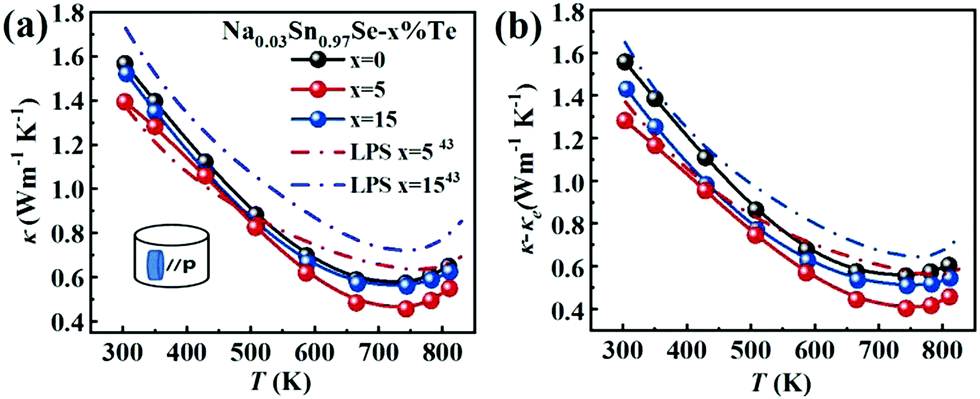 | ||
| Fig. 4 Temperature dependences of (a) thermal conductivity; (b) lattice thermal conductivity. The data for the LPS samples are plotted for comparison.43 | ||
The electronic thermal conduction κe (see Fig. S4 of the ESI†) is proportional to σ according to the Wiedemann–Franz law κe= LTσ, where the Lorenz number L was calculated by fitting the respective Seebeck coefficient values to the reduced chemical potential. Then, the lattice thermal conduction κl was evaluated by κl = κ − κe. Fig. 4b presents the temperature-dependent κl of the LPHD and previous LPS samples.43 Very different from the previously reported LPS samples with the addition of Te, the κl of the LPHD samples was obviously lower in the whole temperature range, which was mainly due to the introduced defects during the plastic deformation. As shown, the lowest κl value was obtained as 0.40 W m−1 K−1 in the x = 5 LPHD sample at 743 K.
To better understand the reduced κl of the LPHD samples, TEM analysis was carried out on the Na0.03Sn0.97Se–x%Te (x = 0, 5) samples. Mesoscale grains with sizes around 0.5–1 μm were observed in the sample as shown in Fig. 5a (x = 0) and b (x = 5). It can be clearly seen that the typical areas in Fig. 5b marked as 1 and 2 possess many strain-field domains, which were ascribed to a dislocation effect in the previous report.65 The high-resolution TEM (HRTEM) image of region 1 in Fig. 5b was shown in Fig. 5c. Fig. 5d presents the inverse Fourier transformation (IFFT) image along the (400) plane reflections of the red box region in Fig. 5c, in which many dislocation defects can be readily observed. Moreover, interface regions with selenium precipitates and a SnSe2 second phase embedded in the matrix can be seen from the HRTEM images and EDS results shown in Fig. S6 and Table S1 in the ESI.† These emerged phonon scattering centers during the LPHD process may strengthen the phonon scattering and decrease the κl. Additionally, similar to many previous LPS results of Bi2Te3 and SnSe,42,43,52 excess Te addition led to a slightly increased κl in the Na0.03Sn0.97Se–x%Te samples, which needs further investigation in the future.
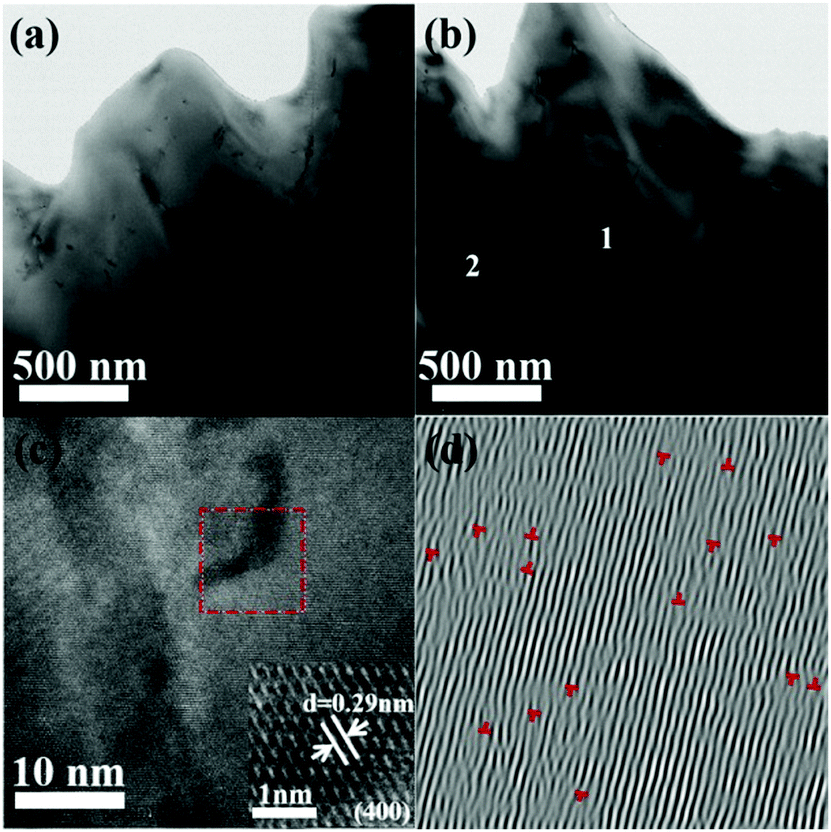 | ||
| Fig. 5 Microstructure of the LPHD samples: (a) low-magnification TEM image of Na0.03Sn0.97Se-0%Te; (b) low-magnification TEM image of Na0.03Sn0.97Se–5%Te with the defects in the matrix; (c) HRTEM image from (b) the region marked 1 with the FFT image and its interplanar spacing; (d) inverse FFT image of the red box in panel (c) obtained from the (400) reflection. | ||
Fig. 6a displays the temperature dependence of ZT values for all samples. As shown, the ZTs were roughly increased with the increasing temperature. The maximum ZT value was 0.9 at 780 K for the Na0.03Sn0.97Se–5%Te sample. Since the PFs were limited at a higher temperature, such a peak ZT was not very competitive compared with those inrevious reports.19,20,36,44 However, compared with the results of normal LPS or HD methods, a higher averaged ZT value (ZTave) was achieved using the LPHD technique as summarized in Fig. 6b. Between the temperature range of 300 to 810 K, our LPHD-prepared polycrystalline Na0.03Sn0.97Se exhibited a ZTave of 0.49, which was obviously higher than the previous reported Na0.03Sn0.97Se polycrystalline samples.31,32,43,44,60 The improved ZTs at a lower temperature resulted from both the high carrier mobility in a more textured structure and the obvious reduction of κl by the enhanced phonon scattering.
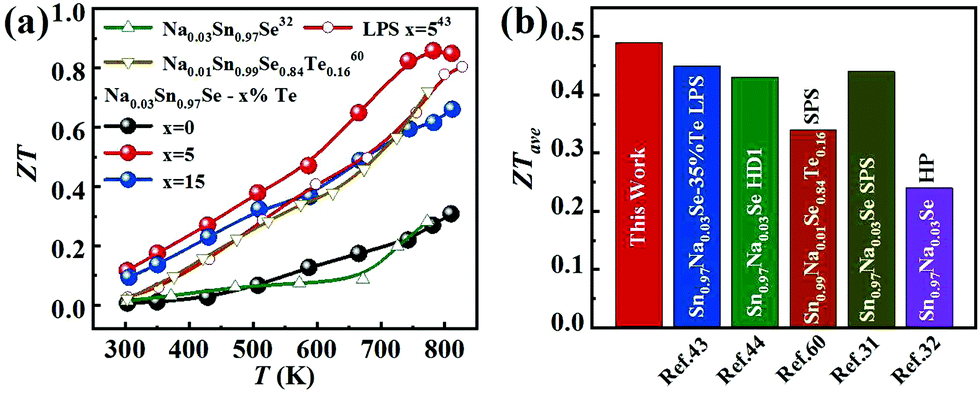 | ||
| Fig. 6 (a) Temperature dependence of ZT for LPHD samples; (b) average ZT values from 300 to 810 K for our Na0.03Sn0.97Se–5%Te LPHD sample and other previously reported polycrystalline Na0.03Sn0.97Se samples.31,32,43,44,60 | ||
4. Conclusions
In summary, polycrystalline Na0.03Sn0.97Se–x%Te (x = 0, 5 and 15) samples were successfully prepared using a convenient and low-cost LPHD technique, which combined the advantages of the LPS and HD processes. For the electronic transport, the texture of the sample was significantly enhanced and the grains showed a strong orientation along the (400) plane. The carrier mobility was effectively boosted, leading to a higher electrical conductivity and power factor around room temperature. For the phonon transport, dense dislocation defects and SnSe2 precipitates emerged during the LPHD process. These defects increased the phonon scattering rate and obviously reduced the lattice thermal conductivity. With these synergistical effects, a maximum ZT of 0.9 at 780 K and an average ZT value of 0.49 between 300 and 810 K were obtained in the Na0.03Sn0.97Se–5%Te LPHD materials. This work provides a novel technique for realizing high thermoelectric performance in SnSe-based materials through texture modification.Conflicts of interest
There are no conflicts to declare.Acknowledgements
This study was supported by the National Science Foundation of China (51872301 and 21875273), the Natural Science Foundation of Zhejiang Province (LY18A040008), and the Youth Innovation Promotion Association of Chinese Academy of Sciences (2019298).References
- D. M. Rowe, Thermoelectric and Its Energy Harvesting, CRC Press, 2012 Search PubMed.
- L. E. Bell, Science, 2008, 321, 1457–1461 CrossRef CAS PubMed.
- Y. Zheng, Y. Luo, C. Du, B. Zhu, Q. Liang, H. H. Hng, K. Hippalgaonkar, J. Xu and Q. Yan, Mater. Chem. Front., 2017, 1, 2457–2473 RSC.
- A. Sorkina and S. Adams, Mater. Adv., 2020, 1, 184–196 RSC.
- W. S. Liu and S. Q. Bai, J. Materiomics, 2019, 5, 321–336 CrossRef.
- G. J. Tan, L. D. Zhao and M. G. Kanatzidis, Chem. Rev., 2016, 116, 12123–12149 CrossRef CAS PubMed.
- W. Liu, H. S. Kim, Q. Jie and Z. Ren, Sci. Mater., 2016, 112, 3269–3274 Search PubMed.
- C. H. Lee, M. H. Ma, W. H. Li, P. C. Wei, Y. Y. Chen, Y. Zhao and J. W. Lynn, Mater. Today Phys., 2019, 11, 100171 CrossRef.
- J. P. Heremans, V. Jovovic, E. S. Toberer, A. Saramat, K. Kurosaki, A. Charoenphakdee, S. Yamanaka and G. J. Snyder, Science, 2008, 321, 554–557 CrossRef CAS PubMed.
- Y. X. Chen, Z. H. Ge, M. J. Yin, D. Feng, X. Q. Huang, W. Y. Zhao and J. Q. He, Adv. Funct. Mater., 2016, 26, 6836–6845 CrossRef CAS.
- Y. Pei, X. Shi, A. LaLonde, H. Wang, L. Chen and G. J. Snyder, Nature, 2011, 473, 66–69 CrossRef CAS PubMed.
- X. J. Tan, H. X. Wang, G. Q. Liu, J. G. Noudem, H. Y. Hu, J. T. Xu, H. Z. Shao and J. Jiang, Mater. Today, 2018, 7, 35–44 CrossRef.
- L. S. Mao, Y. N. Yin, Q. Zhang, G. Q. Liu, H. X. Wang, Z. Guo, H. Y. Hu, Y. K. Xiao, X. J. Tan and J. Jiang, Energy Environ. Sci., 2020, 13, 616–621 RSC.
- H. R. Yang, J. H. Bahk, T. Day, A. M. S. Mohammed, G. J. Snyder, A. Shakouri and Y. Wu, Nano Lett., 2015, 15, 1349–1355 CrossRef CAS PubMed.
- Z. Zhou, J. Yang, Q. Jiang, D. Zhang, J. Xin, X. Li, Y. Ren and X. He, J. Am. Chem. Soc., 2017, 100, 5723 CAS.
- K. Biswas, J. He, I. D. Blum, C. I. Wu, T. P. Hogan, D. N. Seidman, V. P. Dravid and M. G. Kanatzidis, Nature, 2012, 489, 414–418 CrossRef CAS PubMed.
- T. Zhu, Y. Liu, C. Fu, J. P. Heremans, J. G. Snyder and X. Zhao, Adv. Mater., 2017, 29, 1605884 CrossRef PubMed.
- N. Neophytou, S. Foster, V. Vargiamidis, G. Pennelli and D. Narducci, Mater. Today Phys., 2019, 11, 100159 CrossRef.
- Y. B. Luo, S. T. Cai, X. Hua, H. J. Chen, Q. H. Liang, C. F. Du, Y. Zheng, J. H. Shen, J. W. Xu, C. Wolverton, V. P. Dravid, Q. Y. Yan and M. G. Kanatzidis, Adv. Energy Mater., 2018, 9, 1803072 CrossRef.
- M. M. Li, H. Z. Shao, J. T. Xu, Q. S. Wu, X. J. Tan, G. Q. Liu, M. Jin, H. Y. Hu, H. J. Huang, J. F. Zhang and J. Jiang, J. Materiomics, 2018, 4, 321–328 CrossRef.
- Z. Chen, B. Ge, W. Li, S. Lin, J. Shen, Y. Chang, R. Hanus, G. J. Snyder and Y. Pei, Nat. Commun., 2017, 8, 13828–13836 CrossRef CAS PubMed.
- Y. K. Xiao, G. X. Chen, H. M. Qin, M. L. Wu, Z. P. Xiao, J. Jiang, J. T. Xu, H. C. Jiang and G. J. Xu, J. Mater. Chem. A, 2014, 2, 8512–8516 RSC.
- R. Guo and S. Lee, Mater. Today Phys., 2019, 12, 100177 CrossRef.
- C. W. Li, J. Hong, A. F. May, D. Bansal, S. Chi, T. Hong, G. Ehlers and O. Delaire, Nat. Phys., 2015, 11, 1063–1071 Search PubMed.
- K. L. Peng, X. Lu, H. Zhan, S. Hui, X. D. Tang, G. W. Wang, J. Y. Dai, C. Uher, G. Y. Wang and X. Y. Zhou, Energy Environ. Sci., 2016, 9, 454–460 RSC.
- J. Hong and O. Delaire, Mater. Today Phys., 2019, 10, 100093 CrossRef.
- L. D. Zhao, S. H. Lo, Y. Zhang, H. Sun, G. Tan, C. Uher, C. Wolverton, V. P. Dravid and M. G. Kanatzidis, Nature, 2014, 508, 373–390 CrossRef CAS PubMed.
- C. Chang, M. Wu, D. He, Y. Pei, C.-F. Wu, X. Wu, H. Yu, F. Zhu, K. Wang, Y. Chen, L. Huang, J. F. Li, J. He and L. D. Zhao, Science, 2018, 360, 778 CrossRef CAS PubMed.
- C. L. Chen, H. Wang, Y. Y. Chen, T. Day and G. J. Snyder, J. Mater. Chem. A, 2014, 2, 11171–11176 RSC.
- S. Li, Y. M. Wang, C. Chen, X. Li, W. Xue, X. Wang, Z. Zhang, F. Cao, J. Sui, X. Liu and Q. Zhang, Adv. Sci., 2018, 5, 1800598 CrossRef PubMed.
- K. Peng, H. Wu, Y. C. Yan, L. J. Guo, G. Y. Wang, X. Lu and X. Y. Zhou, J. Mater. Chem. A, 2017, 5, 14053–14060 RSC.
- E. K. Chere, Q. Zhang, K. Dahal, F. Cao, J. Mao and Z. Ren, J. Mater. Chem. A, 2016, 4, 1848–1854 RSC.
- Y. H. Zhu, J. Carrete, Q. L. Meng, Z. W. Huang, N. Mingo, P. Jiang and X. H. Bao, J. Mater. Chem. A, 2018, 6, 7959–7966 RSC.
- N. K. Singh, S. Bathula, B. Gahtori, K. Tyagi, D. Haranath and A. Dhar, J. Alloys Compd., 2016, 668, 152–158 CrossRef CAS.
- D. B. Li, X. J. Tan, J. T. Xu, G. Q. Liu, M. Jin, H. Z. Shao, H. J. Huang, J. F. Zhang and J. Jiang, RSC Adv., 2017, 7, 17906–17912 RSC.
- D. Li, J. C. Li, X. Y. Qin, J. Zhang, H. X. Xin, C. J. Song and L. Wang, Energy, 2016, 116, 861–866 CrossRef CAS.
- F. Li, W. T. Wang, Z. H. Ge, Z. H. Zheng, J. T. Luo, P. Fan and B. Li, Materials, 2018, 11, 203–213 CrossRef PubMed.
- Y. W. Li, F. Li, J. F. Dong, Z. H. Ge, F. Y. Kang, J. Q. He, H. D. Du, B. Li and J. F. Li, J. Mater. Chem. C, 2016, 4, 2047–2055 RSC.
- D. Feng, Z. H. Ge, D. Wu, Y. X. Chen, T. T. Wu, J. Li and J. Q. He, Phys. Chem. Chem. Phys., 2016, 18, 31821–31827 RSC.
- X. Wang, J. T. Xu, G. Q. Liu, Y. J. Fu, Z. Liu, X. J. Tan, H. Z. Shao, H. C. Jiang, T. Y. Tan and J. Jiang, Appl. Phys. Lett., 2016, 108, 083902 CrossRef.
- Y. J. Fu, J. T. Xu, G. Q. Liu, J. K. Yang, X. J. Tan, Z. Liu, H. M. Qin, H. Z. Shao, H. C. Jiang, B. Liang and J. Jiang, J. Mater. Chem. C, 2016, 4, 1201–1207 RSC.
- S. I. Kim, K. H. Lee, H. A. Mun, H. S. Kim, S. W. Hwang, J. W. Roh, D. J. Yang, W. H. Shin, X. S. Li, Y. H. Lee, G. J. Snyder and S. W. Kim, Science, 2015, 348, 109–114 CrossRef CAS PubMed.
- J. H. Zhang, J. Xu, X. J. Tan, H. X. Wang, G. Q. Liu, H. Z. Shao, B. Yu, S. Yue and J. Jiang, J. Mater. Chem. C, 2019, 7, 2653–2658 RSC.
- S. J. Liang, J. T. Xu, J. G. Noudem, H. X. Wang, X. J. Tan, G. Q. Liu, H. Z. Shao, B. Yu, S. Yue and J. Jiang, J. Mater. Chem. A, 2018, 6, 23730–23735 RSC.
- L. P. Hu, H. J. Wu, T. J. Zhu, C. G. Fu, J. Q. He, P. J. Ying and X. B. Zhao, Adv. Energy Mater., 2015, 5, 1500411 CrossRef.
- R. S. Zhai, L. P. Hu, H. J. Wu, Z. J. Xu, T. J. Zhu and X. B. Zhao, ACS Appl. Mater. Interfaces, 2017, 9, 28577–28585 CrossRef CAS PubMed.
- C. Tan, X. J. Tan, B. Yu, G. Q. Liu, H. X. Wang, G. Q. Luo, J. T. Xu, Q. S. Wu, B. Liang and J. Jiang, ACS Appl. Energy Mater., 2019, 2, 6714–6719 CrossRef CAS.
- F. Li, R. S. Zhai, Y. H. Wu, Z. J. Xu, X. B. Zhao and T. J. Zhu, J. Materiomics, 2018, 4, 208–214 CrossRef.
- Y. Liu, Y. Zhang, S. Ortega, M. Ibanez, K. H. Lim, A. Grau-Carbonell, S. Marti-Sanchez, K. M. Ng, J. Arbiol, M. V. Kovalenko, D. Cadavid and A. Cabot, Nano Lett., 2018, 18, 2557–2563 CrossRef CAS PubMed.
- C. H. Zhang, M. D. L. Mata, Z. Li, F. J. Belarre, J. Arbiol, K. A. Khor, D. Poletti, B. B. Zhu, Q. Y. Yan and Q. H. Xiong, Nano Energy, 2016, 30, 630–638 CrossRef CAS.
- R. Deng, X. Su, Z. Zheng, W. Liu, Y. Yan, Q. Zhang, V. P. Dravid, C. Uher, M. G. Kanatzidis and X. Tang, Sci. Adv., 2018, 4, eaar5606 CrossRef PubMed.
- Y. H. Wu, Y. Yu, Q. Zhang, Ti. J. Zhu, R. S. Zhai and X. B. Zhao, Adv. Sci., 2019, 6, 1901702 CrossRef CAS PubMed.
- F. K. Lotgering, J. Inorg. Nucl. Chem., 1960, 16, 100–108 CrossRef CAS.
- T. R. Wei, G. Tan, X. Zhang, C. F. Wu, J. F. Li, V. P. Dravid, G. J. Snyder and M. G. Kanatzidis, J. Am. Chem. Soc., 2016, 138, 8875–8882 CrossRef CAS PubMed.
- Y. M. Han, J. Zhao, M. Zhou, X. X. Jiang, H. Q. Leng and L. F. Li, J. Mater. Chem. A, 2015, 3, 4555–4559 RSC.
- D. Kenfaui, D. Chateigner, M. Gomina and J. G. Noudem, J. Alloys Compd., 2010, 490, 472–479 CrossRef CAS.
- L. P. Hu, X. H. Liu, H. H. Xie, J. J. Shen, T. J. Zhu and X. B. Zhao, Acta Mater., 2012, 60, 4431–4437 CrossRef CAS.
- H. Mun, K. H. Lee, S. J. Yoo, H. S. Kim, J. Jeong, S. H. Oh, G. J. Snyder, Y. H. Lee, Y. M. Kim and S. W. Kim, Acta Mater., 2018, 159, 266–275 CrossRef CAS.
- M. Hong, Z. G. Chen, L. Yang, T. C. Chasapis, S. D. Kang, Y. Zou, G. J. Auchterlonie, M. G. Kanatzidis, G. J. Snyder and J. Zou, J. Mater. Chem. A, 2017, 5, 10713–10721 RSC.
- T. R. Wei, C. F. Wu, X. Z. Zhang, Q. Tan, L. Sun, Y. Pan and J. F. Li, Phys. Chem. Chem. Phys., 2015, 17, 30102–30109 RSC.
- Z. H. Ge, D. S. Song, X. Y. Chong, F. S. Zheng, L. Jin, X. Qian, L. Zheng, R. E. Dunin-Borkowski, P. Qin, J. Feng and L. D. Zhao, J. Am. Chem. Soc., 2017, 139, 9714–9720 CrossRef CAS PubMed.
- Y. K. Lee, K. Ahn, J. Cha, C. J. Zhou, H. S. Kim, G. Choi, S. I. Chae, J. H. Park, S. P. Cho, S. H. Park, Y. E. Sung, W. B. Lee, T. Hyeon and I. Chung, J. Am. Chem. Soc., 2017, 139, 10887–10896 CrossRef CAS PubMed.
- S. Wang, S. Hui, K. L. Peng, T. P. Bailey, X. Y. Zhou, X. F. Tang and C. Uher, J. Mater. Chem. C, 2017, 5, 10191–10200 RSC.
- S. S. Sassi, C. Candolfi, J. B. Vaney, V. Ohorodniichuk, P. Masschelein, A. Dauscher and B. Lenoir, Appl. Phys. Lett., 2014, 104, 212105 CrossRef.
- D. Maier, Solid State Commun., 2002, 122, 565 CrossRef CAS.
Footnote |
| † Electronic supplementary information (ESI) available. See DOI: 10.1039/d0ma00405g |
| This journal is © The Royal Society of Chemistry 2020 |