DOI:
10.1039/D0MA00303D
(Paper)
Mater. Adv., 2020,
1, 2003-2009
Hydrothermally grown novel pyramids of the CaTiO3 perovskite as an efficient electrode modifier for sensing applications†
Received
12th May 2020
, Accepted 10th August 2020
First published on 11th August 2020
Abstract
Herein, we report novel CaTiO3 pyramids, prepared by a hydrothermal approach using calcium nitrate and titanium butoxide in the presence of sodium hydroxide. The physio-chemical properties of the synthesized CaTiO3 pyramids were probed by PXRD, FTIR, BET, SEM and EDX. The synthesized CaTiO3 pyramids possess a good specific surface area which is beneficial for electrochemical applications. Thus, the CaTiO3 pyramids were applied as an electrode modifier to develop an electrochemical sensor. The working surface area of the glassy carbon (GC) electrode was fabricated with CaTiO3 pyramids using the drop casting method. This fabricated electrode was employed to determine urea using the cyclic voltammetry and I–V techniques. The fabricated electrode exhibited a good detection limit of 1.6 μM.
1. Introduction
Urea is present in humans and widely distributed in nature. Urea may cause hepatic failure, urinary tract obstruction, nephritic syndrome, cachexia, dehydration, shock and gastrointestinal problems, if its presence (physiological range 1.33–3.33 mM) changes in the blood serum.1,2 Urea has good solubility in water and is used as a fertilizer. Due to the good solubility of urea in water it may pollute ground and surface water, which can influence human health.1 Thus, the detection of urea is necessary. In previous years, conventional methods such as chemiluminescence, electrochemical methods, high performance liquid chromatography, fluorimetry etc. have been widely used for the detection of urea.3,4 However, the electrochemical technique is found to be one of the most promising approaches for the detection of urea due to its low cost, simplicity, high sensitivity and selectivity.5–7 The performance of electrochemical sensors depends on the nature of the electrode modifiers.8–10 Parsaee et al.11 employed a NiO-NP/GO modified GCE for urea sensing and a detection limit of 8 μM was obtained. Mikani et al.12 used an F-doped SnO2 electrode modified with ZnO–Fe3O4, whereas Sha et al.13 employed graphene–polyaniline for the determination of urea. Naik et al.14 also introduced a nickel sulfide/graphene oxide modified glassy carbon electrode for urea sensing and achieved a detection limit of 3.79 μM. Bao et al.15 developed a urea sensor using ultrathin nickel-metal–organic framework nanobelts and the detection limit was found to be 2.23 μM. Hahn and co-workers have grown ZnO nanorods on Ag/glass and used this for the determination of urea.16 The above observations indicate that electrode modifiers largely influence the performance of the modified electrodes. Therefore, it would be of great importance to design new electrode modifiers.
Recently, perovskite materials with general molecular formula ABO3 have gained enormous attention because of their excellent optoelectronic applications.17 Perovskite materials have been used in a variety of applications such as solar cells, batteries, photo-detectors, light emitting diodes, sensors, fuel cells and photocatalysis.18,19 In 2009, He et al.20 prepared BaTiO3 perovskite nanocubes for the sensing of hydrogen peroxide. Ahmad et al.21 have synthesized a rGO/SrTiO3 composite for the determination of nitro-aromatic compounds. In 2020, Shaikh and co-workers employed an N-rGO/SrZrO3 cuboidal composite for electrochemical determination of hydroquinone.22 Muthukutty et al. also introduced SrSnO3 as an electrode material for sensing applications.23 CaTiO3 has a perovskite structure and possesses good optoelectronic properties and is widely used in photocatalysis.24 The surface morphology of CaTiO3 may influence its physiochemical properties. Previously, CaTiO3 particles were synthesized either by hydrothermal or solvothermal methods. Dong et al.25 have prepared butterfly like dendrites of CaTiO3, whereas Yang et al.26 have obtained CaTiO3 hollow micro-cubes. Kimijima et al.24 also synthesized CaTiO3 cubic particles with controlled size and shape. Wang et al.27 obtained a CaTiO3 nanolamellate using a hydrothermal approach. It is believed that the design and synthesis of nano-materials with new nanostructures are of great importance for the construction of highly efficient electrodes for sensing applications.
Herein, we have synthesized a novel pyramid shaped CaTiO3 perovskite structure using a hydrothermal method and employed it as an electrode material for the electrochemical sensing of urea. To the best of our knowledge, this is the first report on the use of CaTiO3 as electrode materials for urea sensing applications using electrochemical approaches.
2. Materials and methods
2.1. Chemicals and reagents
Calcium nitrate (Ca(NO3)2·4H2O), titanium(IV) butoxide, phosphate buffered saline solutions, sodium hydroxide (NaOH), polyvinylpyrrolidone, urea, hydrogen peroxide (H2O2), ascorbic acid, uric acid, catechol, resorcinol, phenol, dopamine, glucose and other solvents were purchased from Merck, Sigma, SRL, Alfa Aesar and Fischer Scientific, India. All the purchased chemicals/reagents were used without any further purification.
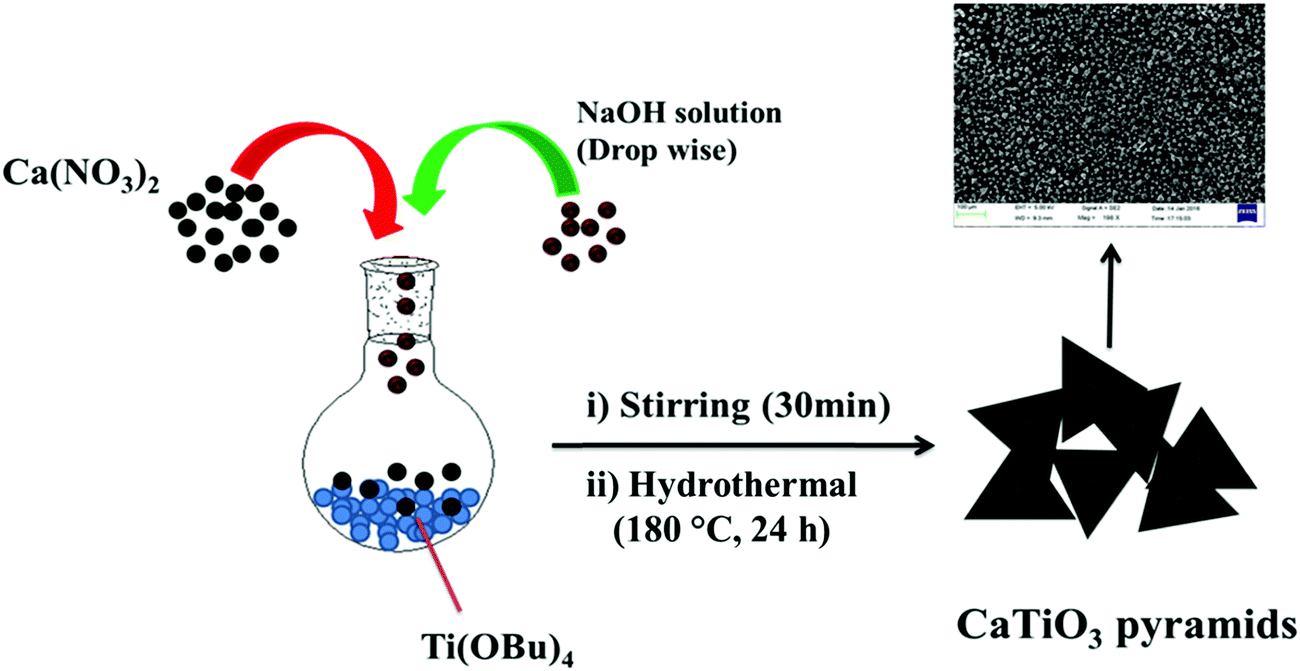
2.2. Synthesis of CaTiO3 pyramids
An aqueous solution (10 mL) of 4 M Ca(NO3)2·4H2O (9.446 gm) and 0.4 mL of titanium butoxide (TiOBu)4 were mixed in a round bottom flask slowly, stirred (rpm = ∼900) for 10 min. 6 gm of sodium hydroxide dissolved in deionized water (15 mL) was added dropwise to the reaction mixture and stirred continuously for 30 min. Finally the reaction mixture was transferred to a 50 mL Teflon-lined stainless steel autoclave and heated for 24 h at 180 °C. The white precipitate was collected by centrifugation and washed with 1 M acetic acid and D.I. water several times to remove the unreacted residues.
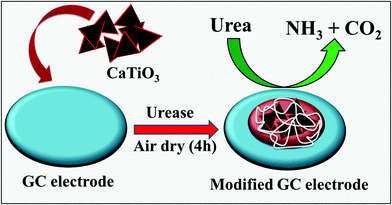
2.3. Preparation of GC-1 and GC-2 electrodes
The active surface area of a glassy carbon (GC) electrode was cleaned with 0.5 μm alumina slurry and washed with D.I. water. CaTiO3 pyramids were dispersed in D.I. water (1 mg mL−1) using an ultra-sonication bath for 1 h. The active surface area (3 mm = 0.07 cm2) of the GC was modified with 10 μL of CaTiO3 pyramids. 1 mg of urease was dissolved in 1 mL of PBS (pH = 7.0) and 10 μL of urease was drop cast on to the CaTiO3 pyramid modified GC electrode to obtain a thin film of urease. Finally 5 μL of 1% polyvinylpyrrolidone (PVP) was also drop cast on to the modified GC (GC/CaTiO3/urease) as a binder. The electrode was kept to dry in air for 4 h. For a controlled experiment, we have modified the GC electrode with urease/PVP. All the modified electrodes were kept in a refrigerator before electrochemical measurements.
3. Results and discussion
3.1. Synthesis of CaTiO3 pyramids
CaTiO3 pyramids were synthesized by mixing calcium nitrate and titanium butoxide in basic medium (NaOH) at 180 °C for 24 h by applying hydrothermal conditions to the reaction mixture (Scheme 1).
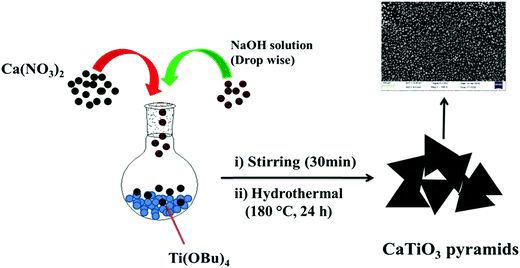 |
| | Scheme 1 Schematic representation of the synthesis of CaTiO3 pyramids. | |
3.2. Physiochemical characterization
The powder X-ray diffraction (PXRD) investigation of the synthesized CaTiO3 was carried out using a RINT 2500V X-ray diffractometer (Rigaku, Japan; Cu Kα irradiation; λ = 1.5406 Å). Fig. 1 displays the recorded PXRD pattern of the synthesized CaTiO3 in the 2θ range of 20–80°. The eight major diffraction peaks observed at 23.03°, 32.83°, 38.7°, 40.43°, 47.30°, 59.06°, 69.27° and 78.72° corresponded to the (110), (112), (103), (211), (220), (204), (224) and (116) planes, respectively. The PXRD results were consistent with previously reported literature (JCPDS no. 86-1393).17,28 The highly intense diffraction peaks suggested the highly crystalline nature of the synthesized CaTiO3. The average crystallite size of the synthesized CaTiO3 was calculated by employing the Debye–Scherrer formula as given in eqn (1) and the average crystallite size of the synthesized CaTiO3 was found to be 96.5 nm.| |  | (1) |
(Herein β = the broadening of the diffraction line while λ = 2.2897 Å.)
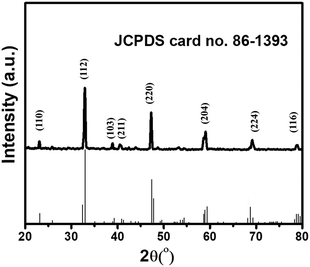 |
| | Fig. 1 PXRD pattern of CaTiO3 pyramids. | |
Further, a Fourier-transform infrared (FTIR) spectroscopic investigation was conducted on a Bio-Rad FTS 300 MX to understand the presence of chemical bonds in the synthesized CaTiO3 (Fig. 2). Fig. 2 shows the recorded FTIR spectrum of the synthesized CaTiO3 in the wavelength range of 4000–400 cm−1. The bands appearing at 3443 and 1639 cm−1 were due to the O–H stretching vibration and deformation of chemisorbed water molecules.18
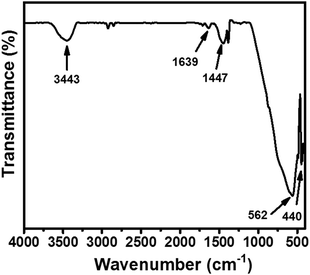 |
| | Fig. 2 FTIR of CaTiO3 pyramids. | |
The band at 1447 cm−1 is assigned to the CO32− bending vibration.29 The band appearing at 440 cm−1 may be assigned to the stretching vibration of Ti–O, whereas the band at 562 cm−1 may be attributed to bridging stretching of Ti–O–Ti.18 This also showed the presence of a TiO6 octahedral environment in the perovskite with ABO3 structure. The obtained FTIR spectrum was found to be in good agreement with previously reported data.18,29
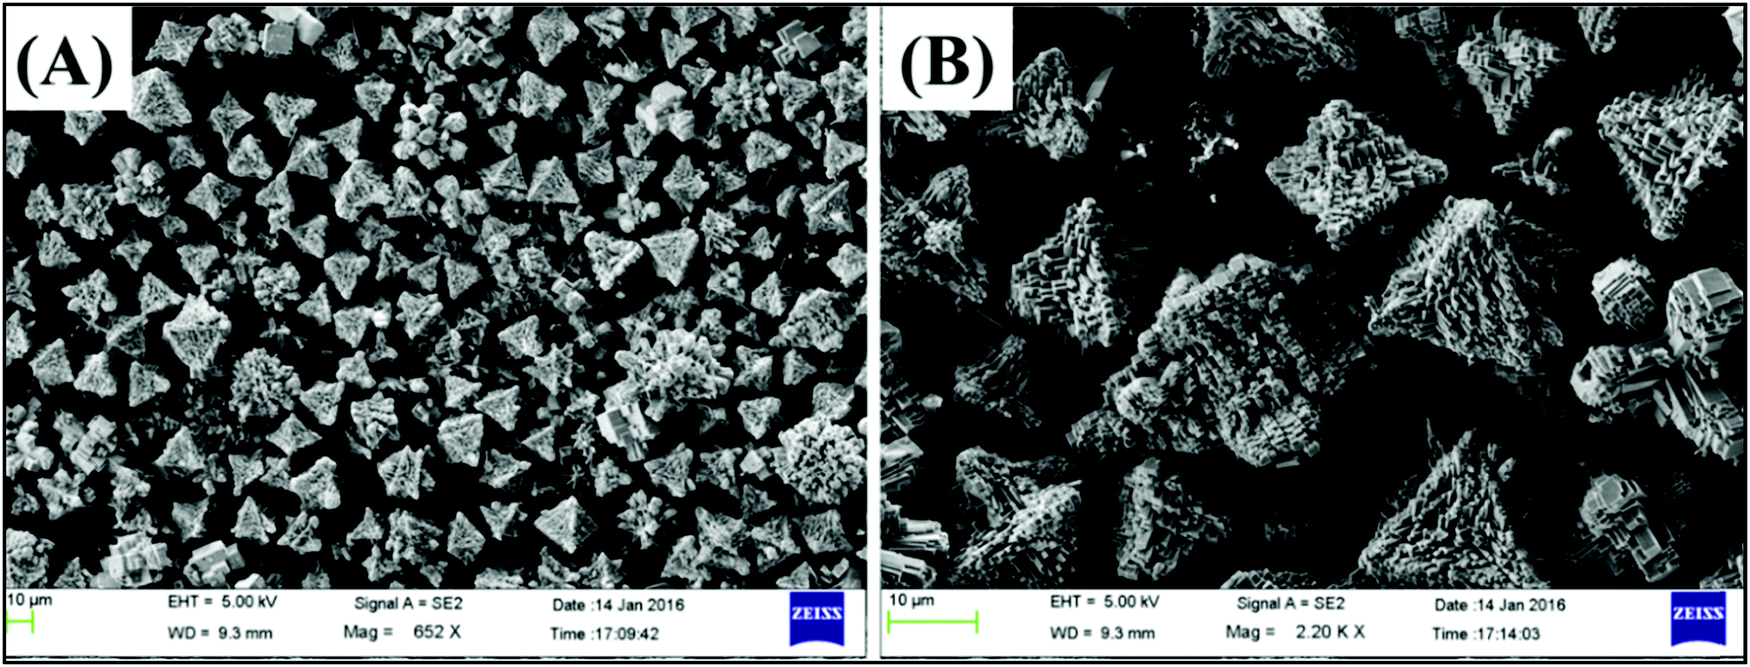
The morphological features of nanomaterials can be affected by the solvent precursor, reaction times, temperature, pH and reactant concentration. It has also been reported that the crystallization mass transport and growth rate of the formation of CaTiO3 can be governed by the reactant concentration. Previously, CaTiO3 with butterfly-like dendrites was reported by using water,25 whereas hollow cubic CaTiO3 was obtained with polyethylene glycol (PEG) as a solvent.26 This showed that the solvent largely influences the particle surface morphology. In the present study, CaTiO3 pyramids were grown using water as a solvent. The particle surface morphology of the synthesized CaTiO3 was checked on an Oxford Instruments X-max, Aztec (Supra 55 Zeiss Field Emission Scanning Electron Microscope = FE-SEM). The recorded FE-SEM images of CaTiO3 have been displayed in Fig. 3 and Fig. S1 (ESI†). The FE-SEM results confirmed the pyramid like surface morphology of CaTiO3. The CaTiO3 pyramids were grown in a uniform and smooth manner as suggested by the FE-SEM results. To the best of our knowledge, the hydrothermal growth of CaTiO3 with a pyramid like surface morphology has been achieved for the first time. The exact growth mechanism is not clear but we believe that NaOH may play a significant role in achieving CaTiO3 pyramids. Nucleation/accumulation was observed at the initial stages (2–4 h) as shown in Fig. S1A and B (ESI†). From 8–18 h, it started to grow in pyramid like structures (Fig. S1C–E, ESI†) and was completely transformed into pyramids of CaTiO3 after 24 h (Fig. S1F, ESI†).
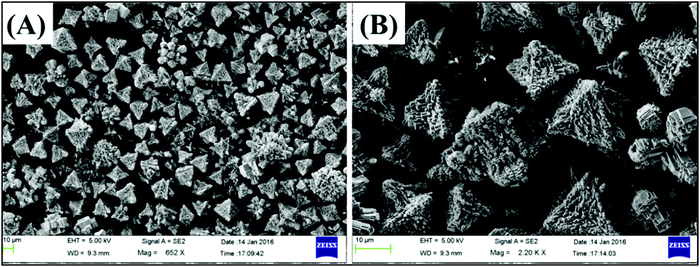 |
| | Fig. 3 FE-SEM images of CaTiO3 pyramids. | |
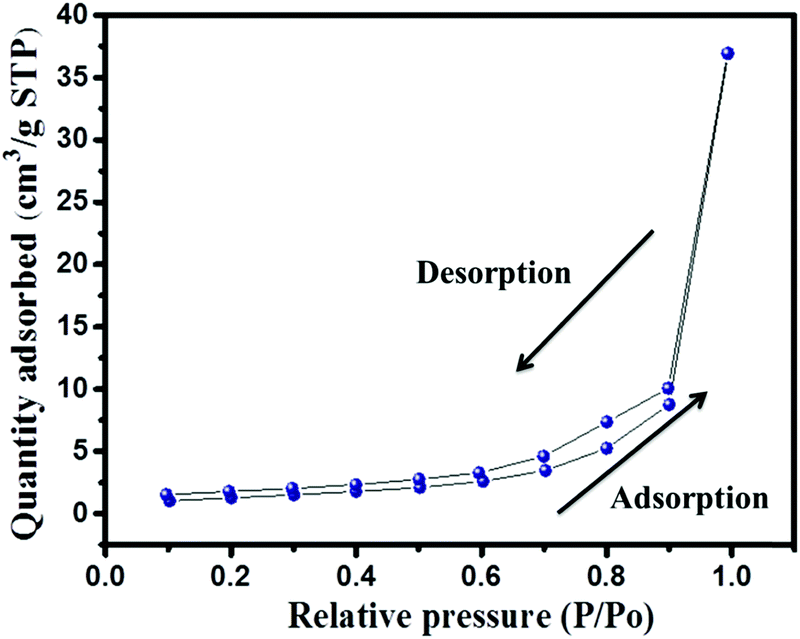
The presence of the elements in CaTiO3 was determined on an energy dispersive X-ray (EDX) spectroscope (Oxford Instruments X-max, Aztec). The elemental spectrum and mapping images of Ca, Ti and O have been presented in Fig. 4A–D, respectively. The EDX investigation confirmed the presence of Ca, Ti and O elements in the CaTiO3 pyramids. Further, the surface area of the synthesized CaTiO3 was calculated by conducting an N2 adsorption–desorption investigation by using the Brunauer–Emmett–Teller (BET) approach (Autosorb iQ version 1.11; Quantachrome Instruments). The obtained adsorption–desorption curve of the synthesized CaTiO3 has been displayed in Fig. 5.
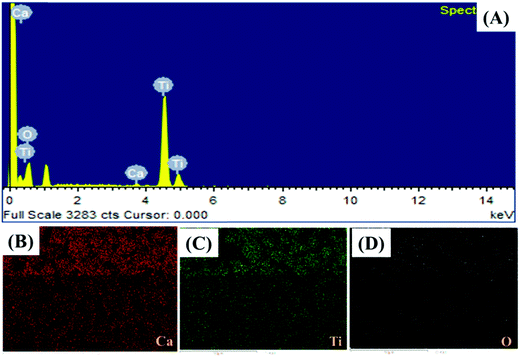 |
| | Fig. 4 EDX analysis of CaTiO3 pyramids. | |
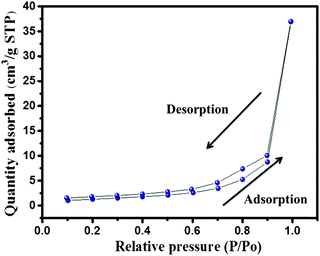 |
| | Fig. 5 N2 adsorption–desorption curve of CaTiO3 pyramids. | |
The specific surface area of the synthesized CaTiO3 was deduced to be 67.5 m2 g−1 (Fig. 5). Hence, it can be proposed that the CaTiO3 perovskite with interesting surface morphology and good surface area may be useful in electrochemical applications. Therefore, we have employed the prepared CaTiO3 pyramids as an electrode modifier for the determination of urea.
3.3. Electrochemical measurements
The electrochemical measurements were carried out on a computer controlled Metrohm Autolab PGSTAT 302N with a three electrode system. The GC electrode was used as the working electrode substrate while platinum wire and Ag/AgCl were used as the counter and reference electrode, respectively. The non-modified GC electrode is denoted as bare GC whereas the GC electrode modified with CaTiO3 pyramids/urease/PVP has been denoted as GC-2. The GC electrode modified with urease/PVP is denoted as GC-1.
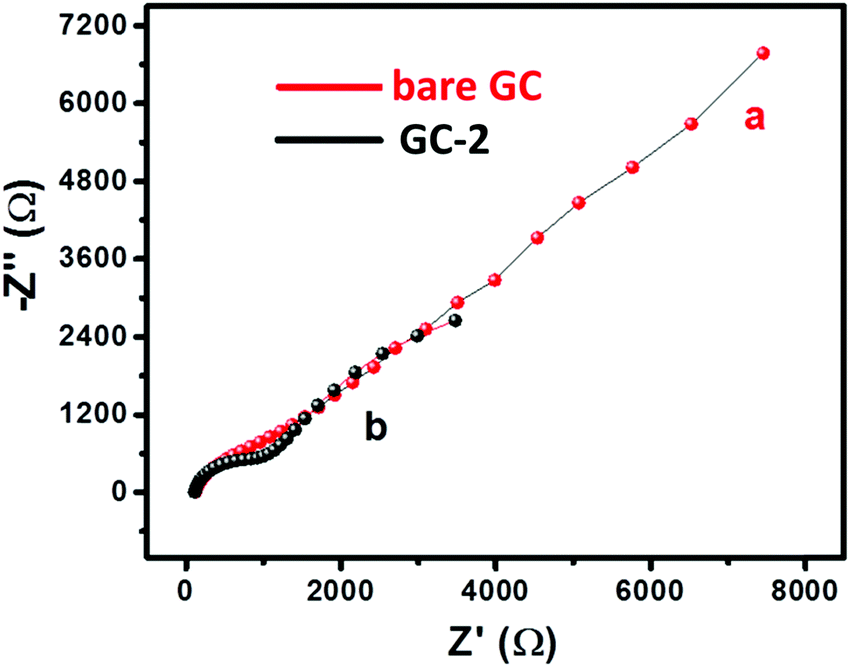
The charge transfer characteristics of the bare GC and GC-2 were investigated using electrochemical impedance spectroscopic (EIS) study. The recorded Nyquist plots of the bare GC and GC-2 were recorded in the presence of 2 mM [Fe(CN)6]3−/4− in 0.1 M PBS (pH = 7.0) with an applied frequency range of 0.01 Hz–100 kHz. Fig. 6 shows the plotted Nyquist plot between the imaginary impedance (−Z′′) and real impedance (Z′). From Fig. 6, it can be seen that the bare GC has high charge resistance whereas GC-2 possesses lower charge resistance. It is well understood that high charge resistance limits the electron transport or electron transfer process. This suggested that GC-2 has good electron transport ability compared to the bare GC due to its low charge resistance.
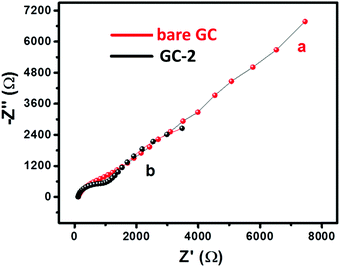 |
| | Fig. 6 Nyquist plot of (a) the bare GC and (b) GC-2 in 2 mM [Fe(CN)6]3−/4− solution in 0.1 M PBS (pH = 7.0). | |
The cyclic voltammetry (CV) and current–voltage (I–V) approaches were used to probe the electrochemical behavior of GC-2. The CV curves of the bare GC and GC-2 were recorded in the presence of 250 μM urea in 0.1 M PBS (pH = 7.0) with an applied scan rate of 0.1 V s−1. The bare GC showed a current response of 6.3 μA whereas GC-2 showed 9.8 μA towards the oxidation of 250 μM urea (Fig. 7). This high current response of GC-2 suggested the successful surface modification of the GC-2 electrode and better electro-catalytic activity towards the oxidation of urea compared to the bare GC. We have also recorded the CV curve of GC-1 to check the reason for this enhanced current response of 9.8 μA. GC-1 exhibited a relatively high current response (7.3 μA) compared to the bare GC, which is due to the presence of catalytic properties in the urease. However, this current response was lower compared to GC-2. This showed that the presence of CaTiO3 pyramids with urease significantly enhanced the current response.
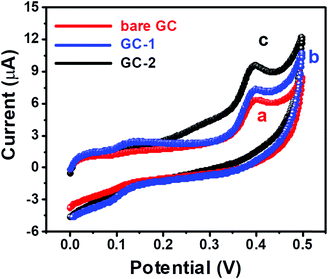 |
| | Fig. 7 CV curves of (a) the bare GC, (b) GC-1 and (c) GC-2 in the presence of 250 μM urea in 0.1 M PBS (pH = 7.0) at an applied scan rate of 0.1 V s−1. | |
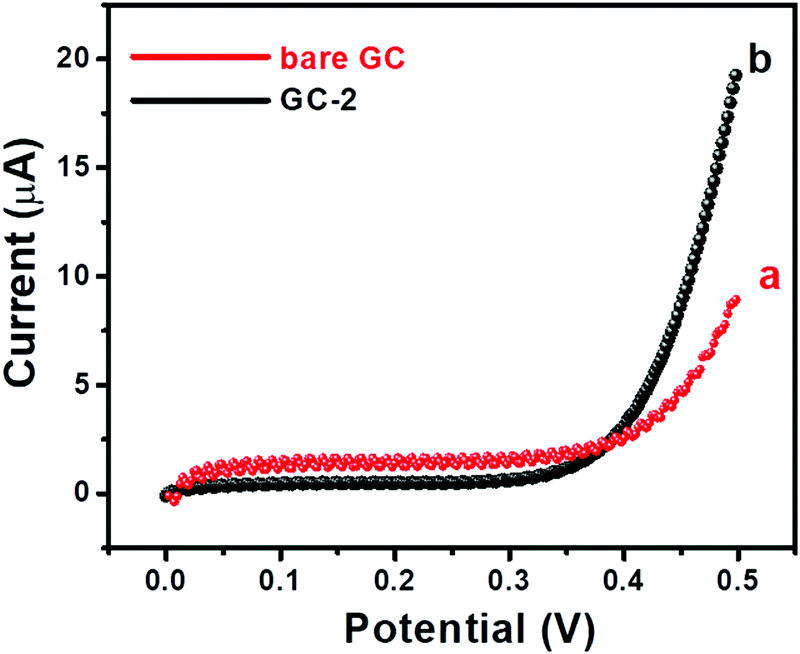
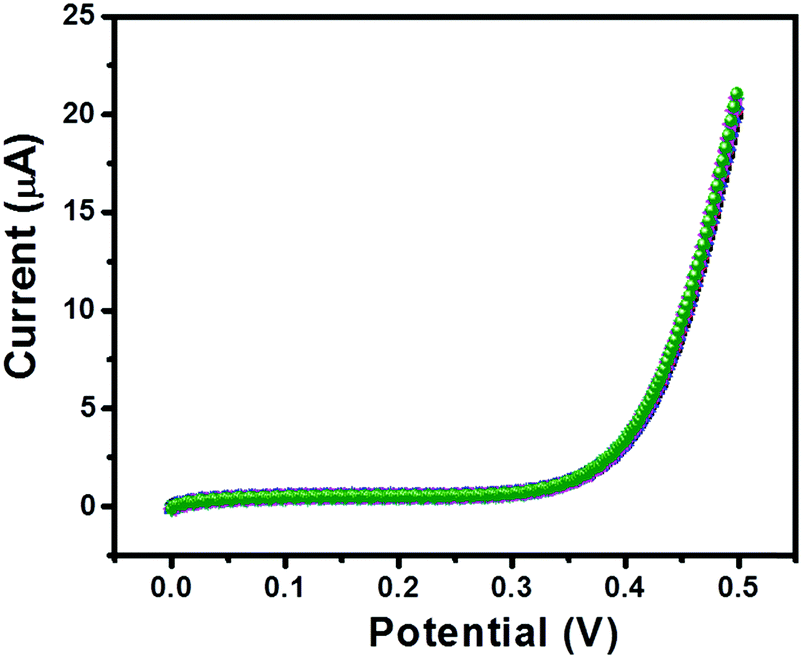
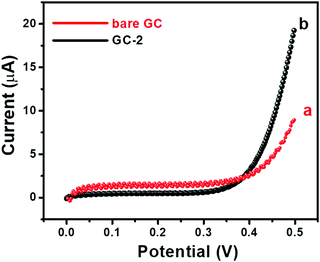
Further, I–V curves of the bare GC and GC-2 were also recorded in the presence of 250 μM urea in 0.1 M PBS (pH = 7.0) with an applied scan rate of 0.1 V s−1 (Fig. 8).
 |
| | Fig. 8
I–V curves of (a) the bare GC and (b) GC-2 in the presence of 250 μM urea in 0.1 M PBS (pH = 7.0). | |
The bare GC showed a current response of 8.9 μA, while GC-2 exhibited a higher current response of 19.51 μA. The obtained results showed a similar trend that GC-2 has high electro-catalytic ability for the oxidation of urea. Moreover, it was also observed that GC-2 showed a current response of 8.9 μA using CV whereas 19.51 μA was obtained using the I–V technique. Thus, it can be said that the I–V approach is more sensitive in this case. Hence, we have conducted I–V measurements for further electrochemical probes and investigations. The effects of different concentrations of urea on the electrochemical performance of GC-2 were determined by using the I–V approach.
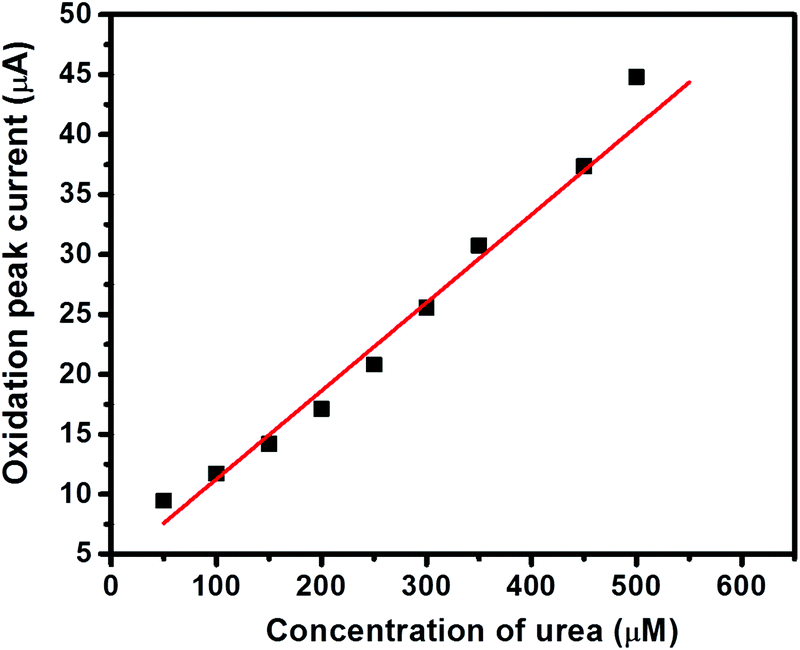
The I–V curves of GC-2 in the presence of different concentrations (50–500 μM) of urea in 0.1 M PBS were recorded (Fig. 9). The obtained results showed that the current response was enhanced with increasing the concentration of urea. The linear calibration plot of the current peaks against the concentrations of urea has been presented in Fig. 10. The increase of the current response was found to be linear with respect to the concentration of urea (Fig. 10).
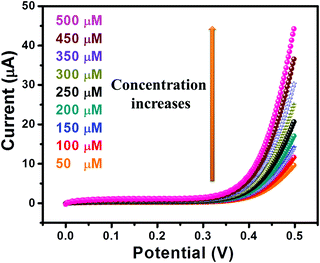 |
| | Fig. 9
I–V curves of GC-2 in different concentrations (50–500 μM) of urea in 0.1 M PBS (pH = 7.0). | |
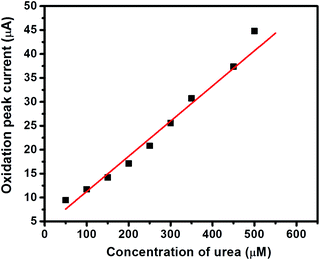 |
| | Fig. 10 Calibration plot of the current peaks against the concentrations of urea. | |
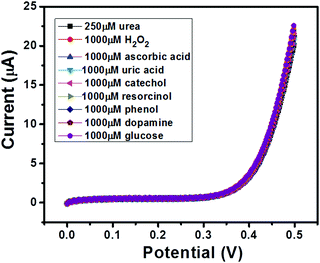
3.4. Selectivity and repeatability studies
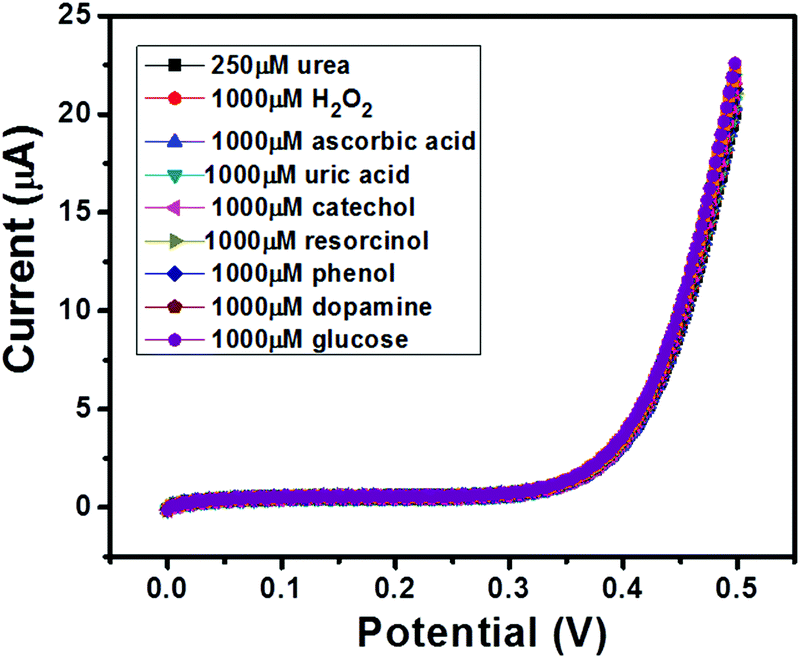
The selectivity of a sensor has always been a major concern due to the availability of various electro-active species (such as glucose, uric acid etc.) which may affect the electrochemical performance of the sensor in terms of accuracy. Thus, an ideal sensor should be highly selective. We have performed selectivity studies in the presence of ascorbic acid, hydrogen peroxide, uric acid, catechol, resorcinol, phenol, dopamine and glucose. The I–V curves of GC-2 were recorded in the presence of 250 μM in 0.1 M PBS (pH = 7.0) with interfering species (conc.; 1000 μM) and the obtained results are shown in Fig. 11. There was no significant change in the current response observed even when the concentrations of the electro-active species were 4 times higher than that of urea. Thus, it revealed the good selectivity of GC-2 towards urea sensing.
 |
| | Fig. 11
I–V curves of GC-2 in the presence of urea (250 μM) in 0.1 M PBS (pH = 7.0) with different interfering species (1000 μM). | |
Furthermore, the repeatability of the sensor is also an important tool; therefore, we have recorded 5 consecutive I–V curves of GC-2 in the presence of 250 μM urea in 0.1 M PBS (pH = 7.0). The recorded I–V curves have been presented in Fig. 12. There was an insignificant change in the current response observed, which indicated its remarkably good repeatability.
 |
| | Fig. 12 Five consecutive I–V curves of GC-2 in the presence of urea (250 μM) in 0.1 M PBS (pH = 7.0). | |
The detection limit of the GC-2 based urea sensor was calculated using the following eqn (2)21
| | | Detection limit (LOD) = 3.3 × σ/S | (2) |
where
σ = standard error while
S = slope of the calibration curve. The detection limit of the
GC-2 based urea sensor was found to be 1.6 ± 0.2 μM with a linear range of 50–450 μM. The sensitivity was found to be 0.9 μA μM
−1 cm
−2 using the formula sensitivity = slope/area of the electrode. The electrochemical oxidation of urea can be represented as shown in
Scheme 2. This probable mechanism has been proposed according to previously reported literature.
30–33 The electrochemical oxidation of urea probably produced NH
3 and CO
2 as shown in
Scheme 2.
 |
| | Scheme 2 Schematic illustration of urea sensing. | |
3.5. Comparison
Since the performance of the electrochemical sensor depends on various factors including the nature and quality of the electrode modifiers, hence we have compared the performance of GC-2 with previously reported literature. Mondal et al.30 employed polypyrrole/Pt as an electrode material for the sensing of urea with a detection limit of 40 μM. Nguyen et al.31 synthesized 3D-graphene/NiCo2O4 and constructed a urea sensor showing a limit of detection of 5 μM. Nguyen et al.32 also constructed a urea sensor based on a NiO/cellulose/CNT electrode modifier which showed a detection limit of 7 μM. Tak et al.33 used a ZnO–MWCNT composite whereas Srivastava et al.34 employed a TiO2–ZrO2 composite for the sensing of urea, but the obtained detection limit was poor. Different electrode modifiers have been developed for urea sensing.16,35 In particular, Arain et al.36 used vitamin C based NiO as a urea sensor which exhibited a detection limit of 10 μM. Bao et al.15 used a novel composite of a metal–organic-framework (Ni-MOF/Nafion/GCE) for urea sensing with a good detection limit of 2.23 μM. Amin et al.37 investigated the electrochemical behavior of NiCo2O4 nanoneedles towards the sensing of urea and obtained a detection limit of 1 μM. The obtained detection limit in the present work is comparable with the previous reports as shown in Table 1.15,16,30–37
Table 1 Comparison table of the GC-2 based urea sensor with previously reported sensors
| S. no. |
Electrode modifier |
Detection limit (μM) |
Sensitivity (μA mM−1 cm−2) |
Electrode diameter (cm2) |
Ref. |
| 1 |
Polypyrrole/Pt |
40 |
1.11 μA μM−1 cm−2 |
0.03 |
30
|
| 2 |
3D-graphene/NiCo2O4 |
5 |
166 |
0.25 |
31
|
| 3 |
NiO/cellulose/CNT |
7 |
371 |
0.25 |
32
|
| 4 |
ZnO–MWCNT composite |
230 |
43.02 |
0.25 |
33
|
| 5 |
TiO2–ZrO2 composite |
440 |
2.74 |
0.25 |
34
|
| 6 |
(Fc-PAMAM) dendrimers/MWCNTs |
50 |
1.085 |
— |
35
|
| 7 |
ZnO NRs |
10 |
41.64 |
— |
16
|
| 8 |
Vitamin C based NiO |
10 |
— |
— |
36
|
| 9 |
Ni-MOF/Nafion/GCE |
2.23 |
118.77 |
— |
15
|
| 10 |
NiCo2O4 nanoneedles |
1 |
— |
0.03 |
37
|
| 11 |
GC-2
|
1.6
|
0.9 μA μM
−1
cm
−2
|
0.07
|
This work
|
4. Conclusion
Pyramid shaped CaTiO3 was synthesized using a hydrothermal method. A glassy carbon electrode was modified by drop casting of CaTiO3 and urease to prepare the working electrode (GC-2). This prepared GC-2 electrode was employed for the determination of urea by employing voltammetric approaches. The developed GC-2 electrode exhibited a good detection limit and high selectivity towards urea sensing. Moreover, we believe that GC-2 can also be used in other applications such as fuel cells, supercapacitors or water splitting.
Conflicts of interest
There are no conflicts to declare.
Acknowledgements
K. A. and P. K. thank the University Grant Commission and DST-Inspire, New Delhi, India, for providing fellowships, respectively. The authors acknowledge Sophisticated Instrumentation Centre (SIC) and Department of Chemistry, IIT Indore, for providing the characterization facility. S. M. M. thanks CSIR (01(2935)/18/EMR-II) and SERB-DST (EMR/2016/001113), New Delhi, India, and IIT Indore for financial support.
References
- D. Dutta, S. Chandra, A. K. Swain and D. Bahadur, Anal. Chem., 2014, 86, 5914–5921 CrossRef CAS PubMed.
- M. Tyagi, M. Tomar and V. Gupta, Biosens. Bioelectron., 2013, 41, 110–115 CrossRef CAS PubMed.
- J. Yoon, D. Lee, E. Lee, Y. S. Yoon and D.-J. Kim, Electroanal., 2019, 31, 17–21 CrossRef CAS.
- Y.-L. Liu, R. Liu, Y. Qin, Y. Qin, Y. Qin, Q.-F. Qiu, Z. Chen, S.-B. Cheng and W.-H. Huang, Anal. Chem., 2018, 90, 13081–13087 CrossRef CAS PubMed.
- K. Ahmad, P. Kumar and S. M. Mobin, Nanoscale Adv., 2020, 2, 502–511 RSC.
- W. Raza and K. Ahmad, Mater. Lett., 2018, 212, 231–234 CrossRef CAS.
- K. Ahmad and S. M. Mobin, Nanoscale Adv., 2019, 1, 719–727 RSC.
- K. Ahmad, P. Kumar and S. M. Mobin, J. Electrochem. Soc., 2019, 166, B1577–B1584 CrossRef CAS.
- K. Ahmad and S. M. Mobin, J. Environ. Chem. Eng., 2019, 7, 103347 CrossRef.
- K. Ahmad, A. Mohammad and S. M. Mobin, Electrochim. Acta, 2017, 252, 549–557 CrossRef CAS.
- Z. Parsaee, Ultrason. Sonochem., 2018, 44, 120–128 CrossRef CAS PubMed.
- M. Mikani, S. Talaei, R. Rahmanian, P. Ahmadi and A. Mahmoudi, J. Electroanal. Chem., 2019, 840, 285–294 CrossRef CAS.
- R. Sha, K. Komori and S. Badhulika, Electrochim. Acta, 2017, 233, 44–51 CrossRef CAS.
- T. S. S. K. Naik, S. Saravanan, K. N. S. Saravana, U. Pratiush and P. C. Ramamurthy, Mater. Chem. Phys., 2020, 245, 122798 CrossRef.
- C. Bao, Q. Niu, Z.-A. Chen, X. Cao, H. Wang and W. Lu, RSC Adv., 2019, 9, 29474–29481 RSC.
- R. Ahmad, N. Tripathy and Y.-B. Hahn, Sens. Actuators, B, 2014, 194, 290–295 CrossRef CAS.
- S. Som, A. K. Kunti, V. Kumar, V. Kumar, S. Dutta, M. Chowdhury, S. K. Sharma, J. J. Terblans and C. Swart, J. Appl. Phys., 2014, 115, 193101 CrossRef.
- Y. Wang, C.-G. Niu, L. Wang, Y. Wang, X.-G. Zhang and G.-M. Zeng, RSC Adv., 2016, 6, 47873–47882 RSC.
- J. Staniforth, S. E. Evans, O. J. Good, R. J. Darton and R. M. Ormerod, Dalton Trans., 2014, 43, 15022–15027 RSC.
- X. He, C. Hu, Y. Xi, B. Wan and C. Xia, Sens. Actuators, B, 2009, 137, 62–66 CrossRef.
- K. Ahmad, A. Mohammad, P. Mathur and S. M. Mobin, Electrochim. Acta, 2016, 215, 435–446 CrossRef CAS.
- K. Ahmad, P. Kumar and S. M. Mobin, Nanoscale Adv., 2020, 2, 502–511 RSC.
- B. Muthukutty, R. Karthik, S.-M. Chen and M. Abinaya, New J. Chem., 2019, 43, 12264–12274 RSC.
- T. Kimijima, K. Kanie, M. Nakaya and A. Muramatsu, CrystEngComm, 2014, 16, 5591–5597 RSC.
- W. Dong, G. Zhao, B. Song, G. Xu, J. Zhou and G. Han, CrystEngComm, 2012, 14, 6990–6997 RSC.
- X. Yang, J. Fu, C. Jin, J. Chen, C. Liang, M. Wu and W. Zhou, J. Am. Chem. Soc., 2010, 132, 14279–14287 CrossRef CAS PubMed.
- D. Wang, Z. Guo, Y. Chen, J. Hao and W. Liu, Inorg. Chem., 2007, 46, 7707–7709 CrossRef CAS PubMed.
- G. Dong, X. Xiao, L. Zhang, Z. Ma, X. Bao, M. Peng, Q. Zhang and J. Qiu, J. Mater. Chem., 2011, 21, 2194–2203 RSC.
- H. K. Yang, J. W. Chung, G. S. R. Raju, B. K. Moon, B. C. Choi, J. H. Jeong and J. H. Kim, Appl. Surf. Sci., 2009, 255, 5062–5066 CrossRef CAS.
- S. Mondal and M. V. Sangaranarayanan, Sens. Actuators, B, 2013, 177, 478–486 CrossRef CAS.
- N. S. Nguyen, G. Das and H. H. Yoon, Biosens. Bioelectron., 2016, 77, 372–377 CrossRef CAS PubMed.
- N. S. Nguyen and H. H. Yoon, Sens. Actuators, B, 2016, 236, 304–310 CrossRef CAS.
- M. Tak, V. Gupta and M. Tomar, J. Mater. Chem. B, 2013, 1, 6392–6401 RSC.
- S. Srivastava, A. Ali, P. R. Solanki, P. M. Chavhan, M. K. Pandey, A. Mulchandani, A. Srivastava and B. D. Malhotra, RSC Adv., 2013, 3, 228–235 RSC.
- D. Esma, D. Muamer, N. N. Jackson and S. Mehmet, Sens. Actuators, B, 2017, 246, 920–926 CrossRef.
- M. Arain, A. Nafady, Sirajuddin, Z. H. Ibupoto, S. T. H. Sherazi, T. Shaikh, H. Khan, A. Alsalme, A. Niaz and M. Willander, RSC Adv., 2016, 6, 39001–39006 RSC.
- S. Amin, A. Tahira, A. Solangi, V. Beni, J. R. Morante, X. Liu, M. Falhman, R. Mazzaro, Z. H. Ibupoto and A. Vomiero, RSC Adv., 2019, 9, 14443–14451 RSC.
Footnote |
| † Electronic supplementary information (ESI) available. See DOI: 10.1039/d0ma00303d |
|
| This journal is © The Royal Society of Chemistry 2020 |
Click here to see how this site uses Cookies. View our privacy policy here. 
 Open Access Article
 This Open Access Article is licensed under a Creative Commons Attribution-Non Commercial 3.0 Unported Licence
 *abc
*abc