DOI:
10.1039/D0MA00294A
(Paper)
Mater. Adv., 2020,
1, 1262-1272
Influence of different bismuth oxyhalides on the photocatalytic activity of graphitic carbon nitride: a comparative study under natural sunlight†
Received
10th May 2020
, Accepted 30th June 2020
First published on 17th July 2020
Abstract
The light harvesting properties and charge separation in the trending graphitic carbon nitride (g-C3N4) material have been widely explored to enhance its photocatalytic performance employing doping, morphology control and composite formation. Herein, the effect of coupling of different bismuth oxyhalides, BiOX (X = F, Cl, Br and I), on the photocatalytic performance of g-C3N4 has been studied by synthesizing BiOX/g-C3N4 composites by a facile hydrothermal method. It was found that the BiOX/g-C3N4 composites showed enhanced photocatalytic degradation of a model pollutant, Congo red dye, under natural sunlight irradiation, as compared to the bare g-C3N4 and respective BiOX. The enhanced photocatalytic performance of the composites was attributed to the appropriate band edge potential and better interfacial contact between g-C3N4 and BiOX, which suppresses charge recombination and allows their better utilization at catalytic sites than in the case of bare g-C3N4 and respective BiOX. In comparison to all the BiOX/g-C3N4 composites, BiOBr/g-C3N4 showed the degradation of Congo red at a higher rate and was also found to be effective for the degradation of a colorless fungicide, carbendazim. Further, to look into the role of the active species responsible for this activity, trapping experiments have been carried out, which revealed that OH* was the main reactive species in the degradation process and, based on these results, a suitable mechanism for the enhanced photocatalytic activity has been proposed and discussed. Hence, the BiOX/g-C3N4 composite formation has proven beneficial for achieving high photocatalytic performance and provides new insight on bismuth oxyhalides and g-C3N4 based photocatalysts for environmental remediation application.
1 Introduction
Currently, the world is facing tremendous environmental problems, especially related to water pollution, as a result of the waste disposal in water reservoirs by many industries.1,2 Particularly, the effluent from textile industries mainly contains toxic organic dyes, which is one of the major contributors of water pollution. Azo dyes possess good stability due to their aromaticity and are non-biodegradable with carcinogenic properties. Therefore, the release of these toxic chemicals without proper treatment in water reservoirs is highly dangerous for aquatic life as well as to human health because they interfere in the food chain. In this regard, several efforts have been made by using strategies such as adsorption of organic pollutants by using conventional adsorbents, like silica, activated charcoal and advanced metal organic framework (MOF) materials. However, the adsorption technique is not very effective as it causes secondary pollution during the recycling of adsorbents.3,4 On the contrary, the use of heterogeneous photocatalysis for the degradation of organic pollutants in the presence of light irradiation has emerged as an alternative environmentally benign solution for this problem. The use of sunlight as a source for this process, good degradation of pollutants and excellent recyclability of photocatalysts are the key advantages of this process, which makes it a sustainable approach.
In the past few decades, several oxides, sulfides and other semiconductor based materials have been reported for photocatalytic degradation of organic pollutants.5–8 Recently, the organic semiconducting material graphitic carbon nitride (g-C3N4) has gained much importance due to its unique properties, like high thermal stability, earth-abundant elements, low cost and efficient light absorption.9 The band gap of g-C3N4 is around 2.7 eV and it can harvest visible light effectively. However, the photocatalytic performance of g-C3N4 is restricted due to the high recombination rate of photogenerated charges and lower surface area. Therefore, to improve the photocatalytic performance of this material, various strategies have been employed to suppress charge recombination and to enhance the surface area and light absorption.10 In this regard, template-assisted synthesis of mesoporous g-C3N4 along with metal and non-metal doped g-C3N4 have been reported by researchers to enhance the photocatalytic activity.11–14 Another interesting approach for increasing the photocatalytic performance of g-C3N4 is coupling it with another semiconducting material having suitable band positions, which can in turn enhance the charge separation and boost the photocatalytic performance.15 For example, Shi et al. have reported the synthesis of a MoS2/protonated g-C3N4 nanosheet composite for the degradation of methyl orange and phenol under visible light irradiation.16 Ma et al. have synthesized type-II CeO2/g-C3N4 nanosheets for the visible light induced degradation of bisphenol A.17 Our group has also reported CaTiO3/g-C3N418 and N-doped ZnO/g-C3N419 composite photocatalysts for efficient degradation of diverse industrial pollutants. Several other composite materials, such as core–shell TiO2@g-C3N4,20 WO3/g-C3N4,21 MnO2/g-C3N4,22 Ag3PO4/g-C3N4,23 CdS/RGO/g-C3N4,24etc., have been also reported for photocatalytic pollutant degradation. In each case, the composite materials have shown enhanced photocatalytic activity in comparison to the bare components, which mainly arose from the efficient transfer and suppressed recombination of photogenerated charges. Hence, the combination of two different materials with suitable band edge potentials can result in enhanced photocatalytic activity by suppressing electron–hole pair recombination.
In addition to the different semiconducting materials mentioned above, bismuth oxyhalides (BiOX, X = F, Cl, Br and I) are also of great interest in photocatalysis owing to their good optical properties. The band gap of BiOX lies in the range of 3.5–3.6 eV, 2.9–3.4 eV, 2.3–2.9 eV and 1.8–2.1 eV for BiOF, BiOCl, BiOBr, and BiOI, respectively, which enables them to harvest the UV and visible regions of light.25 Moreover, the band edge positions of BiOX are suitable for their coupling with g-C3N4 and high photocatalytic performance as a result of suppressed photogenerated charge recombination can be anticipated from the resulting composite materials. Therefore, to explore the possibilities of increasing the photocatalytic activity of BiOX and g-C3N4, we have synthesized the composites of each BiOX (X = F, Cl, Br and I) with g-C3N4 by a simple hydrothermal method with a 1![[thin space (1/6-em)]](https://www.rsc.org/images/entities/char_2009.gif) :1 wt% ratio. The photocatalytic activity of the as-prepared composites was measured by monitoring the degradation of a model organic pollutant, Congo red (CR), under natural sunlight irradiation. Also, the degradation of a colorless and non-photosensitizing fungicide, carbendazim (CBZ), was studied to reveal the true activity of the photocatalyst. It has been evidenced that the formation of the composite can efficiently boost the charge transfer between BiOX and g-C3N4 through intimate interfaces and high photocatalytic performance towards the degradation of CR and CBZ. In addition, the influence of the different BiOX on the photocatalytic activity of g-C3N4 has also been investigated under natural sunlight irradiation. Overall, it can be ascertained that BiOX–g-C3N4 composites are well suited for the efficient photocatalytic degradation of organic pollutants in waste water.
:1 wt% ratio. The photocatalytic activity of the as-prepared composites was measured by monitoring the degradation of a model organic pollutant, Congo red (CR), under natural sunlight irradiation. Also, the degradation of a colorless and non-photosensitizing fungicide, carbendazim (CBZ), was studied to reveal the true activity of the photocatalyst. It has been evidenced that the formation of the composite can efficiently boost the charge transfer between BiOX and g-C3N4 through intimate interfaces and high photocatalytic performance towards the degradation of CR and CBZ. In addition, the influence of the different BiOX on the photocatalytic activity of g-C3N4 has also been investigated under natural sunlight irradiation. Overall, it can be ascertained that BiOX–g-C3N4 composites are well suited for the efficient photocatalytic degradation of organic pollutants in waste water.
2 Experimental section
2.1 Chemicals
Bismuth(III) nitrate pentahydrate (Bi(NO3)3·5H2O), dicyandiamide, potassium iodide and sodium chloride were purchased from Sigma Aldrich, India, and were used as received. Potassium hydrogen difluoride and glacial acetic acid were purchased from SD Fine Chemicals, India, and potassium bromide was provided by Merck, India. Deionized (DI) water was used in all the experiments and was obtained from a double-stage water purifier (ELGA PURELAB Option-R7).
2.2 Material preparation
2.2.1 Synthesis of graphitic carbon nitride (g-C3N4).
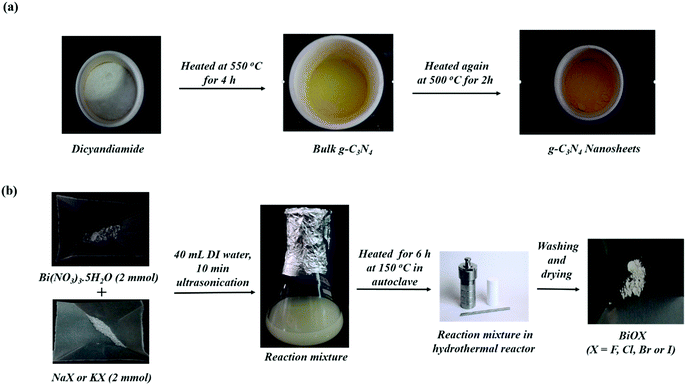
The synthesis of g-C3N4 was carried out by thermal polymerization of dicyandiamide by following a previously reported procedure.18 Typically, 5 g dicyandiamide was placed in an alumina crucible and initially heated at 550 °C with a ramp rate of 3 °C per min for 4 h. The obtained yellow solid mass was then ground to obtain a fine powder as bulk g-C3N4. For the synthesis of g-C3N4 nanosheets, the obtained powder from the first step of heating was again treated at 500 °C for 2 h with a ramp rate of 5 °C per min. The final product as a pale yellow powder was obtained and used for further characterization and the synthesis of composites.
2.2.2 Synthesis of BiOF.
BiOF was synthesized by using bismuth(III) nitrate pentahydrate (Bi(NO3)3·5H2O) and potassium hydrogen difluoride (KHF2) as precursors using the hydrothermal method.26 Initially, 2 mmol of Bi(NO3)3·5H2O was dissolved in 40 mL DI water and stirred for 15 min to get a suspension. Then, 2 mmol of KHF2 was added to the suspension and sonicated for 15 min. The resultant mixture was transferred to a Teflon lined stainless steel autoclave and the reaction was kept for 6 h at 150 °C in an oven. After cooling to room temperature, the resultant product was centrifuged and washed with ethanol and DI water thrice, and then dried in an oven at 80 °C to obtain a white powder.
2.2.3 Synthesis of BiOCl.
Similar to a previously reported procedure,26 for hydrothermal synthesis of BiOCl, 2 mmol Bi(NO3)3·5H2O was dissolved in 40 mL DI water and stirred for 15 min to get a suspension. To this suspension, 2 mmol NaCl was added and the mixture was sonicated for 15 min. The reaction mixture was then transferred to a Teflon coated stainless steel autoclave and the reaction was kept at 150 °C for 6 h in an oven. The resultant product was centrifuged and washed with ethanol and DI water thrice and dried in an oven at 80 °C to obtain a white colored powder.
2.2.4 Synthesis of BiOBr.
For this synthesis, a previously reported procedure was followed.27 In brief, 2 mmol of Bi(NO3)3·5H2O was dissolved in 3 mL acetic acid (glacial) and stirred to get a suspension. This suspension was mixed slowly with 2 mmol KBr solution which was prepared in 30 mL DI water with constant stirring. The reaction mixture after complete mixing was transferred to a Teflon coated stainless steel autoclave and the reaction was kept for 24 h at 120 °C in an oven. The obtained product was centrifuged and washed with ethanol and DI water thrice to remove impurities from the sample. The final product was dried in an oven overnight at 80 °C to obtain a white powder.
2.2.5 Synthesis of BiOI.
For the hydrothermal synthesis of BiOI, two different solutions were prepared as the first step. Solution A contains 2 mmol of Bi(NO3)3·5H2O dissolved in 17 mL ethanol and solution B was prepared by dissolving 2 mmol of KI in 17 mL DI water. In the next step, solution B was slowly added to solution A to obtain a yellow suspension, which changes to wine red with completion of addition under constant stirring. The resultant solution was transferred to a Teflon coated stainless steel autoclave and the reaction was kept at 160 °C for 24 h. After cooling, the obtained product was centrifuged and washed with ethanol and DI water thrice. The product was dried overnight in an oven at 80 °C to obtain a red colored powder.
2.2.6 Synthesis of BiOX/g-C3N4 composites.
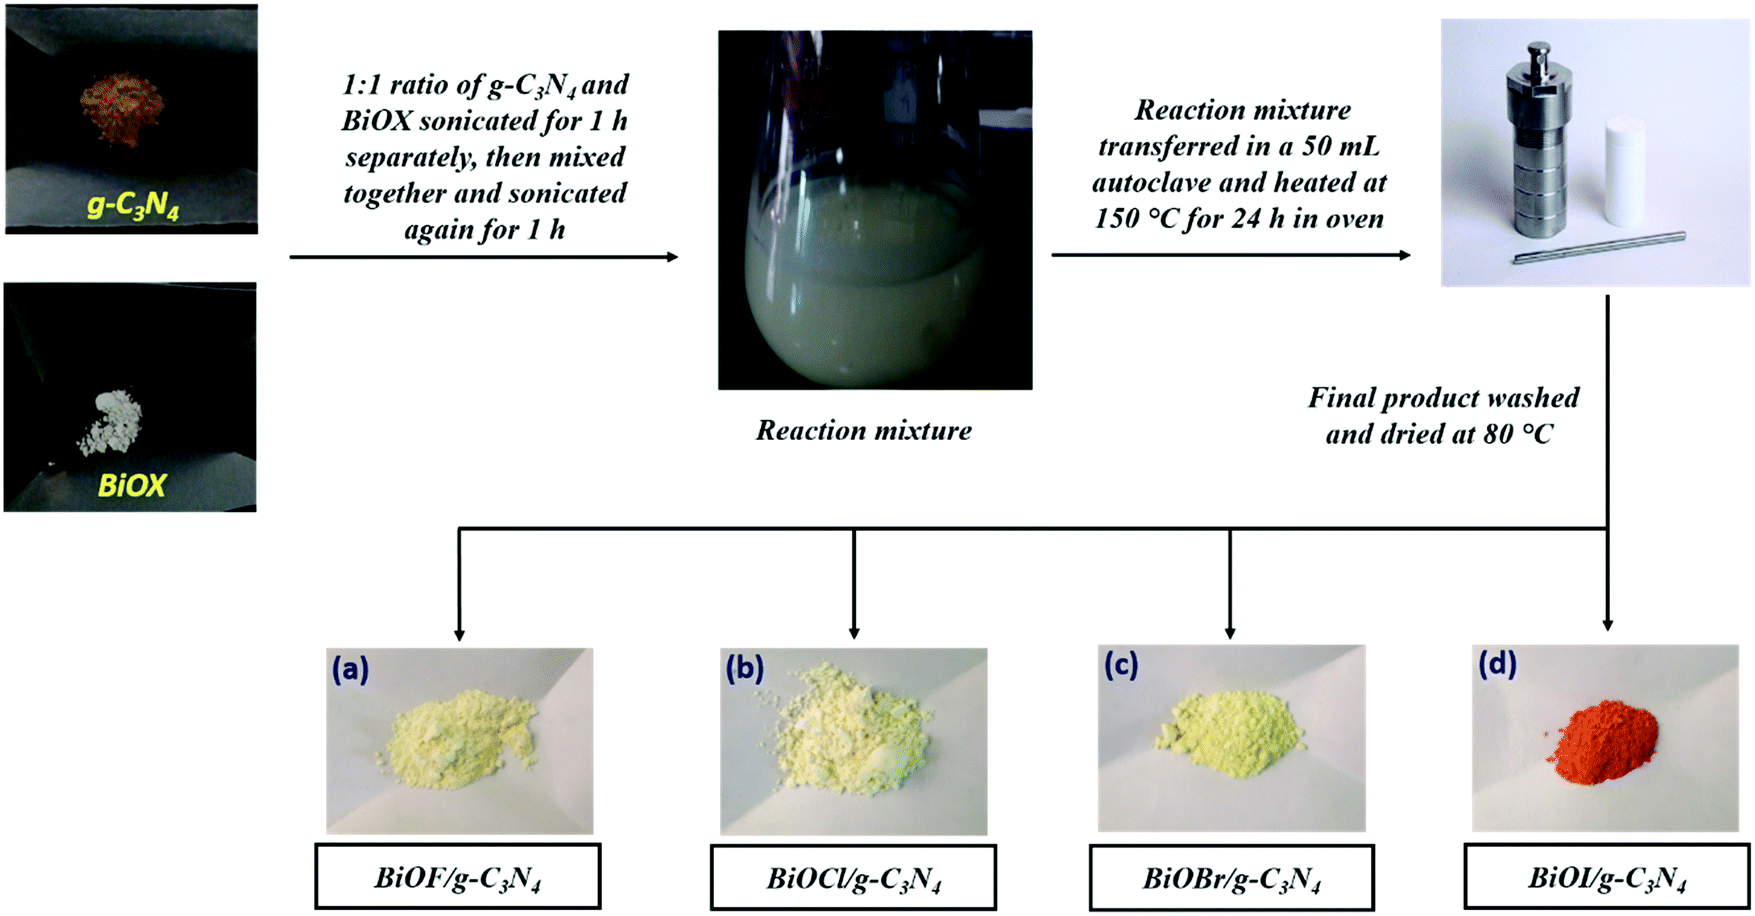
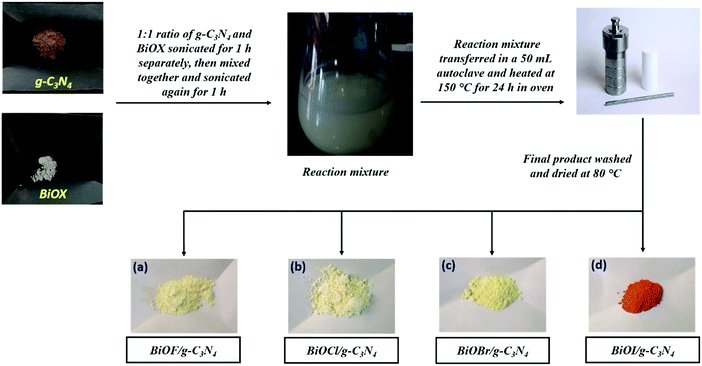
For the synthesis of composites of each BiOX (X = F, Cl, Br and I) with g-C3N4, an equivalent amount of each component (1:1 wt% ratio) was used. Two different reaction mixtures were prepared, wherein mixture A was prepared by dispersing 0.2 g of BiOX in 20 mL DI water and mixture B was prepared by dispersing 0.2 g of g-C3N4 in 20 mL DI water. Both the mixtures were separately sonicated for 1 h to ensure good dispersion and then mixed. Subsequently, the final mixture was again sonicated for 1 h to ensure good mixing of both components. The final suspension formed after completion of sonication was transferred to a Teflon coated stainless steel autoclave and the reaction was kept at 150 °C for 24 h in an oven. After cooling the autoclave, the obtained product was centrifuged and washed with ethanol and DI water thrice and dried in an oven at 80 °C to obtain the final composite.
2.3 Evaluation of the photocatalytic activity
To study the photocatalytic performance of the as prepared photocatalysts, the degradation of a model dye, Congo red (CR), was carried out under natural sunlight irradiation. The degradation experiments were performed in a 50 mL conical flask by using 20 mL of a 5 × 10⁻⁵ M aqueous solution of CR dye along with 20 mg of catalyst for each experiment. To achieve the adsorption–desorption equilibrium of CR over the photocatalytic materials, the CR and photocatalyst mixture was magnetically stirred under dark conditions for 30 min. The concentration of CR dye after attaining the adsorption–desorption equilibrium was taken as the initial concentration (C0) in each case. Subsequently, the suspension was irradiated under natural sunlight having a light intensity of 85000–90000 lux, with constant magnetic stirring for 90 min. For every 15 min interval, 1 mL solution from the suspension was taken out and centrifuged to separate the catalyst and the supernatant obtained was used to monitor the degradation of CR as a function of time. Furthermore, the degradation of a colorless pollutant, carbendazim (CBZ), was also studied under natural sunlight irradiation using the best catalyst from the previous experiments, to ascertain the true photocatalytic activity of the catalyst and to exclude any possible contributions due to photosensitization. In this regard, 20 mL CBZ solution of 2 × 10⁻⁵ M concentration was taken along with 20 mg of the catalyst and all other conditions were kept the same as for the degradation of CR dye. The percentage degradation rate of CR and CBZ was calculated by applying the following formula:7
| DRPollutant = (1 − Ct/C0) × 100 |
Here C0 is the initial concentration of the pollutant and Ct is the concentration after sample irradiation.
3 Results and discussion
3.1 Synthesis and structural studies
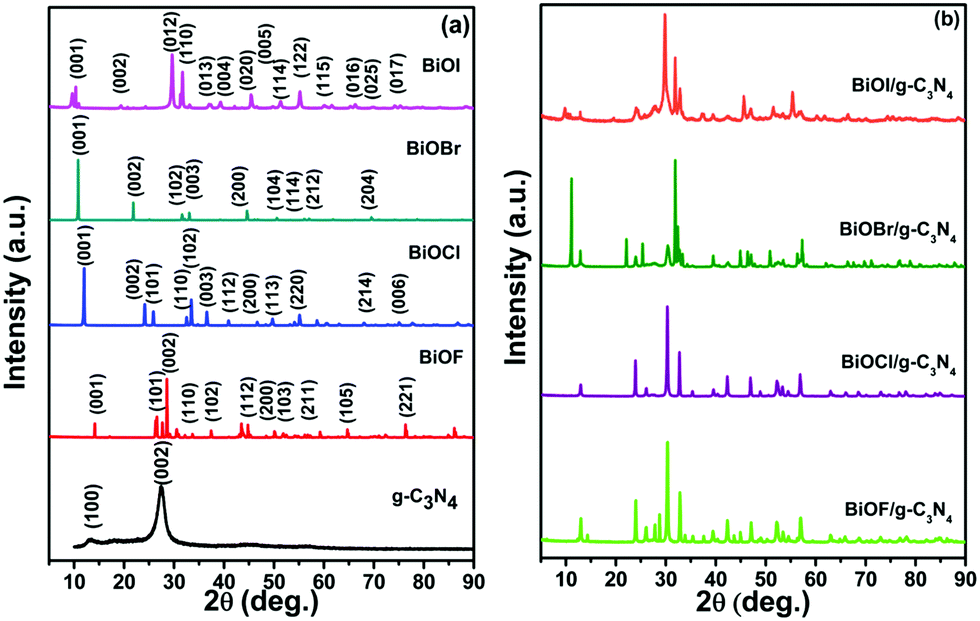
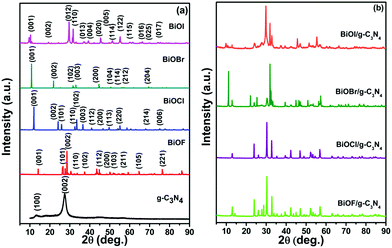
The synthesis of g-C3N4 nanosheets was performed using the thermal polymerization technique and the synthesis of various BiOX materials was performed using the hydrothermal method. The synthesis procedure of g-C3N4 and BiOX is presented in Scheme 1. The synthesis of various BiOX/g-C3N4 composites in a 1:1 wt% ratio was also performed using the hydrothermal method, as depicted in Scheme 2. After the synthesis, the purity and crystal structure of g-C3N4, BiOX and the BiOX/g-C3N4 composites were confirmed by studying the PXRD patterns as presented in Fig. 1. The PXRD pattern of g-C3N4 shows an intense peak at 2θ = 27.40°, which can be assigned to the (002) plane and corresponds to the interplanar stacking of the aromatic structures in g-C3N4. The other peak at 2θ = 13.15° (001) exhibits lesser intensity and corresponds to the in-plane structural motif packing in g-C3N4.18,28 On the other hand, the PXRD patterns of BiOF (JCPDS No. 73-1595),29 BiOCl (JCPDS No. 85-0861),30 BiOBr (JCPDS No. 73-2061)31 and BiOI (JCPDS No. 73-2062)29 were well matched with their respective JCPDS data and confirm their successful formation as shown in Fig. 1a. All the assigned planes to diffraction peaks confirm the tetragonal crystal structure of the respective bismuth oxyhalides with high purity.30 The major diffraction peaks of different planes of the BiOX crystal lattice could also be evidenced in the PXRD patterns of the BiOX/g-C3N4 composites (Fig. 1b), wherein the presence of g-C3N4 can be confirmed from its (002) diffraction peak and the absence of the (001) peak was also noticed because of its weak diffraction intensity. In addditon, the crystallite size is also calculated by using the Scherrer formula32 for the pristine samples and was found to be 3.5 nm, 67.0 nm, 48.9 nm, 61.7 nm, and 3.68 nm for g-C3N4, BiOF, BiOCl, BiOBr and BiOI, respectively.
 |
| | Scheme 1 Schematic representation of the synthesis of (a) g-C3N4 and (b) hydrothermal synthesis of BiOX (X = F, Cl, Br and I). | |
 |
| | Scheme 2 Schematic representation of the hydrothermal synthesis of BiOX/g-C3N4 composites (a) BiOF/g-C3N4, (b) BiOCl/g-C3N4, (c) BiOBr/g-C3N4 and (d) BiOI/g-C3N4. | |
 |
| | Fig. 1 PXRD pattern of (a) g-C3N4, BiOX (X = F, Cl, Br and I) and (b) BiOX/g-C3N4 composites. | |
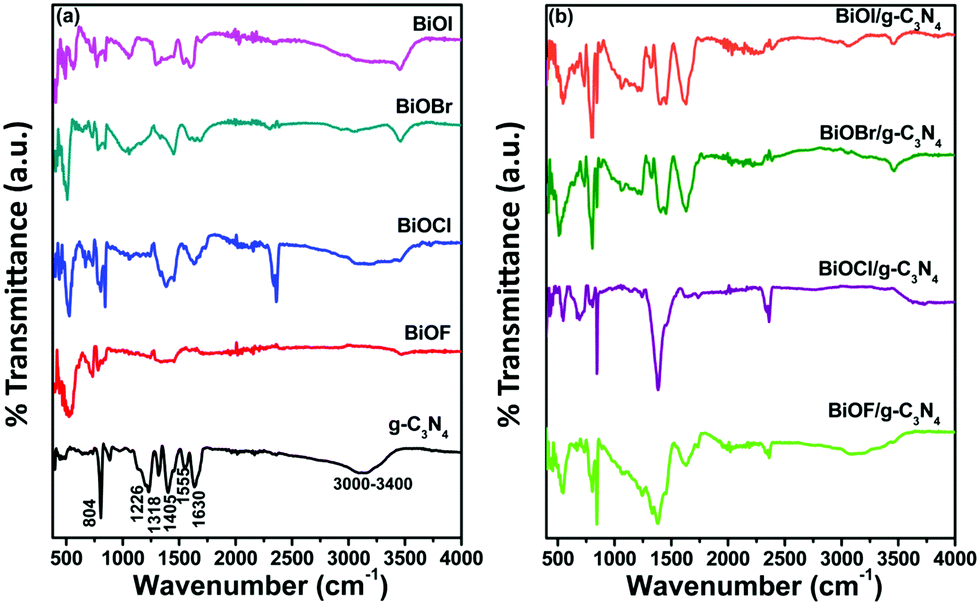
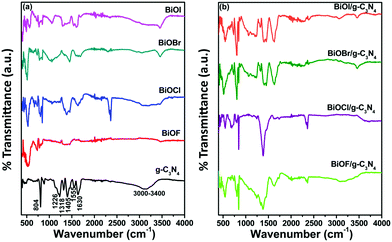
The FTIR spectra for all prepared samples were also examined for investigating the various functionalities and the corresponding results are depicted in Fig. 2. The FTIR spectra of g-C3N4 show peaks for the out-of-plane bending vibration of the heptazine ring at 804 cm−1 and for the stretching vibration of connected unit C–N–(C)–C and C–NH–C at 1318 and 1226 cm−1, respectively. The stretching vibrations of heptazine derivative repeating units are assigned to the peaks at wavenumber 1630, 1555 and 1405 cm−1. The broad peak from 3000–3400 cm−1 corresponds to the N–H stretching frequency of heptazine and triazine rings of g-C3N4.33 In the case of different bismuth oxyhalides, the characteristic Bi–O vibrational stretching frequency peaks were evidenced at 484, 511, 525 and 538 cm−1 for BiOF, BiOCl, BiOBr, and BiOI, respectively.34–37 The FTIR spectra of the different BiOX/g-C3N4 composites confirm the presence of the constituent components and indicate their successful formation.
 |
| | Fig. 2 FTIR spectra of (a) g-C3N4, BiOX (X = F, Cl, Br and I) and (b) BiOX/g-C3N4 composites. | |
3.2 Morphological, compositional and optical studies
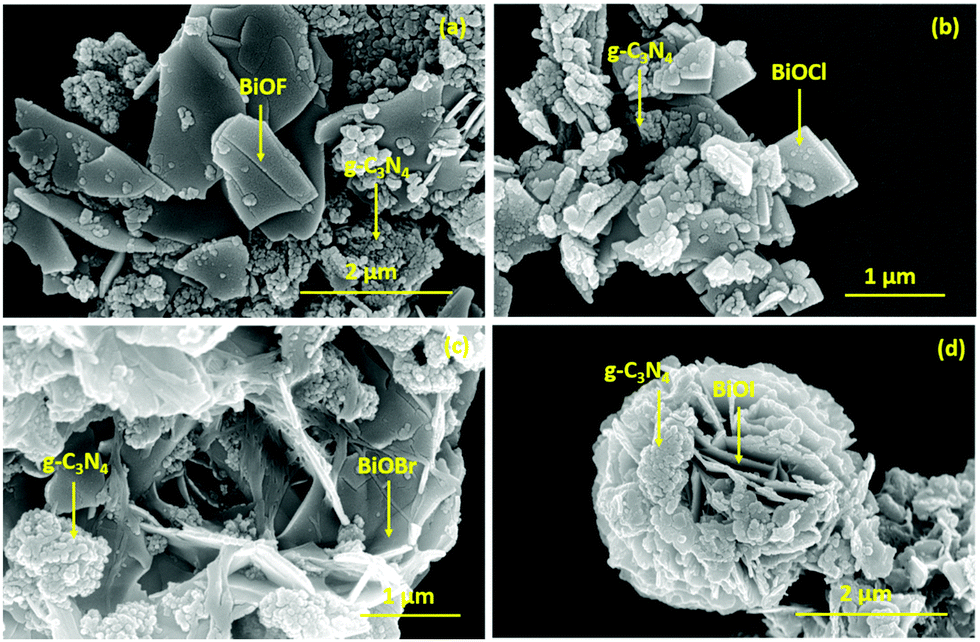
The morphological analysis of the as prepared samples was carried out using FESEM measurements and the corresponding micrographs are presented in Fig. 3. In this regard, g-C3N4 shows an aggregated sheet-like morphology as depicted in Fig. 3a and b. For BiOF, the FESEM image is presented in Fig. 3c, which presents a pentagonal prismatic shape like morphology. On the other hand, BiOCl and BiOBr showed a micron-sized sheet-like morphology with circular and rectangular shapes as presented in Fig. 3d and e, respectively. In the case of BiOI, a flower-like morphology, possibly constructed by aggregation of sheet-like microstructures, has been observed as shown in Fig. 3f. Thus, it can be inferred that, except for BiOF, all other BiOX showed sheet-like morphological characteristics. Furthermore, the FESEM micrographs of the BiOX/g-C3N4 composites are depicted in Fig. 4(a–d) with the marked components, which confirms the successful formation of the corresponding composites. In addition, the elemental mapping and EDAX spectrum for a representative composite, BiOBr/g-C3N4, are presented in Fig. 5, which confirms the presence and distribution of all the constituent elements.
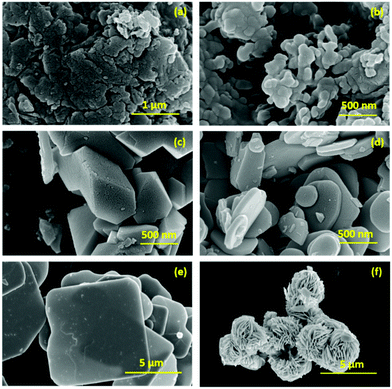 |
| | Fig. 3 FESEM images of (a and b) g-C3N4, (c) BiOF, (d) BiOCl, (e) BiOBr and (f) BiOI. | |
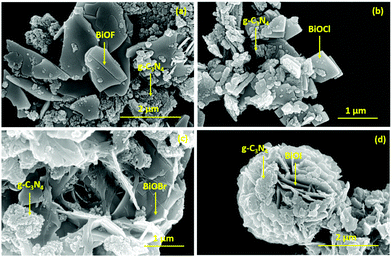 |
| | Fig. 4 FESEM images of (a) BiOF/g-C3N4, (b) BiOCl/g-C3N4, (c) BiOBr/g-C3N4 and (d) BiOI/g-C3N4 composites. | |
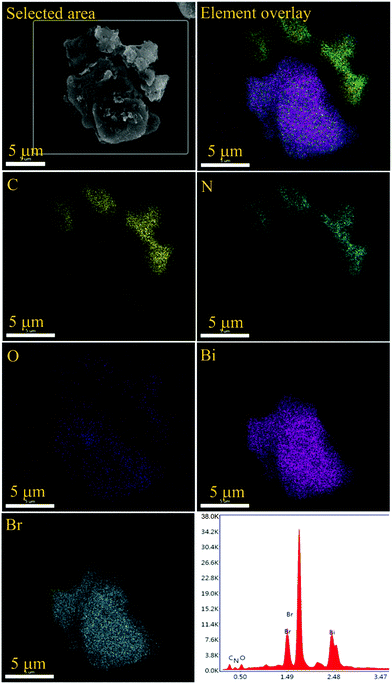 |
| | Fig. 5 Elemental mapping and EDAX spectrum of the BiOBr/g-C3N4 composite. | |
Furthermore, TEM measurements were also employed to look into the morphology of the BiOBr/g-C3N4 composite as a representative sample. It can be seen in Fig. 6a that both BiOBr and g-C3N4 are in close contact with each other, where BiOBr appears darker due to mass thickness contrast. Fig. 6b is the magnified image of Fig. 6a, which shows the presence of both the components, and the diffraction pattern in the inset confirms the single crystalline and amorphous nature of BiOBr and g-C3N4, respectively. Furthermore, in Fig. 6c and d, the close interfacial contact between the two components of the BiOBr/g-C3N4 composite was captured and the lattice fringes were not seen due to the amorphous nature of g-C3N4 and high mass thickness contrast of BiOBr. The EDAX data obtained from TEM is presented in Fig. 6e, which shows the presence of the constituent elements in the selected area shown in dark field image Fig. 6f.
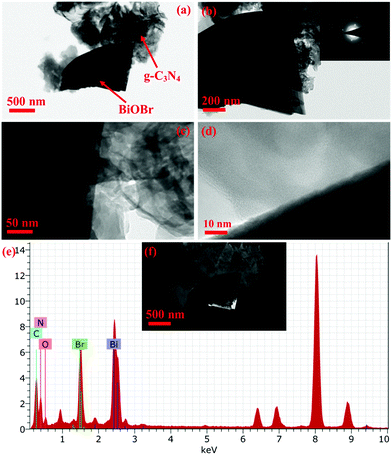 |
| | Fig. 6 (a–c) TEM images along with the diffraction pattern in the inset, (d) HRTEM image, (e) EDAX spectra and (f) dark field TEM image of the BiOBr/g-C3N4 composite. | |
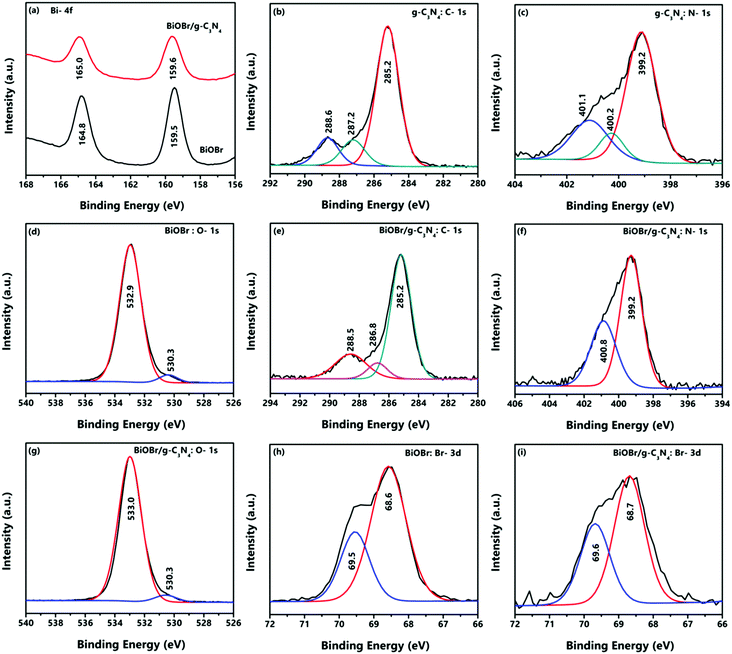
Further, XPS analysis has been employed for understanding the compositional and electronic properties of the bare BiOBr and g-C3N4 and a representative composite, BiOBr/g-C3N4, and the corresponding results are presented in Fig. 7. The survey spectra of these samples confirm the presence of all the constituent elements as presented in Fig. S1 (refer to the ESI†). The Bi-4f spectra of BiOBr presented in Fig. 7a show two binding energy peaks at 159.5 and 164.8 eV, which correspond to the 4f7/2 and 4f5/2 states of Bi in BiOBr, respectively, and imply the trivalent state of the element.38,39 For the BiOBr/g-C3N4 composite, the Bi-4f binding energy peaks showed a small shift towards higher binding energy and appear at 159.6 and 165.0 eV.40 The high resolution XPS spectrum of C-1s in g-C3N4 is presented in Fig. 7b, which reveals the existence of carbon in three different environments represented by the three peaks at 285.2, 287.2 and 288.6 eV, which belong to graphitic carbon, C–N bonds and highly electronegative C![[double bond, length as m-dash]](https://www.rsc.org/images/entities/char_e001.gif) N bonds (appears at higher binding energy), respectively. For the BiOBr/g-C3N4 composite, the binding energy peaks for C-1s appear at 285.2, 286.8 and 288.5 eV with a slight downshift as presented in Fig. 7e.41 In Fig. 7c, the XPS spectrum of N-1s of g-C3N4 is shown, which confirms the pyridinic, pyrrolic and graphitic nitrogen peaks at 399.2, 400.2 and 401.1 eV, respectively.42 For the BiOBr/g-C3N4 composite, pyridinic and pyrrolic peaks at 399.2 and 400.8 eV with slightly higher binding energies were evidenced as shown in Fig. 7f. The binding energy peaks of BiOBr for O-1s are depicted in Fig. 7d, which appear at 530.3 and 532.9 eV and can be attributed to lattice oxygen and surface oxygen in BiOBr, whereas these peaks were slightly shifted to 530.3 and 533.0 eV for the BiOBr/g-C3N4 composite as shown in Fig. 7g.42 Similarly, in the case of the Br-3d XPS spectrum of BiOBr (Fig. 7h), the binding energy peaks appear at 68.6 and 69.5 eV, which could be associated with energy states 3d5/2 and 3d3/2 in BiOBr. However, in the case of the BiOBr/g-C3N4 composite (Fig. 7i), these binding energy peaks got shifted to 69.6 and 68.7 eV, respectively.43 Therefore, from the XPS study it can be inferred that all prepared samples are composed of the expected constituent elements with high purity and in the desired oxidation states. Also, the slight shifts in the binding energy peaks for the BiOBr/g-C3N4 composite confirm the significant interaction between the two components, which can help in boosting the charge transfer during the photocatalytic process.
N bonds (appears at higher binding energy), respectively. For the BiOBr/g-C3N4 composite, the binding energy peaks for C-1s appear at 285.2, 286.8 and 288.5 eV with a slight downshift as presented in Fig. 7e.41 In Fig. 7c, the XPS spectrum of N-1s of g-C3N4 is shown, which confirms the pyridinic, pyrrolic and graphitic nitrogen peaks at 399.2, 400.2 and 401.1 eV, respectively.42 For the BiOBr/g-C3N4 composite, pyridinic and pyrrolic peaks at 399.2 and 400.8 eV with slightly higher binding energies were evidenced as shown in Fig. 7f. The binding energy peaks of BiOBr for O-1s are depicted in Fig. 7d, which appear at 530.3 and 532.9 eV and can be attributed to lattice oxygen and surface oxygen in BiOBr, whereas these peaks were slightly shifted to 530.3 and 533.0 eV for the BiOBr/g-C3N4 composite as shown in Fig. 7g.42 Similarly, in the case of the Br-3d XPS spectrum of BiOBr (Fig. 7h), the binding energy peaks appear at 68.6 and 69.5 eV, which could be associated with energy states 3d5/2 and 3d3/2 in BiOBr. However, in the case of the BiOBr/g-C3N4 composite (Fig. 7i), these binding energy peaks got shifted to 69.6 and 68.7 eV, respectively.43 Therefore, from the XPS study it can be inferred that all prepared samples are composed of the expected constituent elements with high purity and in the desired oxidation states. Also, the slight shifts in the binding energy peaks for the BiOBr/g-C3N4 composite confirm the significant interaction between the two components, which can help in boosting the charge transfer during the photocatalytic process.
 |
| | Fig. 7 High resolution XPS spectra of g-C3N4, BiOBr and the BiOBr/g-C3N4 composite. | |
The photocatalytic activity of semiconducting materials is closely related to their band gap, which in turn is related to the optical absorption and emission properties. In this regard, the DRS of all prepared samples were recorded in the wavelength range of 200–800 nm and corresponding results are presented in Fig. 8a and b. Among all prepared bismuth oxyhalides, BiOI is visible light active and has a narrow band gap of 1.8 eV. Also, g-C3N4 possesses a relatively narrow band gap of 2.74 eV and shows absorption in the visible light region of electromagnetic radiation.44 All other BiOX, namely BiOF, BiOCl and BiOBr, are UV light active and have band gaps of 3.52, 3.45, 3.10 and 1.80 eV, respectively, as determined from the transformed Kubelka–Munk plot shown in Fig. S2 (refer to the ESI†). The band gap values determined for the different BiOX are in good agreement with previously reported data.25 Also, it can be seen from the DRS plots of different composites that the formation of BiOX/g-C3N4 leads to a change in the optical properties, wherein an enhancement leading to better UV-vis light absorption can be seen, which could significantly improve their photocatalytic activity. In addition, the BET surface area was also measured for g-C3N4 and representative samples BiOBr and the BiOBr/g-C3N4 composite. g-C3N4 exhibited the highest surface area of 12.35 m2 g−1 among these samples due to its sheet-like morphology. The BiOBr sample possesses a bulk thick sheet-like morphology and therefore its surface area (1.54 m2 g−1) was found to be lower. For the BiOBr/g-C3N4 composite, a moderate area of 3.81 m2 g−1 was observed.
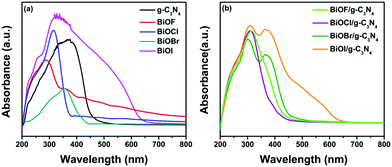 |
| | Fig. 8 DRS plots of (a) BiOX and g-C3N4 and (b) BiOX/g-C3N4 composites (X = F, Cl, Br and I). | |
3.3 Photocatalytic activity studies
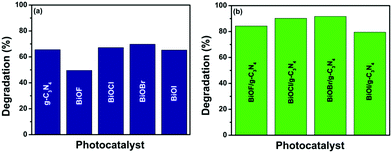
The photocatalytic activity of the materials g-C3N4, BiOX and BiOX/g-C3N4 composites was investigated by monitoring the photo-degradation of a model pollutant, CR dye, under natural sunlight irradiation and the obtained results are shown as histograms in Fig. 8. The decrease in the prominent absorption peak of CR dye at 496 nm was observed using UV-vis spectroscopy to quantify the amount of dye degraded in each experiment, which was carried out for 90 min. The time dependent UV-vis spectra of the degradation of the dye by bare catalysts and all composites are provided in Fig. S3 and S4, respectively (refer to the ESI†). The rate of degradation, which is a measure of the photocatalytic activity, was significantly higher in the case of the BiOX/g-C3N4 composites than the bare catalysts, while the amount of degradation was almost negligible without any catalyst (photolysis case). It can be seen from Fig. 9a that pristine g-C3N4 showed about 63% CR degradation after 90 min irradiation under natural sunlight. Among the different bismuth oxyhalides, BiOBr showed maximum degradation of around 70%, which is also higher than the pristine g-C3N4 in the same time period. The minimum photocatalytic performance was observed in the case of BiOF, which could be attributed to its highest band gap and more prominent charge recombination. On the other hand, upon the formation of the BiOX/g-C3N4 composites, a significant enhancement in the photocatalytic performance could be observed as depicted in Fig. 9b. Among the composites, BiOBr/g-C3N4 showed the maximum degradation of around 92% followed by BiOCl/g-C3N4 (90%), BiOF/g-C3N4 (84%) and BiOI/g-C3N4 (79%) in the same time period. Hence, it can be inferred that the BiOBr/g-C3N4 composite has shown the best photocatalytic performance among all prepared samples towards the degradation of CR dye. The better generation, separation and transfer of photo-induced electrons and holes in the case of the BiOBr/g-C3N4 composite can be ascribed to its enhanced photocatalytic activity, which ultimately leads to the high pollutant degradation efficiency.
 |
| | Fig. 9 Photocatalytic activity plots presenting the percentage of degradation of CR dye under sunlight irradiation for a stipulated time of 90 min using (a) bare BiOX and g-C3N4 as catalysts and (b) different BiOX/g-C3N4 composites as catalysts. | |
In addition, the kinetics of photocatalytic degradation of CR dye was also studied by applying the pseudo first-order reaction model to the obtained spectral data by using the following integral equation:45
In this equation,
C0 is the concentration of CR dye at time
t = 0,
C is the concentration at time
t =
t and
k is the rate constant of the photocatalytic reaction. Kinetic plots for the degradation of CR dye with different photocatalysts are presented in
Fig. 10. It can be seen from
Fig. 10 that the degradation of CR dye follows pseudo first-order reaction kinetics and corresponding parameters (rate constant, half-life time and
R2-values) are presented in Table S1 (refer to the ESI
†). The rate constant for the different composites follows the order: BiOBr/g-C
3N
4 (0.028 min
−1) > BiOCl/g-C
3N
4 (0.027 min
−1) > BiOF/g-C
3N
4 (0.020 min
−1) > BiOBr/g-C
3N
4 (0.018 min
−1). The highest rate constant value of 0.028 min
−1 for the BiOBr/g-C
3N
4 composite confirms its superior photocatalytic performance towards CR degradation in comparison to the other bare and composite photocatalysts. To validate the true photocatalytic activity of the BiOX/g-C
3N
4 composites, the best composite, BiOBr/g-C
3N
4, was chosen for investigating the degradation of a colorless fungicide, carbendazim (CBZ), under identical conditions. The obtained results in terms of the degradation profile of CBZ are provided in Fig. S5 (refer to the ESI
†). It has been found that BiOBr/g-C
3N
4 composite photocatalyst degrades 52% of colorless CBZ in 90 min, which confirms that this composite possesses true photocatalytic activity by degrading a colorless pollutant. The photocatalytic degradation performance of the best catalyst is also compared with other carbon nitride based photocatalysts in
Table 1, which indicates that this photocatalyst shows appreciable activity.
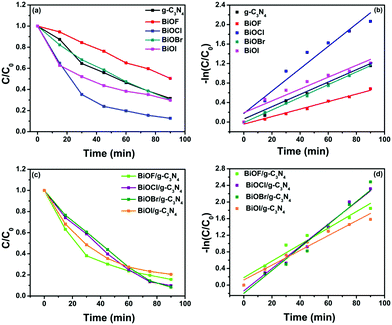 |
| | Fig. 10 Kinetic curves obtained by applying a pseudo first order kinetic model for the photo-degradation of CR dye using (a and b) different bare BiOX and g-C3N4 and (c and d) different BiOX/g-C3N4 composites. | |
Table 1 Comparison of the photocatalytic activity of the BiOBr/g-C3N4 composite with several other carbon nitride based photocatalysts
| Sl. no. |
Photocatalyst |
Radiation source |
Pollutant |
Time (min) |
Percentage degradation (%) |
Ref. |
| Methyl orange (MO), methylene blue (MB), malachite green (MG), rhodamine B (Rh B), 4-chlorophenol (4-CP), 2,4-dichlorophenol (2,4-DCP), Congo red (CR) and carbendazim (CBZ). |
| 1 |
ZnO/g-C3N4 |
Visible light irradiation (500 W Xe lamp). |
MB |
60 |
∼100 |
46
|
| MG |
45 |
∼100 |
| RhB |
150 |
∼100 |
| 2 |
WO3/g-C3N4 |
Visible light irradiation (300 W Xe lamp with a 400 nm cutoff filter) |
MB |
120 |
97.0 |
47
|
| 4-CP |
360 |
43.0 |
| 3 |
g-C3N4/NiFe2O4 |
Visible light irradiation (300 W Xe lamp with a 400 nm cutoff filter) |
MB |
240 |
87.0 |
48
|
| 4 |
CeO2/g-C3N4 |
Visible light irradiation (300 W Xe lamp with a 400 nm cutoff filter) |
MB |
210 |
98.6 |
49
|
| 5 |
AgCl/g-C3N5 |
Visible light irradiation (300 W power output halogen lamp) |
Rh B |
30 |
96.0 |
50
|
| 6 |
CeTi2O6/g-C3N5 |
Visible light irradiation (300 W Xe lamp with a UV-cutoff filter) |
2,4-DCP |
120 |
96.0 |
51
|
| 7 |
g-C3N4/BiOBr |
Visible light (300 W Xe lamp) |
MO |
90 |
98.0 |
52
|
| 8 |
BiOBr/g-C3N4 |
Natural sunlight |
CR |
90 |
92.0 (CR) |
Current work |
| CBZ |
90 |
52.0 (CBZ) |
Furthermore, the stability and reusability of the photocatalyst are important in heterogeneous catalysis. In this regard, the stability and reusability of the photocatalyst were studied using the best composite, i.e. BiOBr/g-C3N4, for three cycles of CR dye degradation. After each cycle completion, the catalyst was recovered by centrifugation and before using it in the next cycles it was washed with deionized water and dried. The result of the photocatalytic activity for three cycles is shown in Fig. 11a, which indicates that there was no significant decrease in the photocatalytic activity between consecutive cycles. The stability of the BiOBr/g-C3N4 composite after three cycles of photocatalytic reaction has been confirmed by measuring PXRD data. As shown in Fig. 11b, the PXRD pattern of the composite recovered after three cycles matches well with the pattern of the fresh composite, illustrating that the photocatalyst possesses excellent stability and recyclability properties. In addition, the FTIR spectra of the fresh and recycled BiOBr/g-C3N4 composite were also measured (Fig. S6, ESI†), which showed that the characteristic peaks of both the components were preserved after three cycles of photodegradation of CR dye.
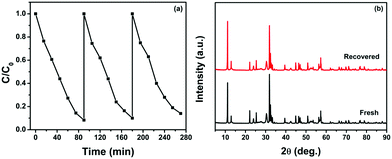 |
| | Fig. 11 (a) Photocatalytic activity of the BiOBr/g-C3N4 composite towards CR dye degradation for three cycles and (b) PXRD patterns of fresh and recovered catalysts. | |
3.4 Mechanism of photocatalytic activity
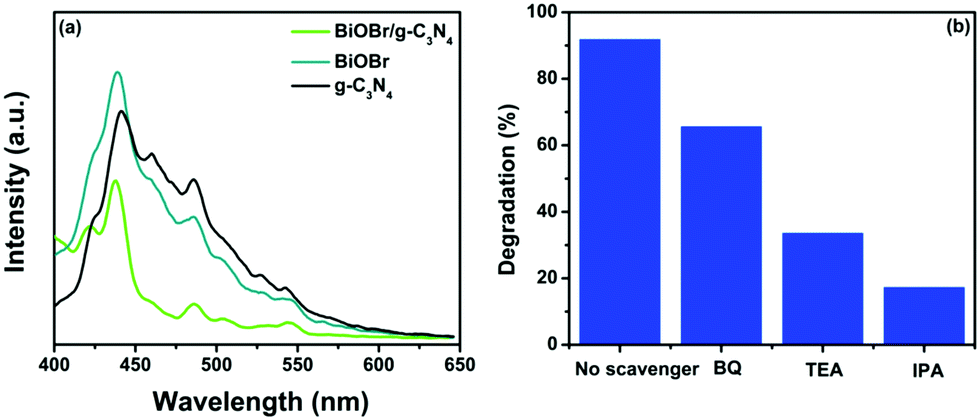
The comparison of the percentage of CR dye degradation shown by each photocatalyst reveals that the BiOX/g-C3N4 composites exhibit higher photocatalytic performance in comparison to the bare components. Among the composites, BiOBr/g-C3N4 showed maximum degradation of CR, which could be attributed to efficient charge separation and transfer through the binary interface. To prove this, PL studies were carried out for bare BiOBr and g-C3N4 and the BiOBr/g-C3N4 composite to study the generation and separation of photogenerated electron–hole pairs in the photocatalysts. According to the photoluminescence study, the intensity of a PL spectrum increases as the charge recombination of electron–hole pairs increases and vice versa.53,54 The PL spectra of bare BiOBr and g-C3N4 and the BiOBr/g-C3N4 composite are shown in Fig. 12a. As can be seen, the PL spectrum of the BiOBr/g-C3N4 composite is less intense in comparison to its bare counterparts. This indicates that the charge recombination in the case of g-C3N4 and BiOBr is quite high, which limits their photocatalytic activity. However, after the formation of the BiOBr/g-C3N4 composite, the charge recombination between photo-induced electrons and holes markedly decreases, which can help enhance the photocatalytic activity. To further understand the charge transfer mechanism, the calculation of the band edge potentials of BiOBr and g-C3N4 has been carried out by using the following equations:55
Here EVB and ECB are the valence band (VB) and conduction band (CB) edge potentials, respectively, and Eg is the band gap of the semiconductor material. The band gaps of BiOBr and g-C3N4 are 3.10 and 2.74 eV, respectively (as determined from DRS study), and χ is the Sanderson electronegativity, which is equal to 4.64 and 6.18 eV for g-C3N4 and BiOBr, respectively.56,57Ee is the energy of a free electron on the hydrogen scale, i.e. 4.5 eV vs. NHE. Substituting all values into the above equation, the calculated VB and CB edge positions of g-C3N4 were found at 1.51 and −1.23 eV vs. NHE, respectively. Similarly, the VB and CB edge positions of BiOBr lie at 3.23 and 0.13 eV vs. NHE, respectively. Based on this, a plausible mechanism of CR degradation under sunlight irradiation is depicted in Scheme 3. It has been well established that bare g-C3N4 and BiOBr show absorption in the visible region and UV region, respectively, of the solar spectrum. The successful composite formation of BiOBr over g-C3N4 results in a synergistic effect, which allows simultaneous absorption in both the UV and visible regions of light. Also, the appropriate band positions of each component in the BiOBr/g-C3N4 composite allow efficient charge transfer through the formed interfaces and suppress the recombination of photogenerated charges, which ultimately boosts the photocatalytic performance. Based on the thermodynamic feasibility of charge transfer, downward electron transfer from the CB of g-C3N4 to the CB of BiOBr takes place, whereas holes move upward from the VB of BiOBr to the VB of g-C3N4.58 Since the CB of BiOBr is more positive than the reduction potential of O2/O2−* conversion (−0.33 eV), the formation of O2−* does not take place. The photoexcited electrons transferred to the CB of BiOBr react with the oxygen present on the surface of the photocatalytic material and form H2O2 as the reduction potential value of O2/H2O2 is more positive (+0.69 eV vs. NHE) with respect to the CB of BiOBr (+0.13 eV vs. NHE).59 The holes in the VB of g-C3N4 react directly with the pollutant molecules due to their lower reduction potential to generate OH* radicals (OH−/*OH = 1.99 eV vs. NHE). On the other hand, the holes in the VB of BiOBr react with water molecules, which forms OH* radicals (*OH/H2O = 2.68 eV vs. NHE), and more of these radicals get generated in the presence of sunlight by decomposition of H2O2.60 Therefore, OH* radicals act as highly reactive oxidizing species and oxidize the toxic organic pollutant molecules into simpler non-toxic molecules, like H2O and CO2. Based on this, the degradation reaction mechanism can be formulated as:
| g-C3N4 (e− CB) → BiOBr (e− CB) |
| BiOBr (e−) + H+ + O2 → H2O2 |
| H2O2 + e− + hν → OH* + OH− |
| OH* + pollutant molecules → degraded products |
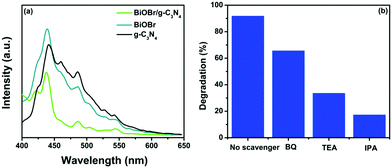 |
| | Fig. 12 (a) PL spectra of g-C3N4, BiOBr and the BiOBr/g-C3N4 composite and (b) effect of scavengers on the photocatalytic activity of the BiOBr/g-C3N4 composite towards CR degradation under sunlight irradiation. | |
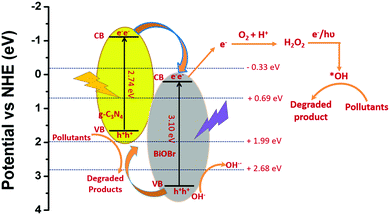 |
| | Scheme 3 Plausible mechanism of degradation of CR under sunlight irradiation over the BiOBr/g-C3N4 composite. | |
To validate the proposed mechanism and to investigate the role of reactive oxygen species in the degradation process, a scavenger study was carried out using different scavengers, viz. benzoquinone (BQ), isopropyl alcohol (IPA) and triethanolamine (TEA), for the degradation of CR dye. BQ, TEA and IPA act as scavengers for O2−*, h+, and OH* reactive species, respectively.7 The results of the scavenger study are depicted in Fig. 12b, which shows minimum degradation in the presence of IPA (18%), followed by TEA (33%), and much less effect in the degradation percentage with BQ (66%). These trapping experiment results reveal that OH* and h+ are the main reactive species involved in the degradation of CR dye and the O2−* species has negligible effect. The rate of formation of these reactive species is high in composites BiOBr/g-C3N4 compared to bare photocatalyst BiOBr and g-C3N4 as a result of suppressed charge recombination, because of which the composite shows high photocatalytic activity under sunlight irradiation for organic pollutant degradation.
4 Conclusion
In this comparative study, we have synthesized four different BiOX/g-C3N4 composites by using a 1:1 ratio of bare catalyst BiOX and g-C3N4 by a hydrothermal synthesis route. The photocatalytic activity of the composites and the bare catalysts was studied by monitoring the degradation of aqueous solutions of a colored dye (CR) and a colorless fungicide (CBZ) under sunlight irradiation. The appropriate band edge potential and better interfacial contact between BiOX and g-C3N4 have contributed to the increase in the photocatalytic activity of the composites in comparison to the bare BiOX and g-C3N4 catalysts. The high rate of formation of photoexcited electron–hole pairs with suppressed charge carrier recombination has given rise to excellent photocatalytic activity of composite BiOX/g-C3N4 over bare BiOX and g-C3N4 toward pollutant degradation. Among the different BiOX/g-C3N4 composites, BiOBr/g-C3N4 shows superior photocatalytic activity to the other BiOX/g-C3N4 composites due to the favorable band edge potentials between the UV light active BiOBr and visible light active g-C3N4 materials. The active species trapping experiments revealed that the OH* radical was the main reactive species, which plays a major role in the degradation of the pollutants. Hence, the composite formation of BiOX with g-C3N4 provides new insight on bismuth oxyhalides and g-C3N4 based photocatalysts for organic pollutant degradation. Moreover, similar photocatalytic systems can also be synthesized and utilized for other photocatalytic applications for energy conversion and organic transformation reactions, in addition to environmental remediation applications.
Conflicts of interest
There are no conflicts to declare.
Acknowledgements
We are thankful to Advanced Materials Research Centre (AMRC), IIT Mandi, for synthesis and the characterization facilities. Ashish Kumar gratefully acknowledges Council of Scientific Industrial Research (CSIR), New Delhi, India, for financial support through a senior research fellowship.
Notes and references
- T. Wang, C. Nie, Z. Ao, S. Wang and T. An, J. Mater. Chem. A, 2020, 8, 485–502 RSC.
- S. Kumar, A. Kumar, A. Kumar and V. Krishnan, Catal. Rev., 2019, 1–60 CrossRef.
- A. Kumar, S. Kumar, A. Bahuguna, A. Kumar, V. Sharma and V. Krishnan, Mater. Chem. Front., 2017, 1, 2391–2404 RSC.
- M. Wen, G. Li, H. Liu, J. Chen, T. An and H. Yamashita, Environ. Sci.: Nano, 2019, 6, 1006–1025 RSC.
- K. Lingeshwar Reddy, R. Balaji, A. Kumar and V. Krishnan, Small, 2018, 14, 1801304 CrossRef PubMed.
-
A. Kumar, S. Kumar and V. Krishnan, Nanophotocatalysis and Environmental Applications, Springer, 2019, pp. 139–165 Search PubMed.
- A. Kumar, V. Navakoteswara Rao, A. Kumar, M. Venkatakrishnan Shankar and V. Krishnan, ChemPhotoChem, 2020, 4, 427–444 CrossRef CAS.
- J. Wen, J. Xie, X. Chen and X. Li, Appl. Surf. Sci., 2017, 391, 72–123 CrossRef CAS.
- F. K. Kessler, Y. Zheng, D. Schwarz, C. Merschjann, W. Schnick, X. Wang and M. J. Bojdys, Nat. Rev. Mater., 2017, 2, 1–17 Search PubMed.
- W.-J. Ong, L.-L. Tan, Y. H. Ng, S.-T. Yong and S.-P. Chai, Chem. Rev., 2016, 116, 7159–7329 CrossRef CAS PubMed.
- J. Hong, X. Xia, Y. Wang and R. Xu, J. Mater. Chem., 2012, 22, 15006–15012 RSC.
- Y. Zhang, Z. Schnepp, J. Cao, S. Ouyang, Y. Li, J. Ye and S. Liu, Sci. Rep., 2013, 3, 2163 CrossRef PubMed.
- S. Tonda, S. Kumar, S. Kandula and V. Shanker, J. Mater. Chem. A, 2014, 2, 6772–6780 RSC.
- Y. Zeng, X. Liu, C. Liu, L. Wang, Y. Xia, S. Zhang, S. Luo and Y. Pei, Appl. Catal., B, 2018, 224, 1–9 CrossRef CAS.
- S. Kumar, A. Kumar, A. Bahuguna, V. Sharma and V. Krishnan, Beilstein J. Nanotechnol., 2017, 8, 1571–1600 CrossRef CAS PubMed.
- L. Shi, W. Ding, S. Yang, Z. He and S. Liu, J. Hazard. Mater., 2018, 347, 431–441 CrossRef CAS PubMed.
- R. Ma, S. Zhang, L. Li, P. Gu, T. Wen, A. Khan, S. Li, B. Li, S. Wang and X. Wang, ACS Sustainable Chem. Eng., 2019, 7, 9699–9708 CrossRef CAS.
- A. Kumar, C. Schuerings, S. Kumar, A. Kumar and V. Krishnan, Beilstein J. Nanotechnol., 2018, 9, 671–685 CrossRef CAS.
- S. Kumar, A. Kumar, A. Kumar, R. Balaji and V. Krishnan, ChemistrySelect, 2018, 3, 1919–1932 CrossRef CAS.
- L. Ma, G. Wang, C. Jiang, H. Bao and Q. Xu, Appl. Surf. Sci., 2018, 430, 263–272 CrossRef CAS.
- L. Cui, X. Ding, Y. Wang, H. Shi, L. Huang, Y. Zuo and S. Kang, Appl. Surf. Sci., 2017, 391, 202–210 CrossRef CAS.
- P. Xia, B. Zhu, B. Cheng, J. Yu and J. Xu, ACS Sustainable Chem. Eng., 2017, 6, 965–973 CrossRef.
- L. Liu, Y. Qi, J. Lu, S. Lin, W. An, Y. Liang and W. Cui, Appl. Catal., B, 2016, 183, 133–141 CrossRef CAS.
- W.-K. Jo and N. C. S. Selvam, Chem. Eng. J., 2017, 317, 913–924 CrossRef CAS.
- A. M. Ganose, M. Cuff, K. T. Butler, A. Walsh and D. O. Scanlon, Chem. Mater., 2016, 28, 1980–1984 CrossRef CAS PubMed.
- Y. Yang, F. Zhou, S. Zhan, Y. Liu and Y. Yin, J. Inorg. Organomet. Polym. Mater., 2016, 26, 91–99 CrossRef CAS.
- Z. Jiang, F. Yang, G. Yang, L. Kong, M. O. Jones, T. Xiao and P. P. Edwards, J. Photochem. Photobiol., A, 2010, 212, 8–13 CrossRef CAS.
- F. Fina, S. K. Callear, G. M. Carins and J. T. Irvine, Chem. Mater., 2015, 27, 2612–2618 CrossRef CAS.
- A. Alzamly, M. Bakiro, S. H. Ahmed, S. M. Sallabi, R. A. Al Ajeil, S. A. Alawadhi, H. A. Selem, S. S. M. Al Meshayei, A. Khaleel and N. Al-Shamsi, J. Photochem. Photobiol., A, 2019, 375, 30–39 CrossRef CAS.
- I. Sharma, G. K. Tripathi, V. K. Sharma, S. N. Tripathi, R. Kurchania, C. Kant, A. K. Sharma and K. Saini, Cogent Chem., 2015, 1, 1076371 Search PubMed.
- X.-J. Wen, C. Zhang, C.-G. Niu, L. Zhang, G.-M. Zeng and X.-G. Zhang, Catal. Commun., 2017, 90, 51–55 CrossRef CAS.
- M. J. Akhtar, M. Ahamed, S. Kumar, M. M. Khan, J. Ahmad and S. A. Alrokayan, Int. J. Nanomed., 2012, 7, 845 CAS.
- J. Liu, T. Zhang, Z. Wang, G. Dawson and W. Chen, J. Mater. Chem., 2011, 21, 14398–14401 RSC.
- S. Vadivel, B. Paul, D. Maruthamani, M. Kumaravel, T. Vijayaraghavan, S. Hariganesh and R. Pothu, Mater. Sci. Energy Technol., 2019, 2, 112–116 Search PubMed.
- Y. Bai, P.-Q. Wang, J.-Y. Liu and X.-J. Liu, RSC Adv., 2014, 4, 19456–19461 RSC.
- S. Vadivel, M. Vanitha, A. Muthukrishnaraj and N. Balasubramanian, J. Water Proc. Eng., 2014, 1, 17–26 CrossRef.
- X. Li, C. Niu, D. Huang, X. Wang, X. Zhang, G. Zeng and Q. Niu, Appl. Surf. Sci., 2013, 286, 40–46 CrossRef CAS.
- K.-L. Li, W. W. Lee, C.-S. Lu, Y.-M. Dai, S.-Y. Chou, H.-L. Chen, H.-P. Lin and C.-C. Chen, J. Taiwan Inst. Chem. Eng., 2014, 45, 2688–2697 CrossRef CAS.
- J. Wu, Y. Xie, Y. Ling, Y. Dong, J. Li, S. Li and J. Zhao, Front. Chem., 2019, 7, 649 CrossRef CAS PubMed.
- W. Cui, W. An, L. Liu, J. Hu and Y. Liang, J. Hazard. Mater., 2014, 280, 417–427 CrossRef CAS PubMed.
- S. Kumar, N. L. Reddy, A. Kumar, M. V. Shankar and V. Krishnan, Int. J. Hydrogen Energy, 2018, 43, 3988–4002 CrossRef CAS.
- T. Kanagaraj, S. Thiripuranthagan, S. M. K. Paskalis and H. Abe, Appl. Surf. Sci., 2017, 426, 1030–1045 CrossRef CAS.
- Z. Liu, B. Wu, Y. Zhao, J. Niu and Y. Zhu, Ceram. Int., 2014, 40, 5597–5603 CrossRef CAS.
- J.-C. Wang, H.-C. Yao, Z.-Y. Fan, L. Zhang, J.-S. Wang, S.-Q. Zang and Z.-J. Li, ACS Appl. Mater. Interfaces, 2016, 8, 3765–3775 CrossRef CAS PubMed.
- A. Kumar, K. L. Reddy, S. Kumar, A. Kumar, V. Sharma and V. Krishnan, ACS Appl. Mater. Interfaces, 2018, 10, 15565–15581 CrossRef CAS PubMed.
- R. Uma, K. Ravichandran, S. Sriram and B. Sakthivel, Mater. Chem. Phys., 2017, 201, 147–155 CrossRef CAS.
- L. Huang, H. Xu, Y. Li, H. Li, X. Cheng, J. Xia, Y. Xu and G. Cai, Dalton Trans., 2013, 42, 8606–8616 RSC.
- H. Ji, X. Jing, Y. Xu, J. Yan, H. Li, Y. Li, L. Huang, Q. Zhang, H. Xu and H. Li, RSC Adv., 2015, 5, 57960–57967 RSC.
- X. She, H. Xu, H. Wang, J. Xia, Y. Song, J. Yan, Y. Xu, Q. Zhang, D. Du and H. Li, Dalton Trans., 2015, 44, 7021–7031 RSC.
- S. Vadivel, S. Hariganesh, B. Paul, S. Rajendran, A. Habibi-Yangjeh, D. Maruthamani and M. Kumaravel, Chem. Phys. Lett., 2020, 738, 136862 CrossRef.
- S. Vadivel, S. Hariganesh, B. Paul, G. Mamba and P. Puviarasu, Colloids Surf., A, 2020, 592, 124583 CrossRef CAS.
- M. Jiang, Y. Shi, J. Huang, L. Wang, H. She, J. Tong, B. Su and Q. Wang, Eur. J. Inorg. Chem., 2018, 1834–1841 CrossRef CAS.
- A. Bhirud, S. Sathaye, R. Waichal, C.-J. Park and B. Kale, J. Mater. Chem. A, 2015, 3, 17050–17063 RSC.
- P. Kumar, A. Kumar, M. A. Rizvi, S. K. Moosvi, V. Krishnan, M. Duvenhage, W. Roos and H. Swart, Appl. Surf. Sci., 2020, 145930 CrossRef CAS.
- M. Yan, Y. Wu, F. Zhu, Y. Hua and W. Shi, Phys. Chem. Chem. Phys., 2016, 18, 3308–3315 RSC.
- K. H. Leong, Z. Z. Tan, L. C. Sim, P. Saravanan, D. Bahnemann and M. Jang, ChemistrySelect, 2017, 2, 84–89 CrossRef CAS.
- T. Jia, M. Liu, D. Yu, F. Long, S. Mo, Z. Deng and W. Wang, Nanomaterials, 2018, 8, 313 CrossRef PubMed.
- Y. Zang, L. Li, Y. Xu, Y. Zuo and G. Li, J. Mater. Chem. A, 2014, 2, 15774–15780 RSC.
- W. Y. Teoh, J. A. Scott and R. Amal, J. Phys. Chem. Lett., 2012, 3, 629–639 CrossRef CAS PubMed.
- Y. Jiang, W.-N. Wang, P. Biswas and J. D. Fortner, ACS Appl. Mater. Interfaces, 2014, 6, 11766–11774 CrossRef CAS PubMed.
Footnotes |
| † Electronic supplementary information (ESI) available. See DOI: 10.1039/d0ma00294a |
| ‡ These authors contributed equally to this work. |
|
| This journal is © The Royal Society of Chemistry 2020 |
Click here to see how this site uses Cookies. View our privacy policy here. 
 Open Access Article
 This Open Access Article is licensed under a
  and
Venkata
Krishnan
and
Venkata
Krishnan