 Open Access Article
Pore structure and particle shape modulates the protein corona of mesoporous silica particles†
Kalpeshkumar
Giri
ab,
Inga
Kuschnerus
ab,
Michael
Lau
a,
Juanfang
Ruan
c and
Alfonso
Garcia-Bennett
 *ab
*ab
aDpt. Molecular Sciences, Macquarie University, Sydney, NSW, Australia. E-mail: alf.garcia@mq.edu.au
bCentre for Nanoscale and BioPhotonics, Macquarie University, Sydney, NSW, Australia
cMicroscopy Unit, Mark Wainwright Analytical Centre, University of New South Wales, Sydney, NSW, Australia
First published on 25th June 2020
Abstract
The protein corona of mesoporous silica particles is significantly affected by their morphology, pore structure and size. High aspect ratio particles with large 12 nm pores have a high proportion of low molecular weight proteins in comparison to spherical particles with 5 nm pores, which show a homogenous protein coating which is generally constant in protein composition after long incubation times in serum. The pre-formation of a protein corona prior to incubation with microglia cells enhances the cellular uptake of spherical particles but not facetted or high aspect ratio particles.
Understanding the interactions between mesoporous silica particles (MSPs) and physiological fluids via the formation of a protein corona is important in order to develop their application in many areas of nanomedicine, pharmaceutical drug delivery and diagnostics.1–4 The picture of a protein corona is oversimplified in vivo, where a more complex biomolecular corona composed of glycans, vitamins, cytokines and other biomolecules exists. It is nonetheless relevant to study the influence of surface and porous properties on the ability of mesoporous particles to interact with serum proteins. The presence or absence of a protein corona (PC) has been found to mediate their cellular uptake,5,6 as well as their ability to cause a range of immune responses and target cancer cells when conjugated with specific antibodies.7–10 The particle morphology of MSPs can influence their cytotoxicity,11 their ability to cause red blood cell haemolysis, their in vivo biodistribution,12 and clearance.13 The porosity of MSPs has in addition been found to increase the accumulation of silica particles in the lungs of mice after intravenous injection, in comparison to non-porous silica.14 There is growing evidence that these differences may be due to specific variances in the composition of the PC. Particularly the hard (non-reversible) PC may induce particle agglomeration, mask the degradation and reactivity of the surface, or promote the interaction of functional groups with cell membrane receptors.15–17 Clemments et al. compared the effect of different surface functional groups on the PC of MSPs concluding that low molecular weight proteins are adsorbed on the surface of mesoporous particles.18 PEGylation was found to lead to negligible protein adsorption. This is considered to be a desirable particle property resulting in low immune cell association,19,20 although it has recently been put into question.21
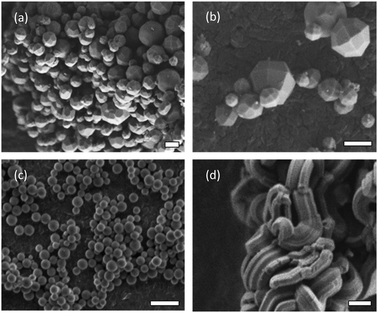
In this work, the PC from different MSPs formed after incubation in bovine serum is followed by liquid chromatography mass spectrometry proteomics (LC-MS) and microscopy analysis. Three different mesoporous particles with different aspect ratio are used, including: two-dimensional (2d) hexagonal SBA-15, and 3d-cubic AMS-6 mesostructures. Particles of AMS-6 are prepared with spherical and facetted morphologies to investigate how small differences in particle shape alone affect the formation of a PC (Fig. 1).22,23 SBA-15, is one of the most commonly studied MSPs and has larger cylindrical pores,24 as well as high aspect ratio rod-like morphology. As synthesized (AS-) and calcined (CAL-) forms of MSPs are also studied to observe the differences between the porous and non-porous forms of the materials. The MSP synthesis follows already published methods. Full structural and analytical characterisation are given in the ESI† (ESI,† Experimental section and Fig. S1). Samples are denoted by their post-synthesis treatment followed by their structural name and a letter indicating their particle morphology, e.g. CAL-AMS-6F, denotes calcined AMS-6 particles with facetted morphology. Propyl amine functionalised MSPs (NH2-) are prepared by solvent extraction of the surfactant template.
All particles show a hydrodynamic diameter between 300–700 nm as measured by dynamic light scattering (DLS). AS-AMS-6S has a lower hydrodynamic particle size and a more positive ζ-potential value suggesting a lower particle agglomeration due to stronger particle–particle repulsion (Table 1). Calcined particles dispersed in water possesses negatively charged surfaces owing to the high density of silanol groups (Table 1). The ζ-potential values correlate with the surface area, with CAL-AMS-6F showing a value of −31 mV and the highest surface area at 796 m2 g−1.
| MSP | a 0 (Å) | P vol (cm3 g−1) | P size (Å) | S area (m2 g−1) (micropore) | HDsize (nm) (±STD) | ζ-potential (mV) (±STD) |
|---|---|---|---|---|---|---|
| AS-AMS-6S | 61.5 | — | — | — | 354.4 (160) | 36.3 (3.0) |
| CAL-AMS-6S | 56.7 | 0.84 | 47.0 | 777.4 | 491 (16.5) | −31.8 (0.5) |
| NH2-AMS-6S | 53.8 | 0.39 | 37.9 | 415.0 | 749 (24.1) | 33.4 (0.8) |
| AS-AMS-6F | 61.5 | — | — | — | 681.1 (127) | 22.2 (1.6) |
| CAL-AMS-6F | 48.4 | 0.71 | 44.0 | 796.4 | 529.8 (80.5) | −31.7 (0.5) |
| NH2-AMS-6F | 45.0 | 0.39 | 37.8 | 425.7 | 645 (14.4) | 29.6 (0.5) |
| AS-SBA-15 | 114.6 | — | — | — | 361.6 (149) | 24.2 (6.7) |
| CAL-SBA-15 | 107.3 | 1.04 | 116.0 | 666 (106.1) | 505.8 (66) | −19.6 (1.9) |
| NH2-SBA-I5 | 124.4 | 1.03 | 64.1 | 620 (24.1) | 703.3 (67) | 19.7 (0.6) |
All MSPs were incubated in bovine serum (BS) for 10 min (T10). Representative SEM images of the lyophilised soft corona of MSPs show a significant degree of agglomeration and a visible protein coating at all incubation times (Fig. S2a–c, ESI†). The soft corona was removed via a washing protocol in distilled water, which was repeated three times. TEM images of the hard corona of MSPs show contrast from the proteins layers (Fig. S2d and e, ESI†). A homogeneous dark contrast of approximately 2 nm is observed surrounding AMS-6S particles, whilst for AMS-6F this contrast is heterogeneously distributed. High aspect ratio SBA-15 particles show contrast extending along the pore direction and from pore entrances.
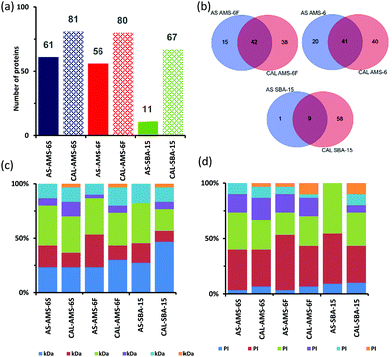
Polyacrylamide gel electrophoresis (SDS-PAGE) conducted on the hard corona CAL-MSPs show higher contrast in the lower molecular weight region (1–25 kDa) of the gel than for gels from AS-MSPs (Fig. S3, ESI†). Proteomics LC-MS analysis of all CAL-MSPs,‡ detected a higher number of proteins than for AS-MSPs as would be expected from the higher mesoporous surface area (Fig. 2a). More than 50% of proteins differ when comparing CAL and AS-MSPs (Fig. 2b). Less than 10% of proteins are similar amongst all AS-MSPs studied (Fig. S4, ESI†), and only 56% between AS-AMS-6S and AS-ASM-6F despite having the same mesostructure and being templated with the same anionic surfactant. Amongst CAL-MSPs, 33 proteins were similar to all, whilst 54 proteins were uniquely similar only to CAL-AMS-6F and CAL-AMS-6S despite their similar negative ζ-potential, surface area and porosity. This is evidence of a morphology effect.
 | ||
| Fig. 2 (a) Comparison of the total number of proteins adsorbed onto MSPs after 10 minutes (T10) of incubation in BS. (b) Venn diagram displaying the number of unique and common proteins identified in the formed coronas, and their respective overlaps. Full list of protein is provided in ESI† (Table S2.) (c) Classification of top 30 identified corona proteins, according to their molecular weight and (d) isoelectric point. | ||
As reported for nanoparticles,25,26 over 95% of the PC is made of the top 10–30 most abundant proteins. Fig. 2c shows the classification of the top 30 proteins found on MSPs in terms of their molecular mass. Proteins with molecular weight <100 kDa contribute between 80–85% of the hard protein corona of MSPs irrespective of porosity and particle shape. Only SBA-15 shows an increase in the percentage of proteins below <25 kDa when the material is calcined. Surprisingly, a depletion in the percentage of proteins <75 kDa size range occurs between AS-AMS-6 and CAL-AMS-6 for both facetted and spherical particles.
Proteins vitronectin, serpin A3-7, α-1-acid glycoprotein (pI ≤ 6) are not present in CAL samples of AMS-6F and AMS-6S. Additionally, the most abundant protein in the AS-AMS-6 particles, apolipoprotein A-I, significantly decreases in abundancy in CAL-AMS-6F and CAL-AMS-6S by 1.8 (P > 0.05, t-test, two-tail) and 3.7 fold (P < 0.05, t-test, two-tail) respectively. For SBA-15, the abundancy of apolipoprotein A-I increased by 1.8-fold (P < 0.05, t-test, two-tail) in CAL-SBA-15 compared to AS-SBA-15.
The mesopore size and the surface charge thus play a selective role in determining the overall PC of MSPs over a narrow range of pore sizes. The distribution of proteins detected classified by isoelectric point (PI) is shown in Fig. 2d. Over 60% of proteins found the hard corona of all MSPs possess an overall negative net charge (pI < 7) at physiological pH. In the case of AS-AMS-6 and AS-SBA-15 this increases to 74% and 100%, respectively. Since calcined silica surfaces possess negatively charged silanol groups and should primarily interact with net positively charged proteins,23,24 this is somewhat counterintuitive, despite the increase in absorption of proteins with pI ≥ 7 in all CAL-MSPs.
In order to explore kinetic effects in formation of a hard corona on CAL-MSPs, incubation in BS was conducted for different time periods (T30, T60 and T120). The band intensity of SDS-PAGE gels at different BS incubation times, shows stronger contrast in the low molecular weight range for AMS-6F and SBA-15, but remains constant for AMS-6S (Fig. S5, ESI†). Further analysis of the proteomics data shows the number of proteins (Fig. S6a, ESI†) adsorbed on CAL-AMS-6S and CAL-AMS-6F at T10 to be similar (80 and 81 respectively), but as the incubation time is increased so too does the difference in the number of adsorbed proteins (137 and 199 at T120). In contrast, the number of proteins detected in the hard corona of CAL-SBA-15 initially increases with incubation time but decreases at T120 (90). Overall, this indicates a strong influence of the particle morphology and porous properties on the adsorption of a hard corona on mesoporous materials. Pore blocking of micropores and the 2-dimensional hexagonal pore structure of SBA-15 may be responsible for its lower overall protein uptake. The percentage of proteins in the mass range between <75 kDa decreases in SBA-15 with prolonged incubation time (T10 to T120, Fig. S6b, ESI†), remaining constant for AMS-6S and AMS-6F.
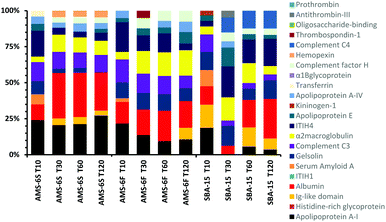
A comparison of the composition of the top 10 most abundant proteins by relative abundance identified in the hard corona at different incubation times is shown in Fig. 3. Albumin, α-2-macroglobulin and apolipoprotein-AI dominate the hard corona of all MSPs. The abundancy of the three proteins increases in the corona of AMS-6S with incubation time. Apolipoprotein-AI decreases in both AMS-6F and SBA-15. Albumin and apolipoprotein-AI are known to have dysopsonizing character, promoting nanoparticle uptake into endothelial cells and prolonging the blood half-life of nanocarriers.27 The amount of complement C3 remains constant in both AMS-6S and AMS-6F, whilst inter-α-trypsin inhibitor-H4 (ITIH4) decreases as a function of incubation time. The hard corona of SBA-15 has a more complex protein composition with longer incubation time, with an overall decrease in α-2-macroglobulin and complement C3, an increase in albumin and inter-α-trypsin inhibitor-H4 (ITIH4) and the presence of complement C4 in high abundancy at T120, and Ig-like domain at T10.
 | ||
| Fig. 3 Composition of the top 10 most abundant proteins by relative abundancy identified in the hard corona of calcined MSPs as a function of incubation time. | ||
A detailed bioinformatics analysis of detected proteins in terms of gene ontology (GO) is shown in Fig. S7 (ESI†). Proteins in the hard and soft coronas are expected to change over time because of continuous protein association and dissociation events, described as the Vroman effect.28 However, the PC of a range of non-porous silica and polymer nanoparticles has been found to form rapidly, remain largely the same with prolonged incubation time in blood plasma.22 Overall receptor, immunity, enzyme and hydrolase modulating proteins form the protein fingerprint of the corona of MSPs studied here, which remains largely constant with incubation time (Fig. S6a, ESI†) or particle shape. The coagulation pathway activating blood coagulation cascades appears to be the most relevant for all the MSPs (Fig. S6b, ESI†), decreasing with incubation time for AMS-6S and AMS-6F, but not for SBA-15, consistent with other previous findings on non-porous silica particles.29 T-Cell activation pathways are prominent at short incubation times for AMS-6F and SBA-15, but not for the AMS-6S (Fig. S6d, ESI†). Integrin signalling pathways remain relatively high for all MSPs. Overall, the function of proteins in the hard corona can be classed as enzyme modulating, calcium binding, and protein carriers (Fig. S6c, ESI†).
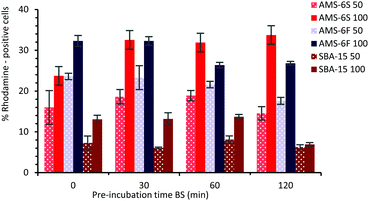
In order to assess the effect of a PC on the cellular uptake of MSPs, particles were dispersed in BS for different times, before addition to microglia (BV2) cells at 50 and 100 μg ml−1 concentration. For cellular uptake experiments NH2-MSPs functionalised with rhodamine dye were used, to enable flow cytometry detection after 24 hours of incubation (see ESI,† Experimental section). The composition and properties of the hard corona of NH2-functionalised particles at T30 and T120 was also determined by LC-MS (Fig. S8, ESI†). Similarly to the non-functionalised particles, the hard corona of NH2-MSPs is dominated by albumin and α-2-macroglobulin, but with a decrease in the relative abundance of apolipoprotein. The presence of high amounts of prothrombin was detected in the hard corona of NH2-AMS-6 particles, but not in NH2-SBA-15. Higher cell uptake was measured by flow cytometry for both AMS-6 particles, in contrast to SBA-15. At both concentrations studied 50 and 100 μg ml−1, uptake decreases as a function of pre-incubation time for both SBA-15 and AMS-6F (Fig. 4), but significantly increased for AMS-6S at the higher concentration. The pre-incubation of a protein corona did not influence the overall uptake ability in microglia AMS-6F and SBA-15.
Conclusions
Whilst the silica surface chemistry and the isoelectric point of proteins governs the adsorption process for the formation of the hard corona of all mesoporous particles studied, this work demonstrates an additional effect of pore size and particle shape on the characteristics of the protein corona of mesoporous particles. The number of proteins detected in as-synthesised (non-porous) particles is lower than in the calcined equivalents, with SBA-15 showing the largest difference in number and composition. The larger pore size of calcined SBA-15 result in a higher proportion of low molecular weight proteins (<25 kDa) than AMS-6. The hard protein corona of SBA-15 forms along the hexagonal mesopore direction, in comparison spherical particles of AMS-6, which show a homogenous and well-defined corona surrounding the particle. Both facetted and spherical AMS-6 particles are enriched by Albumin at longer incubation times to a greater extent than SBA-15. In contrast, SBA-15 is enriched by complement proteins at longer incubation times.Overall, the protein class and biological process of the all protein coronas remain largely the same for all particles at all incubation times, with an average of 10% of all proteins in the corona of mesoporous particles involved immune processes. However, the cellular uptake of mesoporous silica particle into microglia (BV2) cells significantly increases for AMS-6S particles when these possess a pre-formed corona, whilst uptake is inhibited for the facetted AMS-6 particles and SBA-15 in the presence of a pre-formed corona incubated for longer time periods. The role of apolipoprotein A-1 and ITIH4 proteins which is enriched in the hard corona of amine functionalised SBA-15, and prothrombin and complement C3 proteins which are in turn enriched in AMS-6 particles should be investigated further. Pre-forming coronas may lead to strategies that allow tuning the cellular uptake, immunological and cellular behaviour of mesoporous particles.
Conflicts of interest
The authors declare no conflicts of interests.Acknowledgements
This work was financed through support from the ARC Centre of Excellence for Nanoscale BioPhotonics (CE140100003), an ARC Future Fellowship (AEGB, FT150100342), as well as a Macquarie University Infrastructure grant (MQRIBG-9201501951). This research has been facilitated by access to Australian Proteome Analysis Facility (APAF, Macquarie University) which is funded by an initiative of the Australian Government as part of the National Collaborative Research Infrastructure Strategy. J. R. thanks the facilities at the Electron Microscope Unit at UNSW Sydney.Notes and references
- M. Manzano, V. Aina, C. O. Areán, F. Balas, V. Cauda, M. Colilla, M. R. Delgado and M. Vallet-Regí, Chem. Eng. J., 2008, 137, 30–37 CrossRef CAS.
- M. Manzano and M. Vallet-Regí, Adv. Funct. Mater., 2020, 1902634 CrossRef CAS.
- X. Xia, C. Zhou, L. Ballell and A. E. Garcia-Bennett, ChemMedChem, 2012, 7, 43–48 CrossRef CAS PubMed.
- B. Ulrika, A. Rambabu, E. G.-B. Alfonso and S. Maria, Curr. Drug Delivery, 2008, 5, 177–185 CrossRef PubMed.
- T. Kusaka, M. Nakayama, K. Nakamura, M. Ishimiya, E. Furusawa and K. Ogasawara, PLoS One, 2014, 9, e92634 CrossRef PubMed.
- E. Witasp, N. Kupferschmidt, L. Bengtsson, K. Hultenby, C. Smedman, S. Paulie, A. E. Garcia-Bennett and B. Fadeel, Toxicol. Appl. Pharmacol., 2009, 239, 306–319 CrossRef CAS PubMed.
- H. Vallhov, N. Kupferschmidt, S. Gabrielsson, S. Paulie, M. Strømme, A. E. Garcia-Bennett and A. Scheynius, Small, 2012, 8, 2116–2124 CrossRef CAS PubMed.
- H. Vallhov, S. Gabrielsson, M. Strømme, A. Scheynius and A. E. Garcia-Bennett, Nano Lett., 2007, 7, 3576–3582 CrossRef CAS PubMed.
- A. Gallud, O. Bondarenko, N. Feliu, N. Kupferschmidt, R. Atluri, A. Garcia-Bennett and B. Fadeel, Biomaterials, 2017, 121, 28–40 CrossRef CAS PubMed.
- N. Feiner-Gracia, M. Beck, S. Pujals, S. Tosi, T. Mandal, C. Buske, M. Linden and L. Albertazzi, Small, 2017, 13, 1701631 CrossRef PubMed.
- L. Harini, S. Srivastava, G. P. Gnanakumar, B. Karthikeyan, C. Ross, V. Krishnakumar, V. R. Kannan, K. Sundar and T. Kathiresan, Oncotarget, 2019, 10, 1193–1208 CrossRef PubMed.
- P. Decuzzi, B. Godin, T. Tanaka, S.-Y. Lee, C. Chiappini, X. Liu and M. J. J. O. C. R. Ferrari, J. Biomed. Mater., 2010, 141, 320–327 CAS.
- L. Li, T. Liu, C. Fu, L. Tan, X. Meng and H. Liu, Nanomedicine, 2015, 11, 1915–1924 CrossRef CAS PubMed.
- T. Yu, D. Hubbard, A. Ray and H. Ghandehari, J. Controlled Release, 2012, 163, 46–54 CrossRef CAS PubMed.
- O. Bondarenko, N. F. Torres, N. Kupferschmidt, A. Garcia-Bennett and B. Fadeel, Toxicol. Lett., 2014, 229, S188 CrossRef.
- Y. S. Lin, N. Abadeer and C. L. Haynes, Chem. Commun., 2011, 47, 532–534 RSC.
- S. R. Blumen, K. Cheng, M. E. Ramos-Nino, D. J. Taatjes, D. J. Weiss, C. C. Landry and B. T. Mossman, Am. J. Respir. Cell Mol. Biol., 2007, 36, 333–342 CrossRef CAS PubMed.
- A. M. Clemments, C. Muniesa, C. C. Landry and P. Botella, RSC Adv., 2014, 4, 29134 RSC.
- K. Sun, T. Ding, Y. Xing, D. Mo, J. Zhang and J. M. Rosenholm, Biomater. Sci., 2019, 7, 5301–5311 RSC.
- J. Y. Oh, H. S. Kim, L. Palanikumar, E. M. Go, B. Jana, S. A. Park, H. Y. Kim, K. Kim, J. K. Seo, S. K. Kwak, C. Kim, S. Kang and J.-H. Ryu, Nat. Commun., 2018, 9, 4548 CrossRef PubMed.
- A. C. G. Weiss, H. G. Kelly, M. Faria, Q. A. Besford, A. K. Wheatley, C.-S. Ang, E. J. Crampin, F. Caruso and S. J. Kent, ACS Nano, 2019, 13, 4980–4991 CrossRef CAS PubMed.
- R. Atluri, N. Hedin and A. E. Garcia-Bennett, Chem. Mater., 2008, 20, 3857–3866 CrossRef CAS.
- K. Lund, A. E. Garcia-Bennett and O. Terasaki, J. Mater. Chem., 2007, 17, 3622–3629 RSC.
- O. Terasaki, T. Ohsuna, Z. Liu, Y. Sakamoto and A. E. Garcia-Bennett, in Studies in Surface Science and Catalysis, ed. O. Terasaki, Elsevier, 2004, vol. 148, pp. 261–288 Search PubMed.
- S. Tenzer, D. Docter, J. Kuharev, A. Musyanovych, V. Fetz, R. Hecht, F. Schlenk, D. Fischer, K. Kiouptsi, C. Reinhardt, K. Landfester, H. Schild, M. Maskos, S. K. Knauer and R. H. Stauber, Nat. Nanotechnol., 2013, 8, 772–781 CrossRef CAS PubMed.
- A. E. Garcia-Bennett, A. Everest-Dass, I. Moroni, I. D. Rastogi, L. M. Parker, N. H. Packer and L. J. Brown, J. Mater. Chem. B, 2019, 7, 3383–3389 RSC.
- S. Schöttler, K. Landfester and V. Mailänder, Angew. Chem., Int. Ed., 2016, 55, 8806–8815 CrossRef PubMed.
- L. Vroman, Nature, 1962, 196, 476–477 CrossRef CAS PubMed.
- M. A. Dobrovolskaia, D. R. Germolec and J. L. Weaver, Nat. Nanotechnol., 2009, 4, 411–414 CrossRef CAS PubMed.
Footnotes |
| † Electronic supplementary information (ESI) available. See DOI: 10.1039/d0ma00188k |
| ‡ Mass spectrometry data have been deposited in a dedicated cloudstore repository, which can be accessed using the link: https://cloudstor.aarnet.edu.au/plus/s/uJFgcUx0WUF9OBi. |
| This journal is © The Royal Society of Chemistry 2020 |


