 Open Access Article
Exploring material chemistry for direct ink writing of reactively formed conductors†
Shane Q.
Arlington
 *ab,
Shashank
Vummidi Lakshman
a,
Sara C.
Barron
c,
Jeffery B.
DeLisio
c,
Juan C.
Rodriguez
c,
Sharada
Narayanan
a,
Gregory M.
Fritz
c and
Timothy P.
Weihs
*ab
aDepartment of Materials Science and Engineering, Johns Hopkins University, Baltimore, MD, USA. E-mail: arlington@jhu.edu; weihs@jhu.edu
bHopkins Extreme Materials Institute, Johns Hopkins University, Baltimore, MD, USA
cMicrosystems & Advanced Materials Division, The Charles Stark Draper Laboratory, Inc., Cambridge, MA, USA
First published on 6th July 2020
Abstract
In recent years, there has been a precipitous rise of additive manufacturing (3D printing) as a means of rapid prototyping as well as quickly and cost-effectively fabricating parts or entire systems in small quantities. One limiting factor has been the ability to seamlessly incorporate electrical components into 3D printed systems. While implementation of pick-and-place methods to insert components has readily been achieved, the connections between these components as they are embedded in systems during a build has been limited by the number of suitable inks. Silver inks have been most widely used, but are unsuitable for applications with moderate to high current density as they are susceptible to electromigration induced failure. Here we present a new material concept for 3D printing of electrical conductors: particles with stored chemical energy which, when provided some input energy, undergo a self-propagating high-temperature synthesis (SHS) reaction to form a mechanically and thermally stable, electrically conductive product. Inks incorporating these particles are non-conductive as-printed, but can be converted on demand into a conductive state. In this work, we explore and characterize model chemistries for this approach using physical vapor deposition of multilayer foils and particles and demonstrate a proof of concept of on demand conductor formation.
1 Introduction
Additive manufacturing (3D printing), the process of building a part by the sequential addition of layers of material, has been in use since the late 1980s.1 During the 1990s and early 2000s, the high cost of 3D printers limited their use to industrial settings. However, the development of low-cost additive manufacturing tools has both provided direct access to communal additive manufacturing resources, such as at libraries, universities or through web services, and allowed people to purchase their own tools.2,3 While this results in inexpensive rapid prototyping being available to more people than ever before, there remains a paucity of solutions to accommodate the inclusion of electronic components within a 3D printed part. For many businesses and individuals, it would advantageous to be able to print stable electrical connections into their parts to allow for quick and durable connections to both custom and commercial electrical components.The most robust existing technologies for 3D printed electrical interconnects rely on nanoscale silver particles.4–6 For low-current applications, the inks developed using these particles provide a reasonable solution: they sinter at low temperature to form conductive lines and can be made conformal to a substrate, can span gaps, and can even form free-standing structures.7 However, while silver has low electrical resistivity, it is also highly susceptible to electromigration, the diffusive movement of a conductive material under an applied current.8–10 As such, printed silver interconnects are not suitable in situations which require moderate or high current densities, particularly if a long lifetime is necessary.10 This leaves an unfilled niche in the additive manufacturing market for printed electromigration-resistant conductors.
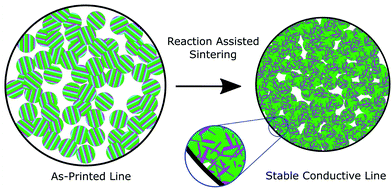
In their patent,11 several of the co-authors taught a new design for materials to meet this need, which we call a Reaction Assisted Ink for Longevity (RAIL). The key concept of the approach is that the ink particles in their as-printed state consist of different phases than the ultimate product. Moreover, the RAIL ink is non-conductive in the as-printed state and can be converted into a conductive state on demand, making it innately suitable to applications where an irreversible switching behavior is desirable, such as antifuses. RAIL materials are composed of three or more elements, grouped into two categories. The first is a pair (or group) of elements which can undergo a self-propagating high temperature synthesis (SHS) reaction to form a low resistivity product. The second is an element, group of elements, or alloy which has a relatively low melting temperature and low electrical resistivity. When supplied with some input energy, such as a laser, an electrical spark, or intense pulsed light, the first group will undergo their reaction, locally producing sufficient heat to melt and reflow the second group. In an ink, the binder will burn out, which, combined with the agglomeration of the molten reflow material, will result in a slight volume shrinkage to the printed part, as shown schematically in Fig. 1. The resulting microstructure consists of the reacted product of the first group in a matrix of the reflowed second group. Because the heat is generated within the material, the substrate or surrounding parts should not experience dramatic temperature rises. However, characterizing substrate compatibility, such as substrate adhesion, thermally-induced substrate damage, coefficient of thermal expansion (CTE) mismatch, and dielectric breakdown, will require further study with printed inks. A similar additive manufacturing technique called Reactive Additive Manufacturing was patented by Nuechterlein and Iten.12 That method uses a powder fusion bed approach with a reactive feedstock. The key difference in our approach is that the inks can be implemented directly with existing or co-printed parts via direct-ink writing.
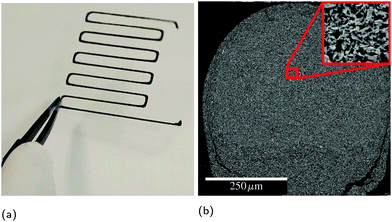
While SHS reactions were first discovered with mixtures of pure powders,13 composite powders or thin films with reactants in intimate contact offer improved control over the product microstructure and reaction front velocity, as well as lower ignition thresholds.14–18 Therefore, the reactant spacing is an important parameter for RAIL materials to minimize the thermal exposure of the substrates via a low ignition threshold, as well as to provide the best chance for a bicontinuous microstructure of conductor and matrix. To investigate feasible compositions in a highly controllable manner, we used physical vapor deposition (PVD) to produce free-standing nanolaminate foils and particles. This provides significantly improved chemical and microstructural uniformity compared to methods like ball milling, but with lower yield and higher cost. Thus, it is well suited for developing an understanding of the reaction properties and products of candidate materials, but not for producing sufficient material to develop inks for 3D printing. In this study, we explore the design criteria for successful RAIL materials and probe the limits of composition within a model ternary system. In particular, we seek to understand how the amount of reflow material affects the ignition thresholds and the extent of conversion to the desired product phases. In a forthcoming publication,19 we will present the development and characterization of printable inks based on the results of this study applied to ball milled powders. An example of a printed line of such an ink is presented in Fig. 2.
1.1 Material selection
Given the purpose of RAIL – to have the material generate heat to drive its own transformation to a robust low resistivity final phase – the requirements for material systems are manifold. We must consider what exothermic formation reactions yield products with desirable electrical properties. We must also consider the mechanical properties of these products, and how the reflow constituents may affect the reaction pathway or final products. To provide the most robust conductive lines, the reaction enthalpy should be sufficient to melt and reflow the matrix material. Finally, the materials should be translatable to scaled manufacturing by arrested reactive ball milling.First, we identified candidate elements or alloys for a low resistivity, easily reflowable matrix phase. Of pure elements, aluminum is a very strong contender. Its melting temperature of 660 °C is low, and its resistivity of 2.85 μΩ cm20 is among the lowest of all metals. Aluminum alloys also have a higher activation energy for surface diffusion than silver, which is known to enhance electromigration resistance as surface diffusion is thought to be the dominant mechanism for electromigration in printed silver.21–23 Aluminum powders are not suitable to print and sinter directly due to their native oxide coatings and the pyrophoric nature of nanoscale aluminum powders.24,25 Other low melting temperature materials considered include several silver-based alloys, such as CuSil-ABA (63% Ag, 35.25% Cu, 1.75% Ti) with a melting temperature of 780 °C and a resistivity of 44 μΩ cm, or InCuSil-ABA (59% Ag, 27.25% Cu, 12.5% In, 1.25% Ti) with a melting temperature of 605 °C and a resistivity of 106 μΩ cm. Given the higher price of these alloys, their higher bulk electrical resistivity, and the relatively similar melting temperatures, we chose commercially pure aluminum as a reflow material for this work. Similarly, while copper is another element with excellent electrical properties, its melting temperature is significantly higher at 1085 °C and therefore it was not selected.
Second, we identified groups of elements which can generate heat and provide a low resistivity product. Many of the materials commonly studied for SHS, such as Al/Ni, result in intermetallic phases with resistivities ranging from 10–60 μΩ cm.39,40 However, many of these reactions either already include aluminum or will react with aluminum, thereby forming a single high temperature intermetallic without melting and reflowing. Since these intermetallic phases have higher resistivity than Al and are generally brittle, a system capable of producing Al as a product is preferable. Compared to the aluminide reactions, carbide and silicide formation reactions can be even more energetic, have products with similar or lower resistivities, and are less likely to interact with Al.39 These properties allow for a low-resistivity carbide phase locked into and supported by a reflowed Al matrix. By employing a carbide formation reaction, the possibilities of reaction with aluminum are not completely bypassed; many of the carbide forming systems can form ternary compounds, including structured ternary MAX phases.41 MAX phases have extremely low electrical resistivities and are resistant to thermal shock, but are still brittle at room temperature.42 As such, they may negatively affect the mechanical properties of printed conductive lines. Further, as with Al-containing intermetallics, MAX phases reduce the ability of Al to act as a reflow material for the printed line. Table 1 summarizes a number of carbide and silicide formation pairs, including their heats of reaction, product resistivities, product coefficients of thermal expansion (CTE), and any known MAX phases formed with Al. To provide a more meaningful comparison than the heat of reaction, we also include an estimate of the number of moles of Al which can be melted and reflowed by the heat released in forming a mole of the product, assuming no heat losses. This value is calculated by dividing the heat of reaction by an enthalpy value which accounts for heating Al from room temperature to its melting temperature of 660 °C, as well as the latent heat of melting. Given that in any use there will be heat losses, these values are provided as useful points of comparison between the various reaction pairs and are not meant as realistic expectations.
| Constituents | ΔHR (J g−1) | Resistivity (μΩ cm) | CTE (ppm K−1) | Al MAX phases | Al melted (mol/mol) |
|---|---|---|---|---|---|
| * Known to form MAX phases in SHS reactions.38 | |||||
| Hf + C | 131826 | 3727 | 6.628 | 8.8 | |
| Nb + C | 134326 | 3327 | 6.729 | Nb2AlC, Nb4AlC330 | 4.9 |
| Ta + C | 74926 | <3031 | 6.329 | Ta3AlC2, Ta4AlC330 | 5.0 |
| Ti + C | 307926 | 6832 | 7.029 | Ti2AlC, Ti3AlC230![[thin space (1/6-em)]](https://www.rsc.org/images/entities/char_2009.gif) * * |
6.4 |
| V + C | 160226 | 25–3033 | 7.334 | V2AlC, V3AlC230 | 3.5 |
| Zr + C | 190426 | 48–20027,35 | 6.729 | Zr2AlC, Zr3AlC230,36 | 6.8 |
| Zr + 2Si | 108026 | 35–4037 | 8.637 | 5.6 | |
| V + 2Si | 292926 | 50–5537 | 11.237 | 10.9 | |
| Ti + 2Si | 128926 | 13–1637 | 10.537 | 4.6 | |
| Nb + 2Si | 84126 | 5037 | 8.437 | 4.4 | |
| Ta + 2Si | 50226 | 35–5537 | 8.837 | 4.2 | |
Final selection from the systems shown in Table 1 was a balance of several factors, such as minimizing CTE and resistivity, maximizing the Al which could be reflowed, and selecting elements with hardnesses suitable to produce finely-spaced layering in ball milled powders. At first, Hf/C seemed to be the clear winner. However, since scaled production would rely on ball milling, the extreme pyrophoricity of Hf necessitated an alternate selection. Most of the silicides have significantly higher CTEs than the carbides, although they may still prove interesting to investigate at a later date. Of the carbide systems, Ti/C, V/C, and Zr/C have comparable properties, but the known SHS formation of brittle MAX phases in the Al/Ti/C system may have provided additional complications. Given that V is very hard, it poses challenges to scaled production via ball milling. Therefore, we selected Al/Zr/C as the ternary system to investigate the RAIL concept. In this work we explore the effects of chemistry in the Al/Zr/C system using the highly controlled composition and structure provided by PVD materials.
Three Al/Zr/C sample compositions are presented here: a low Al content film with overall composition of Al![[thin space (1/6-em)]](https://www.rsc.org/images/entities/char_2009.gif) :
:![[thin space (1/6-em)]](https://www.rsc.org/images/entities/char_2009.gif) Zr
Zr![[thin space (1/6-em)]](https://www.rsc.org/images/entities/char_2009.gif) :
:![[thin space (1/6-em)]](https://www.rsc.org/images/entities/char_2009.gif) C 2
C 2![[thin space (1/6-em)]](https://www.rsc.org/images/entities/char_2009.gif) :
:![[thin space (1/6-em)]](https://www.rsc.org/images/entities/char_2009.gif) 1.2
1.2![[thin space (1/6-em)]](https://www.rsc.org/images/entities/char_2009.gif) :
:![[thin space (1/6-em)]](https://www.rsc.org/images/entities/char_2009.gif) 1; a medium Al content film with overall composition of Al
1; a medium Al content film with overall composition of Al![[thin space (1/6-em)]](https://www.rsc.org/images/entities/char_2009.gif) :
:![[thin space (1/6-em)]](https://www.rsc.org/images/entities/char_2009.gif) Zr
Zr![[thin space (1/6-em)]](https://www.rsc.org/images/entities/char_2009.gif) :
:![[thin space (1/6-em)]](https://www.rsc.org/images/entities/char_2009.gif) C 3
C 3![[thin space (1/6-em)]](https://www.rsc.org/images/entities/char_2009.gif) :
:![[thin space (1/6-em)]](https://www.rsc.org/images/entities/char_2009.gif) 1.2
1.2![[thin space (1/6-em)]](https://www.rsc.org/images/entities/char_2009.gif) :
:![[thin space (1/6-em)]](https://www.rsc.org/images/entities/char_2009.gif) 1; and a high Al content film with overall composition of Al
1; and a high Al content film with overall composition of Al![[thin space (1/6-em)]](https://www.rsc.org/images/entities/char_2009.gif) :
:![[thin space (1/6-em)]](https://www.rsc.org/images/entities/char_2009.gif) Zr
Zr![[thin space (1/6-em)]](https://www.rsc.org/images/entities/char_2009.gif) :
:![[thin space (1/6-em)]](https://www.rsc.org/images/entities/char_2009.gif) C 4.4
C 4.4![[thin space (1/6-em)]](https://www.rsc.org/images/entities/char_2009.gif) :
:![[thin space (1/6-em)]](https://www.rsc.org/images/entities/char_2009.gif) 1
1![[thin space (1/6-em)]](https://www.rsc.org/images/entities/char_2009.gif) :
:![[thin space (1/6-em)]](https://www.rsc.org/images/entities/char_2009.gif) 1. Based on observations that high-Al content films formed predominantly Al–Zr intermetallics, the low and medium-Al content films were made with a higher Zr
1. Based on observations that high-Al content films formed predominantly Al–Zr intermetallics, the low and medium-Al content films were made with a higher Zr![[thin space (1/6-em)]](https://www.rsc.org/images/entities/char_2009.gif) :
:![[thin space (1/6-em)]](https://www.rsc.org/images/entities/char_2009.gif) C ratio of 1.2
C ratio of 1.2![[thin space (1/6-em)]](https://www.rsc.org/images/entities/char_2009.gif) :
:![[thin space (1/6-em)]](https://www.rsc.org/images/entities/char_2009.gif) 1 to assist in the reactions between Al/Zr while maintaining sufficient Zr to react with C. This is of particular importance given that ZrC is not a stoichiometric compound and the phase formed is often rich in Zr. The resulting properties of the foils employed in this study are summarized in Table 2.
1 to assist in the reactions between Al/Zr while maintaining sufficient Zr to react with C. This is of particular importance given that ZrC is not a stoichiometric compound and the phase formed is often rich in Zr. The resulting properties of the foils employed in this study are summarized in Table 2.
Chemistry Al![[thin space (1/6-em)]](https://www.rsc.org/images/entities/char_2009.gif) : :![[thin space (1/6-em)]](https://www.rsc.org/images/entities/char_2009.gif) Zr Zr![[thin space (1/6-em)]](https://www.rsc.org/images/entities/char_2009.gif) : :![[thin space (1/6-em)]](https://www.rsc.org/images/entities/char_2009.gif) C C |
Thickness (μm) | Layer thicknesses (nm) | Short name | ||
|---|---|---|---|---|---|
| Al | Zr | C | |||
2![[thin space (1/6-em)]](https://www.rsc.org/images/entities/char_2009.gif) : :![[thin space (1/6-em)]](https://www.rsc.org/images/entities/char_2009.gif) 1.2 1.2![[thin space (1/6-em)]](https://www.rsc.org/images/entities/char_2009.gif) : :![[thin space (1/6-em)]](https://www.rsc.org/images/entities/char_2009.gif) 1 1 |
12 | 87 | 73 | 23 | 2Al |
3![[thin space (1/6-em)]](https://www.rsc.org/images/entities/char_2009.gif) : :![[thin space (1/6-em)]](https://www.rsc.org/images/entities/char_2009.gif) 1.2 1.2![[thin space (1/6-em)]](https://www.rsc.org/images/entities/char_2009.gif) : :![[thin space (1/6-em)]](https://www.rsc.org/images/entities/char_2009.gif) 1 1 |
12 | 137 | 77 | 24 | 3Al |
4.4![[thin space (1/6-em)]](https://www.rsc.org/images/entities/char_2009.gif) : :![[thin space (1/6-em)]](https://www.rsc.org/images/entities/char_2009.gif) 1 1![[thin space (1/6-em)]](https://www.rsc.org/images/entities/char_2009.gif) : :![[thin space (1/6-em)]](https://www.rsc.org/images/entities/char_2009.gif) 1 1 |
12 | 73 | 23 | 9 | 4.4Al |
2 Experimental
2.1 Sample fabrication
Physical vapor deposited (PVD) foils and particles were fabricated by DC magnetron sputtering from 12′′ × 5′′ linear targets spaced around an octagonal rotating substrate carousel. Multilayers were built up by rotating the substrates past each target in series. To assist in the carbide formation in the lower Al-content films, two C targets were used simultaneously to increase the layer-thickness of C due to its low sputter rate. Resulting film properties are summarized in Table 2.The targets used were C [99.999 wt% pure], commercially pure Al [Al 1100: 99 wt% Al, 0.87 wt% (Si,Fe), 0.12 wt% Cu], and Zr [99.7 wt% pure]. Deposition occurred at 1.7 mTorr of 99.999% pure Ar in a vacuum chamber, where the base pressure was better than 3 × 10⁻⁶ Torr. The substrate carousel was water-cooled to maintain near-ambient deposition temperatures. The substrates used were brass plates, which were affixed firmly to the carousel by screws. The substrates were patterned with tape to create rectangular film sections, which were removed from the substrate by flexure post-deposition. These freestanding foils were used for the thermal and structural investigations. A small batch of PVD particles of the most promising composition (2Al) were fabricated by sputtering onto polymer mesh substrates. During deposition, the coating is separated by the segments of the mesh, creating particles with a highly-curved, fingernail-like shape (see Fig. 8). These particles were removed from the substrate by flexure under water,43 and used to create a syringe-extrudable ink using dimethylformamide (DMF) as a solvent and cellulose acetate as a binder.
2.2 Thermal analysis, propagation, and ignition
Foil samples were tested in a TA Instruments Q600 simultaneous DTA/TGA, with a purge gas of high purity (99.995%) Ar. All experiments were performed at a heating rate of 20 °C min−1 up to 1450 °C. Samples were also quenched in the Q600 at lower temperatures to investigate intermediate phases.Propagation velocities were measured by reacting free-standing pieces of foil in air using a vertically mounted high-speed visible light camera (NAC Memrecam HX-6) with a 90 mm macro lens (Tamron). The reaction was ignited by an electric spark from a DC power supply (MPJA 1602PS). The reaction front position was tracked using Tracker (https://physlets.org/tracker/) and the velocity was found by taking a regression of the reaction front position as a function of time. Two single channel pyrometers (Kleiber KGA740-LO and KG740-LO) with a combined sensitive range of 200–2500 °C were used to measure film temperature during propagation. The emissivity was assumed to be ε = 0.1, based on values for polished Al and prior work with other multilayers.44,45 In all cases, the outside layer of the foil was Al.
Ignition temperatures were determined by the hot plate method.14,43 A Watlow CER-1-01 hot plate was held at constant temperature, monitored by an internal thermocouple and two surface mounted thermocouples. Foil pieces approximately 2 mm × 2 mm in size were dropped onto the hot plate surface and observed visually. Those ignited by the hot plate reacted and gave off a burst of light. Fresh samples were used for each experiment. The temperature of the hot plate was increased until the threshold temperature for ignition was found.
To mimic use in additive manufacturing, we ignited foils using Intense Pulsed Light (IPL) in a NovaCentrix PulseForge 1200. This system employs a high power Xenon flash bulb to provide a high energy pulse to a large area simultaneously. The typical settings used were five pulses over 6 ms with a 75% duty cycle, resulting in an energy density of 8.5 J cm−2 as measured by the built-in Bolometer. These energy densities are well above the measured threshold values for all compositions, which were determined by systematically lowering the power settings until the foils did not react.
2.3 X-ray diffraction and electron microscopy
X-ray diffraction was employed for phase identification, using a PANalytical X'Pert Pro with Cu Kα radiation (λCu = 0.154 nm) and a symmetric θ–2θ scan geometry. X-ray microdiffraction was performed on a quenched film using a Bruker D8 with an area detector and a collimated 500 μm Co Kα (λCo = 0.179 nm) beam. Scanning electron microscopy (SEM) was performed on a TESCAN Mira 3 to characterize the microstructure of samples before and after reaction. Cross-sectional samples were prepared by mounting in epoxy (Epoxy Technology Epotek 301) and mechanical polishing.2.4 Electrical resistivity
The electrical resistivity of foils, both as-deposited and post-reaction, as well as as-extruded and post-reacted lines of PVD particles were assessed by the standard 4-point probe method using a Signatone 1160 series probe station. Foils were reacted for electrical testing using the IPL system described above.3 Results
3.1 Rapid heating
Table 3 provides an overview of the ignition temperatures, IPL ignition energy densities, and reaction velocities of foils locally heated by an electric spark. Equivalent ignition temperatures for the IPL energy densities were calculated assuming a broadband absorptivity of α = 0.37 and assuming that the input energy uniformly heats the foil through its thickness. Literature values of α for Al (the surface layer) range from 0.1 to 0.5, depending on the method of measurement, sample preparation, oxide thickness, etc.46,47 Given that all foils were fabricated by the same method in the same chamber, we assume that they have a similar absorptivity and thus provide these temperatures to show the trend in ignition thresholds for IPL is very similar to that from the hot plate method.| Sample chemistry | Hot plate ignition temperature (°C) | IPL ignition energy density (J cm−2) | IPL equivalent temperature (°C) | Propagation velocity (m s−1) |
|---|---|---|---|---|
2Al![[thin space (1/6-em)]](https://www.rsc.org/images/entities/char_2009.gif) : :![[thin space (1/6-em)]](https://www.rsc.org/images/entities/char_2009.gif) 1.2Zr 1.2Zr![[thin space (1/6-em)]](https://www.rsc.org/images/entities/char_2009.gif) : :![[thin space (1/6-em)]](https://www.rsc.org/images/entities/char_2009.gif) C C |
397 | 2.30 | 365 | 0.68 ± 0.08 |
3Al![[thin space (1/6-em)]](https://www.rsc.org/images/entities/char_2009.gif) : :![[thin space (1/6-em)]](https://www.rsc.org/images/entities/char_2009.gif) 1.2Zr 1.2Zr![[thin space (1/6-em)]](https://www.rsc.org/images/entities/char_2009.gif) : :![[thin space (1/6-em)]](https://www.rsc.org/images/entities/char_2009.gif) C C |
458 | 3.07 | 465 | 0.53 ± 0.03 |
4.4Al![[thin space (1/6-em)]](https://www.rsc.org/images/entities/char_2009.gif) : :![[thin space (1/6-em)]](https://www.rsc.org/images/entities/char_2009.gif) Zr Zr![[thin space (1/6-em)]](https://www.rsc.org/images/entities/char_2009.gif) : :![[thin space (1/6-em)]](https://www.rsc.org/images/entities/char_2009.gif) C C |
538 | 3.85 | 556 | Did not propagate |
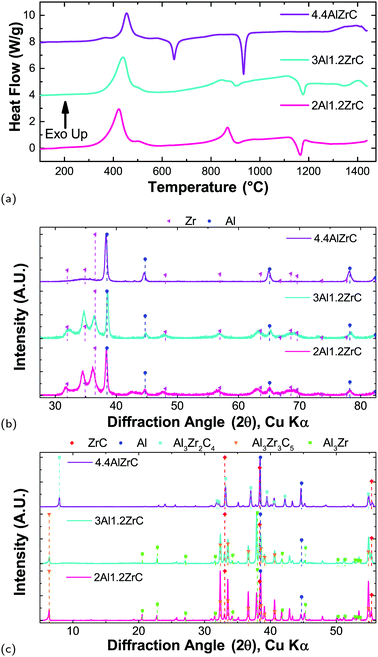
All foils tested with a uniform energy input by IPL or hot plate propagated through the foil thickness. However, when 4.4Al foils were tested using a local ignition source, a self-propagating reaction was not sustained along the length of the foil. All 2Al and 3Al foils reacted by both hot plate and IPL to form ZrC and Al as the predominant product phases. However, 4.4Al foils produced mixtures of Al3Zr, ZrC, and Al via hot plate ignition, and Al3Zr3C5, ZrC, and Al under IPL ignition. Fig. 3 shows the final phases determined by X-ray Diffraction (XRD) for foils reacted by the various fast-heating techniques. Some of the breadth to several of the ZrC peaks for 2Al and 3Al foils may be due to a small fraction of the ternary Al3Zr3C5.
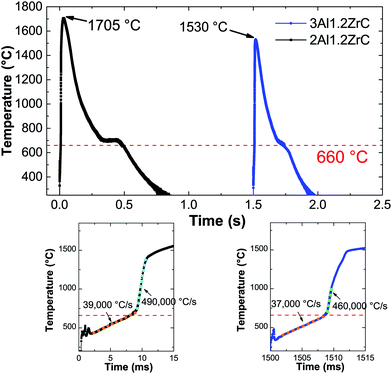
Fig. 4 shows representative temperature–time curves acquired by pyrometry for electrically ignited 2Al and 3Al foils. After applying an electric spark, both samples exhibit a short incubation period before a relatively constant local heating rate just below 40![[thin space (1/6-em)]](https://www.rsc.org/images/entities/char_2009.gif) 000 °C s−1. After passing the melting temperature of Al, the local heating rate increases rapidly to approximately 500
000 °C s−1. After passing the melting temperature of Al, the local heating rate increases rapidly to approximately 500![[thin space (1/6-em)]](https://www.rsc.org/images/entities/char_2009.gif) 000 °C s−1, comparable to other pyrometry based studies of reactive multilayers.44
000 °C s−1, comparable to other pyrometry based studies of reactive multilayers.44
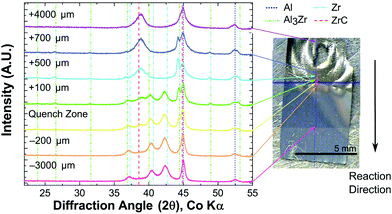
Given the lack of a self-propagating reaction in 4.4Al foils under local ignition, we investigated what intermediate phases may exist in the propagating reaction wave by micro-diffraction on a 2Al foil quenched during a self-propagating reaction. As seen in Fig. 5, an intermediate phase of Al3Zr is present near the quench zone, along with a large fraction of unreacted Al and Zr. Within a few hundred microns, however, the unreacted Zr disappears entirely, replaced by a mixture of predominantly ZrC and Al with some Al3Zr. In the fully reacted zone, only ZrC and Al are detectable, consistent with all fully reacted 2Al and 3Al foils.
3.2 Slow heating
Al/Zr/C foils heated slowly (0.33 °C min−1) evidence a clear effect of composition on the reaction pathway, as seen in Fig. 6. For all three compositions, there is a main exothermic peak associated with the formation of Al3Zr. The peak shifts to higher temperature as a function of Al content, with a maximum at 422 °C for 2Al, 439 °C for 3Al, and 456 °C for 4.4Al. For all compositions, there is a shoulder beyond the main exotherm at 500 °C, though its magnitude diminishes with increasing Al content. During the first heating, only the 4.4Al film – which has excess Al after conversion of Zr to Al3Zr – evidences an Al-melting endotherm. This, along with quenched X-ray data, support that after the first endotherm the predominant phase is Al3Zr.There is a second exothermic region for all compositions between 700 °C and 900 °C. This exotherm terminates in an endotherm which is much more noticeable for 4.4Al, but appears for all three compositions. The exotherm is fairly broad for 3Al and 4.4Al, but has a noticeable peak for 2Al. Quenching the samples at temperatures beyond the endotherm indicate conversion of some of the Al3Zr to ternary Al–Zr–C phases, such as Al3Zr2C4 and Al3Zr3C5. For the 2Al and 3Al compositions, there is an additional high temperature endotherm centered at 1170 °C, and all three have some exothermic behavior from 1300 °C to 1450 °C. As demonstrated by the final phases shown in Fig. 6(c), heating in the DTA yields poor conversion to ZrC, with the bulk of the material still Al3Zr or an Al–Zr–C ternary phase.
Apart from the Al melting endotherms for 4.4Al, the endotherms are not well attributable to either the ternary phases found in quenched foils or any binary phases. All three compositions have high temperature endotherms which exist in subsequent scans. Therefore there may be other phases which form and subsequently decompose at elevated temperatures and are not detectable after quenching. Similar behavior has been observed in Al–Ti–C with very low C content, where at high temperatures a peritectic reaction drives formation of a titanium carbide phase, an increasing amount of which persisted on cooling after repeated cycles.48 Our experiments show minimal changes in peak intensities after several cycles (not shown), but a similar reaction is likely still at play.
3.3 Microstructure
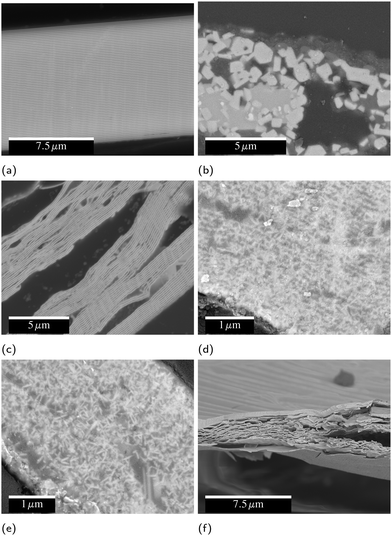
As seen in Fig. 7, during slow heating the layered structure of the as-deposited foil breaks down, and micron-scale cuboidal grains of the binary and ternary intermetallics form. The methods of fast-heating tested have some effect on the eventual microstructure, but none of them evidence micron-sized ZrC product, instead resulting in nanoscale ZrC. For 2Al and 3Al foils, all fast-heating methods induce significant fracturing resulting in internal porosity over multiple lengthscales, as is most evident in Fig. 7(f).Electrically ignited foils typically form multilayer sheet-like product phases of ZrC and Al under vacuum and in air. Unlike many reactive multilayers, the layering of the foil does not break down to form a coarse grained composite structure.49,50 Hot-plate ignited foils exhibit partial breakdown of the layered structure, with nanoscale ZrC needles growing into the Al matrix. Foils ignited by IPL have a further loss of the layered structure. For each of these fast-heating methods, there is some spread in the final microstructure seen in SEM, but the data presented in Fig. 7 is representative of the most common microstucture for each.
3.4 Printed physical vapor deposited particles
Inks created with PVD particles were extruded from a syringe (5 mL, Nordson EFD) with a 14 gauge nozzle, then dried on a 100 °C hot plate for 2 hours before testing, removing the solvent (DMF) and leaving a line composed of 98.8% PVD particles and 1.2% binder by mass. Some of these lines were then ignited with a hot wire to form a conductive product. Fig. 8 shows cross-sectional electron micrographs of these lines before and after reaction and highlights the highly-curved, fingernail-like shape of the particles. Because fabricating these particles is very costly, we utilized them to understand the fundamental materials science and demonstrate a proof of concept, but did not endeavor to produce the significant quantities required to develop a printable ink. In a forthcoming publication,19 we will report on a cost effective ball milling process to produce particles with equivalent composition suitable to scaled up printing.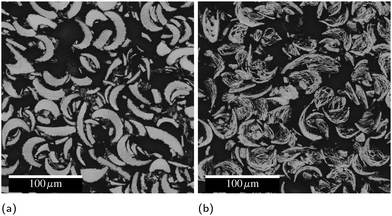 | ||
| Fig. 8 Cross-sectional electron micrographs of syringe-printed PVD particles (a) as printed and (b) after reaction. The black background is mounting epoxy. | ||
3.5 Electrical resistivity and film–film/particle–particle adhesion
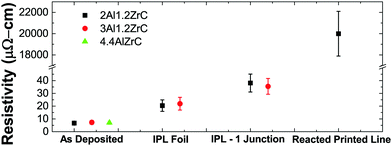
Electrical resistivity was measured by the four point method on as-deposited foils as well as on those reacted by IPL. To mimic the aggregation of multiple particles, multiple free-standing pieces of foil were held loosely together for IPL reaction by glass slides covering a small portion of the overlaps between pieces. Due to the small thermal mass of the foils and the short time at elevated temperature, they did not adhere well and frequently broke apart even with gentle handling. Attempts to join three or more foils together by this method in IPL were entirely unsuccessful, and samples with two junctions were too fragile to get sufficient valid measurements. 4.4Al foils would not join with even a single junction. The measured resistivities are summarized in Fig. 9. It is worth noting that the as-deposited measurements are likely probing mostly pure Al layers, and the post-reacted measurements are likely affected by the porous microstructure produced during SHS reaction.Syringe-extruded (printed) lines of PVD particles were also probed before and after SHS reaction. In sharp contrast to the foils, before reaction no measurement was possible, indicating that in the as-printed state the ink is non-conductive. However, after SHS reaction, the lines were conductive, demonstrating the desired on-demand transition from non-conductive to conductive. The lines had much higher resistivity than bulk foil samples due to poor joining of the particles, likely caused by the very thin molten aluminum regions and poor packing density of the oddly-shaped particles.43 In a forthcoming publication we will demonstrate that printed inks employing ball milled powders of the same composition are likewise non-conductive after printing, but achieve a post-reacted resistivity two orders of magnitude lower than printed PVD particles.19
4 Discussion
While there is no extant data on Al/Zr/C multilayers, Song et al.51,52 and Hu et al.53 have, respectively, published on SHS reactions and thermal explosion reactions in ball milled Al/Zr/C powders with varying aluminum contents. These allow for some interesting comparisons with our work. Song et al. showed that the phases formed can be shifted from Zr/C + Al (below 40 wt% Al) to Al3Zr + ZrC + Al + Al3Zr3C5 (starting at 40 wt% Al and very pronounced at 50 wt% Al), which they attribute to a decreased adiabatic reaction temperature with increasing Al content. Our 4.4Al films have a mass fraction of over 53 wt% Al, yet when initiated uniformly by IPL form predominantly ZrC and Al as the product phases. However, these films are unable to sustain a self-propagating reaction when ignited locally by an electric spark, and when initiated on a hot plate they similarly result in a mixture of Al3Zr, ZrC, and Al.Both Song and Hu claim that the maximum reaction temperature (above 1920 °C) being above the Al3Zr melting temperature (1580 °C) is crucial for the formation of ZrC.52,53 In the thermal traces of an SHS reaction in a pressed pellet of ball milled Al/Zr/C presented by Song et al., there is a clear multistep reaction over a period of 6 seconds which indicates that some intermediate Al3Zr melts,52 but for the thermal explosions measured by Hu there is no indication of Al3Zr melting during the reaction process. Likewise, in our pyrometry traces for both 2Al and 3Al foils (Fig. 4), we see no indication of Al3Zr melting. In the case of the 3Al foils, the maximum temperature does not even exceed the melting point of Al3Zr. Since the melting of Al precipitates a dramatic increase in the reaction rate (as evidenced by the heating rate),44 we posit that the heat released by Al and Zr mixing drives the reaction temperature up, facilitating the direct reaction between Zr and C which eventually consumes the Zr without Zr melting.
This explanation is consistent with the composition near a quench front presented in Fig. 5. Song et al. quenched a pressed pellet undergoing SHS and found significantly more Al3Zr near the quench region than presented here, suggesting that for these films with very fine reactant spacing the reaction can occur with significantly less Al3Zr formed to drive the ZrC formation.
During slow heating by DTA of their powder compacts, Hu et al. were able to form significantly more ZrC than reported here.53 This again can be attributed to the very fine reactant spacing in our thin films, where the Al3Zr reaction can go to completion in the DTA, whereas the powder compacts have an incomplete reaction between Zr and Al at lower temperatures (as verified by XRD), allowing for the direct reaction between Zr and C rather than necessitating the breakdown of Al3Zr or other intermetallic phases at high temperature.
Overall, these differences in both slow and fast heating and the differences in the initial microstructure suggest that for implementing the RAIL concept, the reactant spacing in the ink particles, as well as the thermal history of the printed lines, may have a large influence over their performance in producing the desired phases and therefore their electrical properties. The high temperature endotherms seen during slow heating (Fig. 6) are not well attributed, but are likely due to decomposition reactions of ternary phases present in the systems. The difference in location and shift of these endotherms between compositions is likely due to the different metastable ternary phases they form. We have begun investigations into the heating rate and composition – and thereby composition gradient54 – effects on the Al/Zr/C system using nanocalorimetry55in situ in a synchrotron56,57 to perform X-ray diffraction, which will be the focus of a future publication.
Ultimately, both the 3Al and 2Al films resulted in the desired product phases after self-propagation, and thus the question of intermediate phases is only an issue if an application will induce sufficient heat-sinking to retard the reaction. Since that may frequently be the case, Al-lean compositions with higher adiabatic reaction temperatures will likely be more successful commercially. A quick comparison of the pyrometry data presented in Fig. 4 demonstrates that not only can the lower Al-content material reach higher temperatures, but the time at sufficient temperature for Al to reflow is doubled. As mentioned previously, inks using ball milled Al/Zr/C powders based on the 2Al composition presented here are performing well and will be the focus of another publication. An example of a printed line of ball milled powders after reaction is presented in Fig. 2.
The success of these inks highlights some differences between the stochastic ball milled powders and the well-controlled thin films presented here. Firstly, the films presented here create significant voids when they react via SHS. In general, fracture and porosity in reacted thin films occurs due to gaseous products of reaction.58,59 While there may be some trapped gas in our foils from fabrication, it is more likely that the fractures occur due to thermal stresses developed by the different CTEs of the ZrC and Al layers during cooling from SHS. Foils quenched during SHS imaged in the SEM (ESI,† Fig. S1) demonstrated that the fracture began near the quench zone where ZrC was beginning to form, and over the course of 200 μm became very severe. This correlates well with the XRD analysis of the dominant phases near a quench front.
Comparable ball milled powders, on the other hand, demonstrate good particle agglomeration, so this issue seems to be intrinsic to the PVD foils and tied directly to the layered product phases and thin Al layers. The fracture and voiding in our films contribute to the relatively poor resistivity measurements presented in Fig. 9. The resistivity of bulk IPL-reacted foils nearly doubles when a junction is introduced, and attempts to create multiple junctions were unsuccessful. A reacted printed line of PVD particles increased the resistivity by several orders of magnitude. This indicates that the extremely controlled initial microstructure and of PVD materials may be disadvantageous. As we will explore in detail in a separate publication,19 ball milled materials can be fabricated and easily 3D printed by direct ink writing which, after reaction, have consistent resistivities on the order of 300 μΩ cm.
5 Conclusions
To overcome the limitations of currently available conductive inks, we propose a new paradigm: a reactive ink which is non-conductive in the as-printed state, but when ignited produces its own heat to form a thermally and mechanically stable, electrically conductive product phase. Herein, we explored the design of chemistries for this approach and tested Al/Zr/C as a candidate material system. We assessed how varying the Al content changes the phase formation sequence, linear propagation rate, and ignition threshold for highly microstructurally controlled thin films. We demonstrated that an Al content far below a theoretically predicted threshold retards the SHS reaction in these materials, resulting in undesired product phases. For sufficiently Al-lean compositions, the reaction temperatures during SHS can be lower than the melting point of the expected intermediate (Al3Zr), while still achieving apparently full conversion to the desired products. By SEM we determined the post-reacted microstructure changes gradually from layered product sheets to a more bicontinuous structure with increasing energy uniformity of the initiating source. In all cases, the foils and PVD particles generated internal voids, which we attribute to thermal stresses between layered product phases. The stochastic microstructure of ball milled powders appears to obviate this effect and provides for better agglomeration. We measured the electrical resistivity of foils and syringe-extruded lines of a PVD particle ink before and after reaction. Using that PVD particle ink, we demonstrated the on-demand switch from a non-conductive to a conductive state despite the limitations of the PVD particles. We posit that for actual applications, relatively Al-lean compositions – such as the 2![[thin space (1/6-em)]](https://www.rsc.org/images/entities/char_2009.gif) :
:![[thin space (1/6-em)]](https://www.rsc.org/images/entities/char_2009.gif) 1.2
1.2![[thin space (1/6-em)]](https://www.rsc.org/images/entities/char_2009.gif) :
:![[thin space (1/6-em)]](https://www.rsc.org/images/entities/char_2009.gif) 1 Al
1 Al![[thin space (1/6-em)]](https://www.rsc.org/images/entities/char_2009.gif) :
:![[thin space (1/6-em)]](https://www.rsc.org/images/entities/char_2009.gif) Zr
Zr![[thin space (1/6-em)]](https://www.rsc.org/images/entities/char_2009.gif) :
:![[thin space (1/6-em)]](https://www.rsc.org/images/entities/char_2009.gif) C composition presented here – are more likely to be successful due to their higher adiabatic temperature and the longer time available for Al to reflow, both of which will aid in forming the desired product phases and microstructure when dealing with heat losses from the ink binder and substrate.
C composition presented here – are more likely to be successful due to their higher adiabatic temperature and the longer time available for Al to reflow, both of which will aid in forming the desired product phases and microstructure when dealing with heat losses from the ink binder and substrate.
Conflicts of interest
GMF and SCB are inventors on US Patents 10308828 and 10240058 which relate to applications of the materials discussed herein for 3D printing electrical conductors.Acknowledgements
This work was funded by The Charles Stark Draper Laboratory, Inc. SQA gratefully acknowledges support through a Draper Fellowship from The Charles Stark Draper Laboratory, Inc.Notes and references
- J.-P. Kruth, M. Leu and T. Nakagawa, CIRP Ann., 1998, 47, 525–540 CrossRef.
- S. H. Huang, P. Liu and A. Mokasdar, Int. J. Adv. Manuf. Technol., 2013, 67, 1191–1203 CrossRef.
- A. Sasson and J. C. Johnson, Int. J. Phys. Distrib. Logist. Manag., 2016, 46, 82–94 CrossRef.
- G. Bai, PhD thesis, Virginia Polytechnic Institute and State University, 2005.
- S. B. Walker and J. A. Lewis, J. Am. Chem. Soc., 2012, 134, 1419–1421 CrossRef CAS PubMed.
- A. Albrecht, A. Rivadeneyra, A. Abdellah, P. Lugli and J. F. Salmerón, J. Mater. Chem. C, 2016, 4, 3546–3554 RSC.
- M. A. Skylar-Scott, S. Gunasekaran and J. A. Lewis, Proc. Natl. Acad. Sci. U. S. A., 2016, 113, 6137–6142 CrossRef CAS PubMed.
- P. Ho and H. Huntington, J. Phys. Chem. Solids, 1966, 27, 1319–1329 CrossRef CAS.
- J. R. Black, IEEE Trans. Electron Devices, 1969, 16, 338–347 CAS.
- D. A. Roberson, R. B. Wicker and E. Macdonald, J. Electron. Mater., 2012, 41, 2553–2566 CrossRef CAS.
- G. M. Fritz and S. C. Barron, Reactively Assisted Ink for Printed Electronic Circuits, 2019 Search PubMed.
- J. S. Nuechterlein and J. J. Iten, Reactive Additive Manufacturing, 2016 Search PubMed.
- A. Merzhanov and I. Borovinskaya, Dokl. Chem., 1972, 204, 366–369 CAS.
- G. M. Fritz, S. J. Spey, M. D. Grapes and T. P. Weihs, J. Appl. Phys., 2013, 113, 014901 CrossRef.
- B. Mason, L. Groven and S. F. Son, J. Appl. Phys., 2013, 114, 113501 CrossRef.
- A. H. Kinsey, K. Slusarski, E. Krumheuer and T. P. Weihs, J. Mater. Sci., 2017, 52, 11077–11090 CrossRef CAS.
- A. S. Rogachev, N. F. Shkodich, S. G. Vadchenko, F. Baras, D. Y. Kovalev, S. Rouvimov, A. A. Nepapushev and A. S. Mukasyan, J. Alloys Compd., 2013, 577, 600–605 CrossRef CAS.
- A. S. Mukasyan and A. S. Rogachev, J. Mater. Sci., 2017, 52, 11826–11833 CrossRef CAS.
- S. Q. Arlington, S. C. Barron, J. B. Delisio, J. C. Rodriguez, S. Vummidi Lakshman, J. W. Boley, J. A. Lewis, G. M. Fritz and T. P. Weihs, 2020, in preparation.
- W. M. Hayt, J. E. Kemmerly and S. M. Durbin, Engineering Circuit Analysis, McGraw-Hill, New York, 7th edn, 2007 Search PubMed.
- D. Adams, T. L. Alford and J. W. Mayer, Silver Metallization: Stability and Reliability, Springer, London, 2008, pp. 75–81 Search PubMed.
- H. J. Geier, PhD thesis, University of Florida, 1974.
- J. Howard, J. White and P. Ho, J. Appl. Phys., 1978, 49, 4083–4093 CrossRef CAS.
- R. N. Lumley, T. B. Sercombe and G. M. Schaffer, Metall. Mater. Trans. A, 1999, 30, 457–463 CrossRef.
- S. Mohan, A. Ermoline and E. L. Dreizin, J. Nanopart. Res., 2012, 14, 723 CrossRef.
- S. Fischer and M. Grubelich, Theoretical energy release of thermites, intermetallics, and combustible metals, Sandia national laboratories technical report, 1998.
- F. W. Clinard and C. P. Kempter, J. Less-Common Met., 1968, 15, 59–73 CrossRef CAS.
- S. J. Grisaffe, J. Am. Ceram. Soc., 1960, 43, 494 CrossRef CAS.
- R. O. Elliott and C. P. Kempter, J. Phys. Chem., 1958, 62, 3–4 CrossRef.
- M. W. Barsoum, MAX Phases: Properties of Machinable Ternary Carbides and Nitrides, Wiley-VCH Verlag GmbH & Co. KGaA, 2013 Search PubMed.
- J. R. Cooper and R. L. Hansler, J. Chem. Phys., 1963, 39, 248–249 CrossRef CAS.
- The Chemistry of Transition Metal Carbides and Nitrides, ed. S. Oyama, Chapman & Hall, 1996, p. 10 Search PubMed.
- L. Shacklette and W. S. Williams, Phys. Rev. B: Solid State, 1973, 7, 5041–5053 CrossRef CAS.
- E. K. Storms and C. P. Kempter, J. Chem. Phys., 1965, 42, 2043 CrossRef CAS.
- F. Modine, T. Haywood and C. Allison, Phys. Rev. B: Condens. Matter Mater. Phys., 1985, 32, 7743–7747 CrossRef CAS PubMed.
- A. Bouhemadou, R. Khenata and M. Chegaar, Eur. Phys. J. B, 2007, 215, 209–215 CrossRef.
- S. P. Murarka, J. Vac. Sci. Technol., 1980, 17, 775–792 CrossRef CAS.
- A. Hendaoui, M. Andasmas, A. Amara, A. Benaldjia, P. Langlois and D. Vrel, Int. J. Self-Propag. High-Temp. Synth., 2008, 17, 129–135 CrossRef CAS.
- S. P. Murarka, M. H. Read, C. J. Doherty and D. B. Fraser, J. Electrochem. Soc., 1982, 129, 293–301 CrossRef CAS.
- J. Dunlop, G. Gruner and A. Caplin, J. Phys. F: Met. Phys., 1974, 4, 2203–2217 CrossRef CAS.
- M. W. Barsoum, Prog. Solid State Chem., 2000, 28, 201–281 CrossRef CAS.
- B. M. Radovic and M. W. Barsoum, Am. Ceram. Soc. Bull., 2013, 92, 20–27 Search PubMed.
- G. M. Fritz, H. Joress and T. P. Weihs, Combust. Flame, 2011, 158, 1084–1088 CrossRef CAS.
- G. M. Fritz, J. A. Grzyb, O. M. Knio, M. D. Grapes and T. P. Weihs, J. Appl. Phys., 2015, 118, 135101 CrossRef.
- M. D. Grapes and T. P. Weihs, Combust. Flame, 2016, 172, 105–115 CrossRef CAS.
- J. H. Henninger, Solar Absorptance and Thermal Emittance of Some Common Spacecraft Thermal Control Coatings, Nasa technical report, 1984.
- E. C. Clausen, W. R. Penney, D. C. Marrs, M. V. Park, A. M. Scalia and N. S. Weston, Proceedings of the 2005 ASEE Gulf-Southwest Annual Conference, 2005.
- M. Schoenitz, X. Zhu and E. L. Dreizin, Scr. Mater., 2005, 53, 1095–1099 CrossRef CAS.
- A. S. Rogachev, S. G. Vadchenko, F. Baras, O. Politano and S. Rouvimov, Acta Mater., 2014, 66, 86–96 CrossRef CAS.
- S. Sen, M. Lake, R. Grieseler and P. Schaaf, Surf. Coat. Technol., 2017, 327, 25–31 CrossRef CAS.
- M. S. Song, B. Huang, M. X. Zhang and J. G. Li, Powder Technol., 2009, 191, 34–38 CrossRef CAS.
- M. S. Song, M. W. Ran and Y. Y. Kong, Int. J. Refract. Met. Hard Mater., 2011, 29, 392–396 CrossRef CAS.
- Q. Hu, M. Zhang, P. Luo, M. Song and J. Li, Int. J. Refract. Met. Hard Mater., 2012, 35, 251–256 CrossRef CAS.
- S. Q. Arlington, F. Yi, D. A. Lavan and T. P. Weihs, AIP Adv., 2019, 9, 035324 CrossRef.
- E. A. Olson, M. Y. Efremov, M. Zhang, Z. Zhang and L. H. Allen, J. Microelectromech. Syst., 2003, 12, 355–364 CrossRef.
- K. Xiao, J. M. Gregoire, P. J. McCluskey, D. Dale and J. J. Vlassak, J. Appl. Phys., 2013, 113, 243501 CrossRef.
- T. Neuhauser, G. Tinti, H. Leiste, N. Casati, M. Stüber and K. Woll, Acta Mater., 2020, 195, 579–587 CrossRef CAS.
- J. Zapata, A. Nicollet, B. Julien, G. Lahiner, A. Esteve and C. Rossi, Combust. Flame, 2019, 205, 389–396 CrossRef CAS.
- A. H. Kinsey, K. Slusarski, S. Sosa and T. P. Weihs, ACS Appl. Mater. Interfaces, 2017, 9, 22026–22036 CrossRef CAS PubMed.
Footnote |
| † Electronic supplementary information (ESI) available: Electron micrograph demonstrating fracture begins near the quench zone in a reacted thin film sample. See DOI: 10.1039/d0ma00148a |
| This journal is © The Royal Society of Chemistry 2020 |

