
 Open Access Article
 This Open Access Article is licensed under a Creative Commons Attribution-Non Commercial 3.0 Unported Licence
Nanoscopically and uniformly distributed SnO2@TiO2/C composite with highly mesoporous structure and bichemical bonds for enhanced lithium ion storage performances†
Meisheng
Han
ab,
Yongbiao
Mu
a and
Jie
Yu
 *ac
*ac
aSongshan Lake Materials Laboratory Dongguan, Guangdong 523808, China
bBeijing National Laboratory for Condensed Matter Physics, Institute of Physics, Chinese Academy of Sciences, Beijing 100190, China
cShenzhen Engineering Lab for Supercapacitor Materials, Shenzhen Key Laboratory for Advanced Materials, School of Material Science and Engineering, Harbin Institute of Technology, Shenzhen, University Town, Shenzhen 518055, China. E-mail: jyu@hit.edu.cn
First published on 5th May 2020
Abstract
The ultralow volume deformation (<4%) and low cost have aroused great interest in using TiO2 as the anode of lithium ion batteries (LIBs), but its low capacity (168 mA h g−1), no more than half of the theoretical capacity, limits its practical application in high-energy-density LIBs. In order to solve this problem, here we propose a one-step method for fabrication of the SnO2@TiO2/C nanocomposite, which features a superior nanoarchitecture with mesopores, interfacial chemical bonds, vast phase boundaries, carbon coating, and ultrasmall nanocrystals. These nanostructures endow SnO2@TiO2/C with a high capacity of 830.7 mA h g−1 at 0.5C after 100 cycles, excellent cyclability over 1000 cycles with negligible capacity loss per cycle (0.004%) at 10C, and a high lithium ion transport rate within a few seconds for one cycle. Importantly, the full cell with prelithiated SnO2@TiO2/C as the anode and commercial LiCoO2 as the cathode achieves a high energy density of 328.4 W h kg−1 at 0.1C and 245.9 W h kg−1 at 1C, which are superior to those of previously reported TiO2-based materials.
Introduction
Titanium dioxide (TiO2) has been regarded as a promising anode material in rechargeable lithium ion batteries (LIBs) due to its low cost, non-toxicity, and ultralow volume change (<4%) during lithium ion intercalation/deintercalation.1,2 TiO2 possesses a series of allotropes, such as anatase,3,4 rutile,5,6 and TiO2-B.7,8 Among them, anatase TiO2 has been widely investigated due to its inherent crystal structure for lithium ion storage.9,10 However, the low theoretical capacity (168 mA h g−1) corresponding to the formula of Li0.5TiO2 of anatase TiO2 cannot meet the ever-increasing demand of high-energy-density LIBs, thus limiting its practical use.3 In order to enhance the capacity of TiO2, a large number of efforts have been made: (i) preparing nanostructures like nanoparticles,3 nanotubes,4 nanosheets,11 and nanomembranes;12 (ii) fabricating mesoporous composites;13,14 (iii) forming phase boundaries;11 and (iv) constructing interfacial chemical bonds.1,15 Specifically, the design of nanostructures and mesoporous structure is intended to increase the contact area of active material with the electrolyte and shorten the transport distance of lithium ions, thus ensuring sufficient reaction between lithium ions and the active material to increase the reversible capacity. Additionally, the capacity can be enhanced by diminishing the particle size to the nanoscale, which can increase the number of interfaces between materials to accommodate more lithium ions.16,17 Similarly, introducing multi-phase compounds can increase the capacity by generating numerous phase boundaries to provide additional lithium ion storage sites.11 Furthermore, the formation of chemical bonds between multiple phases can create a strong interfacial force, which can not only enhance the structural stability of the active material and achieve high capacity retention, but also can enhance the capacity by increasing the diffusion depth of lithium and enabling more active materials to react with lithium ions.1,15 Accordingly, a TiO2-based anode with these structures can be assumed to deliver satisfactory capacity. Thus far, several TiO2-based anode materials with similar structures have been reported. For example, anatase TiO2 nanoparticles with mesoporous structure prepared by atomic layer deposition based on a sacrificial carbon template were shown to have a capacity of 158.4 mA h g−1 with a capacity retention of 80% after 100 cycles at 1C and a rate capability of 105 mA h g−1 at 5C.3 Additionally, a nanocomposite with ultrathin anatase TiO2 nanosheets embedded into TiO2-B nanodomains and vast phase boundaries formed within them was also reported to enhance the lithium ion storage capacity, with a specific capacity of 280 mA h g−1 at 0.5C and 190 mA h g−1 after 1000 cycles and a capacity retention of 86% at 10C.11 Moreover, a TiO2/graphene nanocomposite with strong Ti–O–C chemical bonds in the interfaces synthesized by a hydrothermal reaction exhibited a capacity of 206.7 mA h g−1 at 3C and 140.3 mA h g−1 after 100 cycles and a capacity retention of 87.7% at 30C.18 Furthermore, a high capacity of 227.2–274.0 mA h g−1 with good cyclability and rate performance during 200–800 cycles at a current density of 10C or lower was obtained by a TiO2@C nanocomposite prepared by a hydrothermal reaction followed by carbonization13 and a TiO2@reduced graphene oxide nanocomposite synthesized by aerosol-assisted spray drying followed by calcination.19Despite the improved lithium ion storage capacity, the above-mentioned TiO2-based nanocomposites are still low in capacity at various current densities. Besides, the synthesis steps of these nanocomposites were complex, involving sonicating, stirring, centrifuging, washing, drying, calcinating, and etching, coupled with some repeated operations, suggesting the necessity of a simple fabrication route for preparing high-capacity TiO2-based nanocomposites with the above-mentioned structures (i–iv) to promote their practical application.
Herein, we propose a one-step method for fabricating a highly mesoporous SnO2@TiO2/C nanocomposite with SnO2 nanocrystals homogeneously dispersed in the TiO2/C matrix and an average size of about 10 nm. The coexistence of multiple phases in the nanocomposites induces numerous phase boundaries and thus the formation of Sn–O–C and Ti–O–C chemical bonds. The addition of high-capacity SnO2 (13.0 wt%), coupled with these structural advantages, endows the SnO2@TiO2/C nanocomposite with a reversible capacity of 830.7 mA h g−1 after 100 cycles at 0.5C, higher than any of the reported TiO2-based anodes at a similar cycle number and current density. Furthermore, SnO2@TiO2/C is also shown to deliver excellent cyclability and rate performance in half and full cells.
Experimental
Materials
Tetrabutyl orthotitanate tetramer (C40H90O13Ti4, 99.9%, TOT) and monobutyltin oxide (C4H10O2Sn, 99.9%, MO) were purchased from Tokyo Chemical Industry (Tokyo, Japan); the electrolyte (1 M LiPF6 in a mixture of ethylene carbonate/diethylene carbonate/dimethyl carbonate at a volume ratio of 1![[thin space (1/6-em)]](https://www.rsc.org/images/entities/char_2009.gif) :1:1) from DoDoChem; acetylene black, Li foil, Cu foil, Al foil, polyvinylidene fluoride (PVDF), the Celgard 2400 membrane, n-methyl-2-pyrrolidone (NMP), and lithium cobaltate (LiCoO2) from MTI Corporation; and the stabilized lithium metal power (SLMP) from FMC Lithium Co.
:1:1) from DoDoChem; acetylene black, Li foil, Cu foil, Al foil, polyvinylidene fluoride (PVDF), the Celgard 2400 membrane, n-methyl-2-pyrrolidone (NMP), and lithium cobaltate (LiCoO2) from MTI Corporation; and the stabilized lithium metal power (SLMP) from FMC Lithium Co.
Preparation of TiO2/C and SnO2@TiO2/C
The precursor solution was obtained by dissolving 0.2 g MO in 1 g TOT, then transferring the solution into a reaction vessel and sealing it in a glove box under an argon environment. SnO2@TiO2/C was prepared by heating the vessel to 600 °C at 10 °C min−1, maintaining it for 0.5 h in a tube furnace with flowing Ar, and then cooling to room temperature naturally. Meanwhile, TiO2/C was synthesized by heating pure 1 g TOT under the same conditions.Characterization
The morphology, structure, and composition of the obtained samples were characterized using a scanning electron microscope (SEM, Hitachi S-4700), transmission electron microscope (TEM, FEI Talos F200x) with an X-ray energy dispersive spectrometer (EDS), accelerated surface area and porosimetry system (Micromeritics ASAP 2010), X-ray diffractometer (XRD, D/max-2500/PC, Rigaku), Raman spectrometer (Renishaw RM-1000), X-ray photoelectron spectrometer (XPS, Thermo Scientific Escalab 250Xi), thermogravimetric analyzer (TGA, STA449 F3 Jupiter), and inductively coupled plasma atomic emission spectrometer (ICP-AES). The electrical conductivity of the samples was tested with a powder electrical resistivity tester (ST-2722, Suzhou Jingge Electronic Co., Ltd, China).Electrochemical measurements
The electrodes were prepared by coating a mixture of active materials, acetylene black, and PVDF at a weight ratio of 8:1:1 on Cu foil, followed by drying at 80 °C for 12 h in a vacuum oven. The mass of active material loaded on each electrode was about 1.2 mg cm−2. The electrochemical performances were measured via assembling a 2032 coin-type cell in a glove box filled with pure argon, which consisted of the prepared electrode, Li foil, a Celgard 2400 membrane, and the electrolyte. The electrochemical performances of the cells were measured on a Land CT2001A battery-test system (Wuhan Land Electronic Co., China) in the voltage range of 0.01–3.00 V (vs. Li/Li+) and at current densities of 1–50C (1C = 168 mA g−1). The electrochemical impedance spectra (EIS) were measured in the frequency range of 105 to 10−2 Hz with an amplitude of 5 mV, and the cyclic voltammogram (CV) in the voltage range of 0.01 to 3.00 V (vs. Li/Li+) at scanning rates of 0.1–10 mV s−1 on a CHI 760D electrochemical workstation (Shanghai CH Instruments Co., China). In the full cell, the cathode electrode consisted of LiCoO2 (90 wt%), PVDF (5 wt%), and acetylene black (5 wt%) on Al foil, and the N/P ratio was 1.1 at a mass loading of 2.0 and 10.5 mg cm−2 for SnO2@TiO2/C and LiCoO2, respectively. Before assembling the coin-type full cell, the SnO2@TiO2/C electrode was pre-lithiated by using the commercial SLMP to improve its first coulombic efficiency (CE). The specific process has been reported in our previous report.15 For full-cell testing, the cycling curves were measured at 0.1C (1C = 0.14 A g−1) and rate curves were tested at 0.2–1C in the voltage window of 1.0–3.6 V. All cells were tested at room temperature.
Results and discussion
Fig. 1 shows the SEM images of TiO2/C. In Fig. 1a, TiO2/C exhibits a spherical shape with an average size of 2.5 μm due to the high vapor pressure, with its formation mechanism being discussed in detail in our previous reports.20,21 Interestingly, adding MO into TOT led to the formation of nanoparticles with an average size of 15 nm (Fig. 1b), indicating that MO addition facilitates nanocomposite formation in the vapor pressure-induced reaction process.15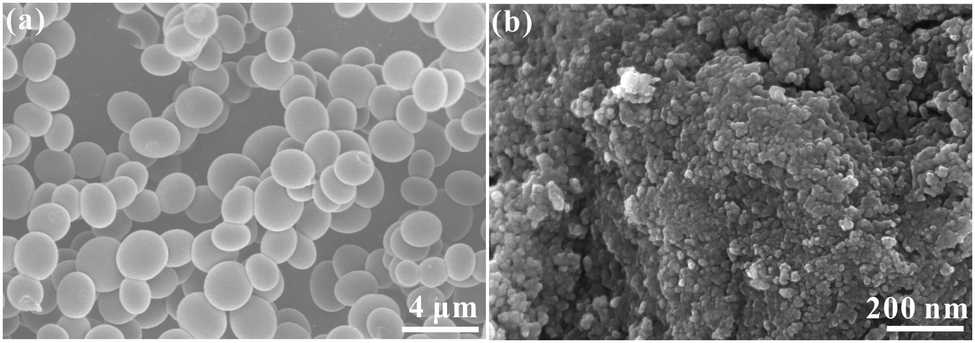 | ||
| Fig. 1 SEM images of TiO2/C (a) and SnO2@TiO2/C (b). | ||
In the XRD patterns (Fig. 2a), the two samples show diffraction peaks at 25.3, 37.8, 48.1, 53.9, 54.9, 62.6, 68.7, 75.1, and 82.7°, corresponding, respectively, to the (101), (004), (200), (105), (211), (204), (116), (215), and (224) crystal planes of anatase TiO2 (JCPDS: 21-1272), suggesting the successful synthesis of anatase TiO2. Besides, SnO2@TiO2/C exhibits four peaks at 26.6, 33.8, 51.8, and 66.1°, corresponding, respectively, to the (110), (101), (211), and (301) crystal planes of crystalline SnO2 (JCPDS No. 41-1445), indicating the formation of SnO2. In the Raman spectra with the insert for the enlarged image of SnO2@TiO2/C in the range of 100–835 cm−1 (Fig. 2b), the two samples show obvious Raman peaks of anatase TiO2 at around 148.7, 392.4, 506.6, and 630.9 cm−1 (Fig. 2b), corresponding to the Eg, B1g, A1g, and Eg modes,3,12 as well as two peaks around 1323.8 and 1590.5 cm−1, corresponding to the D and G peaks of carbon materials,15,22,23 respectively, indicating the existence of anatase TiO2 and free carbon. Obviously, SnO2@TiO2/C exhibits the Raman peak of SnO2 at about 770 cm−1, suggesting the presence of SnO2 in the sample. Meanwhile, the D peak arises from a double resonance process involving a phonon and a defect, while the G peak is attributed to in-plane vibrations and E2g symmetry. Due to the overlap of the D and G peaks, peak fitting was performed, and additional peaks appeared at about 1240 and 1500 cm−1, labeled as I and D′′, respectively. The I peak is related to disorder in the graphitic lattice or sp2–sp3 bonds,22,23 while the D′′ peak is known to occur in the presence of amorphous carbon.22,23 Besides, the intensity ratios of the D and G (ID/IG) peaks indicate the disorder degree of the graphitic structure,22,23 which are close to each other for the two samples (0.68 for SnO2@TiO2/C and 0.67 for TiO2/C), suggesting a similar disorder degree for the carbon in both of them. Furthermore, the high ratio of ID/IG indicates the existence of vast defects in the carbon, which favors lithium ion storage.
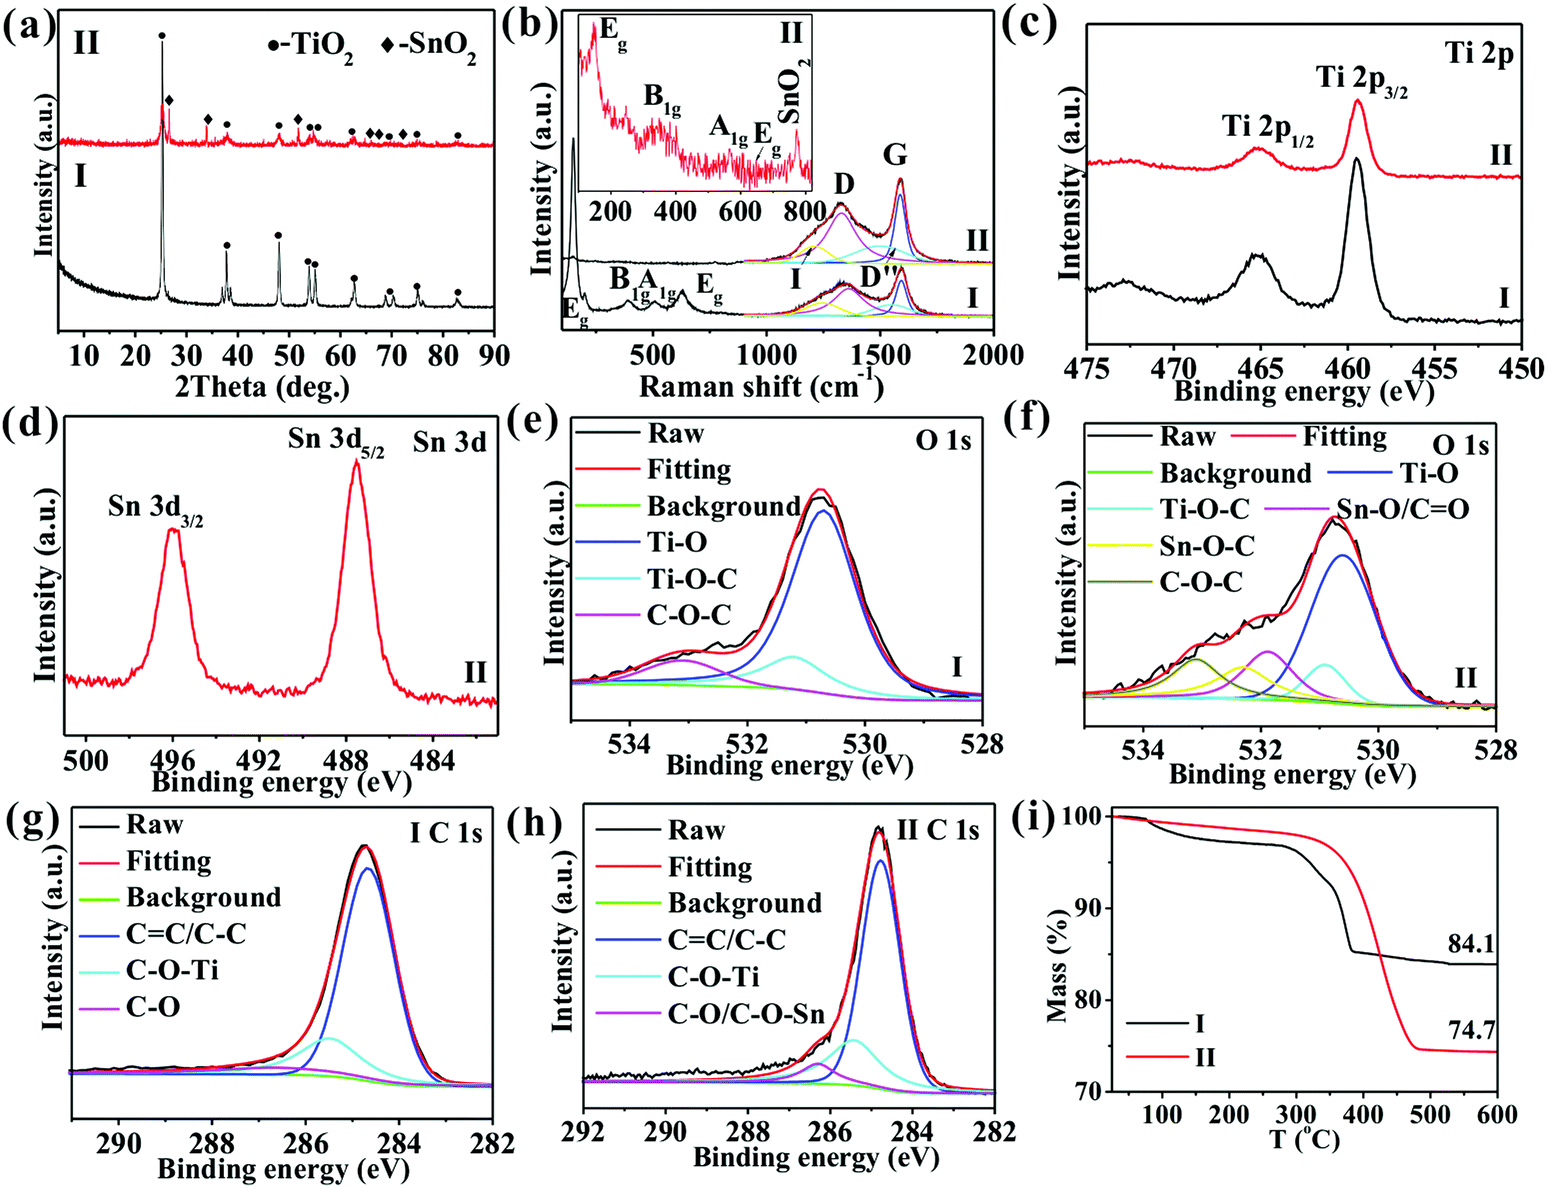 | ||
| Fig. 2 (a) XRD, (b) Raman spectra, (c–h) XPS spectra of Ti 2p (c), Sn 3d (d), O 1s (e and f), and C 1s (g and h), and (i) TG curves of TiO2/C (I) and SnO2@TiO2/C (II). | ||
The contents of the elements in the precursor and the two samples are shown in Table S1, ESI.† The obtained samples are seen to retain the elements of the precursor apart from H. Furthermore, compared with the precursor, the obtained samples show an increase in the mass percentages of Ti and Sn elements while a decrease in the mass percentages of C and H. These results suggest that a large number of C,H-containing substances were produced by the decomposition of the precursors at a high temperature, which could not be converted into solids under high pressure, leading to a decrease in the mass of C and H. According to the XPS results (Fig. S1, ESI†), the atomic ratio of O and Ti is around 2.11, approaching the theoretical value of TiO2, and the atomic ratio of O and Sn is about 2.02, close to the theoretical value of SnO2, indicating the formation of TiO2 and SnO2. Additionally, the two samples show two XPS peaks around 465.2 and 459.4 eV due to the binding energies of Ti 2p3/2 and Ti 2p1/2 of anatase TiO2,1,3 respectively (Fig. 2c), further suggesting the formation of anatase TiO2. The SnO2@TiO2/C samples exhibit two Sn 3d peaks of Sn4+ 3d3/2/3d5/2 at around 495.9/487.5 eV (Fig. 2d), again indicating the formation of SnO2.24,25 The two samples also show a wide peak of O 1s from 528.8 to 534.4 eV, which can be fitted using five peaks (Fig. 2e and f): Ti–O bonds at 530.7 eV,26,27 Ti–O–C bonds at 531.2 eV,26,27 Sn–O/C![[double bond, length as m-dash]](https://www.rsc.org/images/entities/char_e001.gif) O at 531.5 eV,28 Sn–O–C at 532.3 eV,28 and C–O–C at 533.1 eV,26,28 confirming the formation of Ti–O–C and Sn–O–C bonds. The C 1s peaks of the two samples are fitted using three peaks (Fig. 2g and h): CC/C–C at 284.8 eV,22 Ti–O–C at 285.4 eV,26,29 and C–O/C–O–Sn at 286.2 eV,30 further confirming the formation of the Ti–O–C and Sn–O–C bonds. The percentage of Ti–O–C bonds increases from 20.7 for TiO2/C to 25.5% for SnO2@TiO2/C (Table S2, ESI†), due to the production of more interfaces between TiO2 and C by the smaller-sized TiO2 nanoparticles in SnO2@TiO2/C. Additionally, the Sn–O–C bonds increase from 0 to 4.1% with the addition of MO into TOT (Table S2, ESI†). The high content of Ti–O–C and Sn–O–C bonds favors lithium ion storage. Since the XPS technique can only detect the surface (several nanometers) composition of the material, the XPS spectra of SnO2@TiO2/C in the deeper area were also tested to further confirm the presence of chemical bonds of Ti–O–C and Sn–O–C bonds inside the sample. Briefly, the sample powders were compressed into a thin plate, followed by bombarding it with argon ions for 30 min, and testing the bombarded area by XPS. The XPS results (Fig. S2, ESI†) are consistent with the data in Fig. 2c–h, indicating that the chemical bonds of Ti–O–C and Sn–O–C are distributed in the whole SnO2@TiO2/C sample. ICP-AES results reveal the mass percentages of Sn/Ti as 0/50.3 and 10.2/36.8 wt%, indicating that the mass contents of SnO2/TiO2/C are 0/83.9/16.1 wt% and 13.0/61.3/25.7 wt%, corresponding to TiO2/C and SnO2@TiO2/C, respectively (Table S3, ESI†). The TG curves (Fig. 2i) show that the mass percentages of the residuals post high temperature oxidation are 84.1 and 74.7%, corresponding to TiO2/C and SnO2@TiO2/C, respectively, suggesting that the respective carbon content is 15.9 and 25.3 wt%, which are consistent with the ICP-AES results.
O at 531.5 eV,28 Sn–O–C at 532.3 eV,28 and C–O–C at 533.1 eV,26,28 confirming the formation of Ti–O–C and Sn–O–C bonds. The C 1s peaks of the two samples are fitted using three peaks (Fig. 2g and h): CC/C–C at 284.8 eV,22 Ti–O–C at 285.4 eV,26,29 and C–O/C–O–Sn at 286.2 eV,30 further confirming the formation of the Ti–O–C and Sn–O–C bonds. The percentage of Ti–O–C bonds increases from 20.7 for TiO2/C to 25.5% for SnO2@TiO2/C (Table S2, ESI†), due to the production of more interfaces between TiO2 and C by the smaller-sized TiO2 nanoparticles in SnO2@TiO2/C. Additionally, the Sn–O–C bonds increase from 0 to 4.1% with the addition of MO into TOT (Table S2, ESI†). The high content of Ti–O–C and Sn–O–C bonds favors lithium ion storage. Since the XPS technique can only detect the surface (several nanometers) composition of the material, the XPS spectra of SnO2@TiO2/C in the deeper area were also tested to further confirm the presence of chemical bonds of Ti–O–C and Sn–O–C bonds inside the sample. Briefly, the sample powders were compressed into a thin plate, followed by bombarding it with argon ions for 30 min, and testing the bombarded area by XPS. The XPS results (Fig. S2, ESI†) are consistent with the data in Fig. 2c–h, indicating that the chemical bonds of Ti–O–C and Sn–O–C are distributed in the whole SnO2@TiO2/C sample. ICP-AES results reveal the mass percentages of Sn/Ti as 0/50.3 and 10.2/36.8 wt%, indicating that the mass contents of SnO2/TiO2/C are 0/83.9/16.1 wt% and 13.0/61.3/25.7 wt%, corresponding to TiO2/C and SnO2@TiO2/C, respectively (Table S3, ESI†). The TG curves (Fig. 2i) show that the mass percentages of the residuals post high temperature oxidation are 84.1 and 74.7%, corresponding to TiO2/C and SnO2@TiO2/C, respectively, suggesting that the respective carbon content is 15.9 and 25.3 wt%, which are consistent with the ICP-AES results.
Fig. 3 shows the high angle annular dark field (HAADF) image and its corresponding EDS mapping images. Ti, O, and C elements are seen to be uniformly distributed on the surface of TiO2/C spheres (Fig. 3a–d). The average size of TiO2 particles in the TiO2/C spheres is shown to be about 45 nm by measuring the crushed powder, with a decrease of 10 nm in the size of the nanoparticles after adding MO into TOT (Fig. 3f), which agrees with the SEM observation (Fig. 1b). In Fig. 3g, carbon layers can be seen at the edge of the sample, confirming the presence of the carbon coating. Fig. 3h shows the lattice fringes of the (101) crystal plane of anatase TiO2 and (110) crystal plane of SnO2, corresponding, respectively, to the highest diffraction peaks of TiO2 at 25.3° and SnO2 at 26.6° (Fig. 2a). Besides, it can be clearly observed that the nanocrystals are well interconnected by C, combined with the existence of vast chemical bonds of Ti–O–C and Sn–O–C, suggesting that the nanocomposite possesses the superior nanoarchitecture of C/C–O–Ti/TiO2/Ti–O–C/C/C–O–Sn/SnO2/Sn–O–C/C. In Fig. 3i, the selected area electron diffraction (SAED) pattern shows the Debye–Scherrer ring patterns of the (101), (004) and (211) crystal planes of anatase TiO2 as well as the (110) and (221) crystal planes of SnO2, further confirming the existence of TiO2 and SnO2 nanocrystals. In Fig. 3j–n, HAADF and its corresponding EDS elemental mapping images show the even distribution of Ti, Sn, O, and C elements, verifying the homogeneous dispersion of TiO2, SnO2, and free carbon in the nanocomposite. The homogeneous dispersion structure at the nanoscale could induce numerous phase boundaries or interfaces, contributing to lithium ion storage.
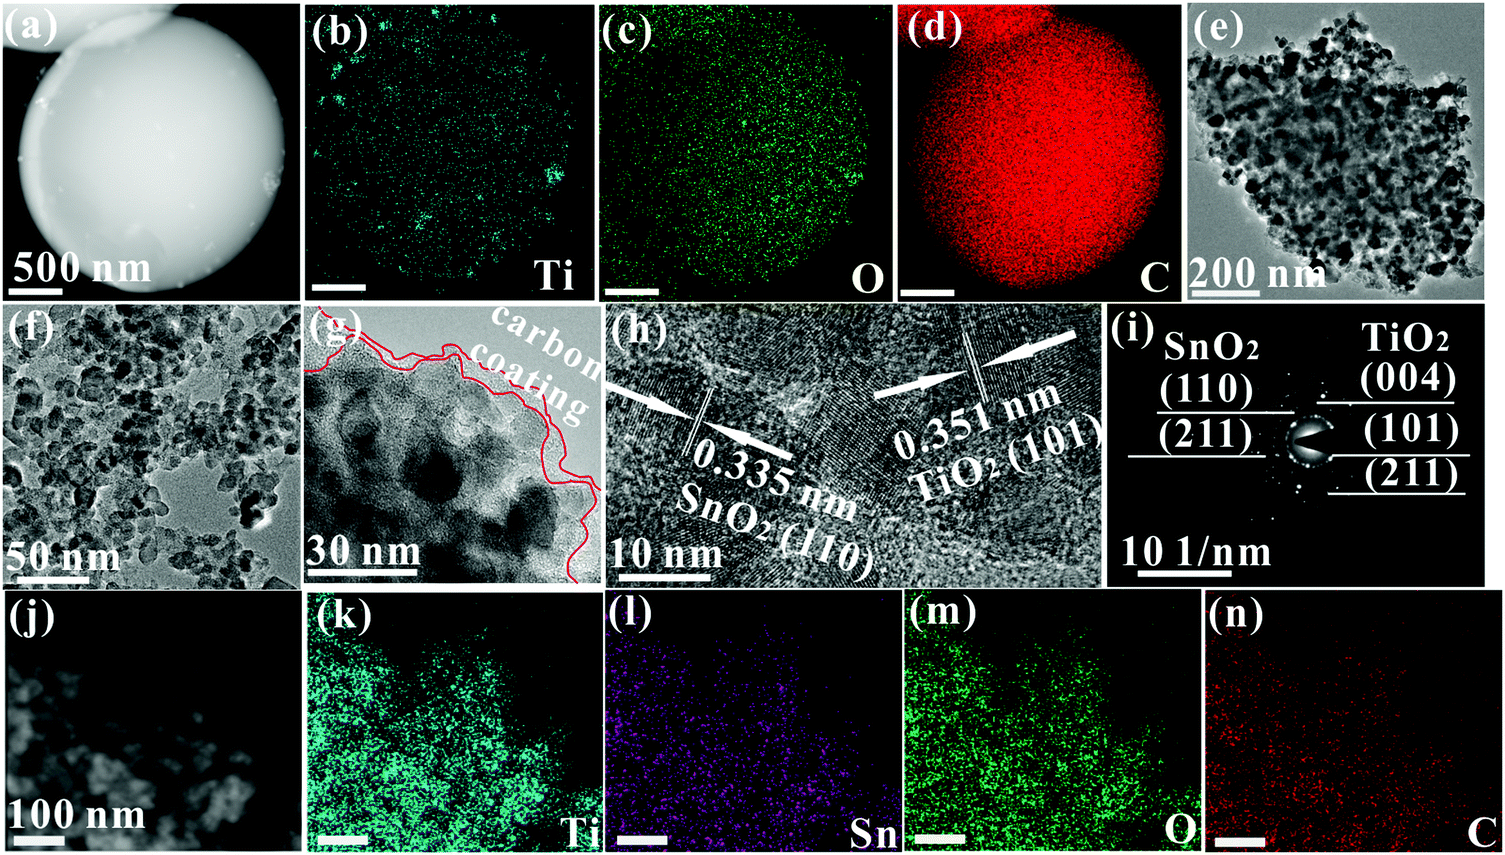 | ||
| Fig. 3 (a) High angle annular dark field image and the corresponding EDS elemental mapping images of Ti (b), O (c), and C (d) of TiO2/C spheres; (e) TEM image of crushed TiO2/C spheres; (f) TEM image, (g and h) HRTEM image, and (i) the corresponding SAED pattern of SnO2@TiO2/C; and (j) HAADF image and the corresponding EDS elemental mapping images of Ti (k), Sn (l), O (m), and C (n) of SnO2@TiO2/C. | ||
Fig. 4 shows the Brunauer–Emmett–Teller (BET) surface area and Barrett–Joyner–Halenda (BJH) pore-size distribution of the samples determined by nitrogen adsorption–desorption isotherms. The two samples exhibit a typical type-IV isotherm, indicating that they possess a mesoporous structure. Due to the formation of nanostructure, SnO2@TiO2/C has a significantly higher value than TiO2/C in the BET surface area (143.3 m2 g−1versus 11.8 m2 g−1) and pore volume (0.86 cm3 g−1versus 0.06 cm3 g−1), with mesopores centered at 5.3 nm for the former and 11.1 nm for the latter. Comparatively, the disadvantage of the highly mesoporous structure of the SnO2@TiO2/C nanocomposite involves the increase of the active material specific surface area, contributing to the formation of more solid electrolyte interface (SEI) film during the first cycle and decreasing the first coulombic efficiency (CE). However, this disadvantage can be improved by the commercial prelithiation technique.15 Accordingly, the low CE of our SnO2@TiO2/C anode is not an obstacle to its practical application. More importantly, the porous structure possesses several advantages: (i) favoring the contact of the active material with the electrolyte; (ii) shortening the diffusion distance of Li+; (iii) facilitating the storage of additional Li+; and (iv) accommodating the volume change of the active material upon cycling, thus leading to enhanced capacity, cycling life, and rate performance.13,14 Collectively, the preparation of a porous structure is favorable for lithium ion storage.
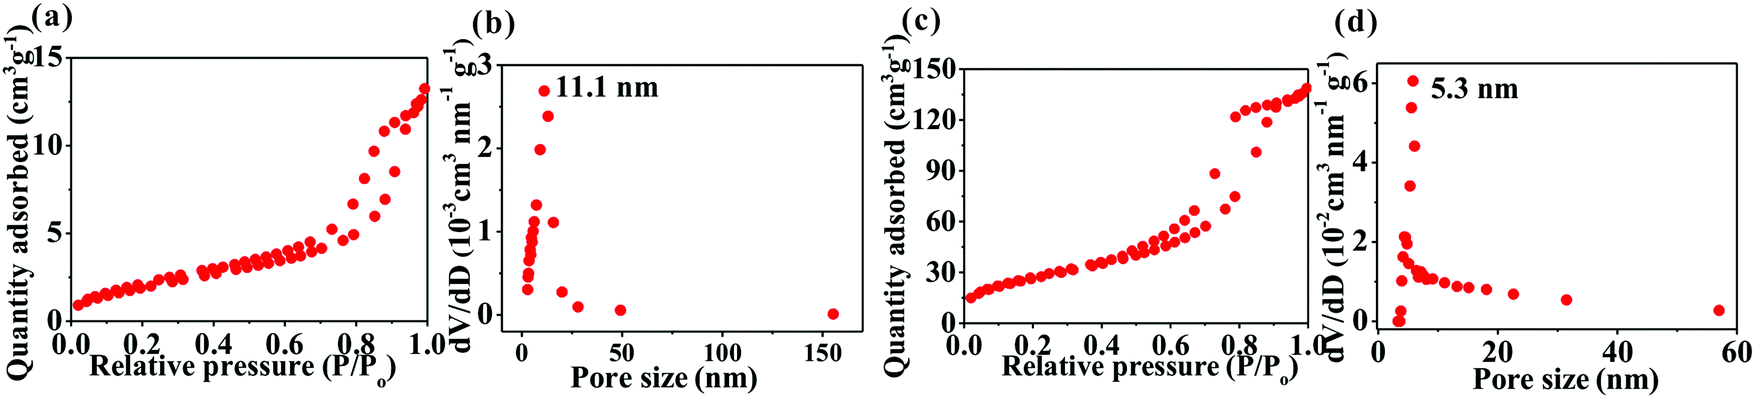 | ||
| Fig. 4 Nitrogen adsorption–desorption isotherms and pore-size distribution of TiO2/C (a and b) and SnO2@TiO2/C (c and d). | ||
Fig. 5 shows the charge/discharge and cycling curves of the two samples. Different from the first charge/discharge curve of TiO2/C, SnO2@TiO2/C exhibits two potential plateaus below 0.6 V in the charge/discharge curves, attributed to the delithiation/lithiation of SnO2.21,31 Additionally, SnO2@TiO2/C does not show obvious delithiation plateaus of anatase TiO2 at 2.15 V, probably due to the contribution of SnO2 and higher carbon content.15 The reversible capacity of the active material has been reported to be associated with the relative content of each component, the particle size, and the number of phase boundaries and chemical bonds at the interface.15,21 Due to low theoretical capacity of anatase TiO2, adding high-capacity active material can greatly enhance the capacity of TiO2-based anodes, such as SnO2 and amorphous carbon. Owing to the low electrical conductivity (EC) of anatase TiO2, adding materials with higher EC can considerably improve the electrical connectivity of the whole electrode, enabling more active materials to react with lithium ions and thus increasing the specific capacity.21 The EC is shown to increase with a rise in the carbon content (Table S4, ESI†). As previously reported, active materials with a nanoscale size possess higher specific capacity than their corresponding bulk materials, because nano-sized materials can remarkably shorten the lithium ion diffusion distance and achieve deeper lithiation to enhance the capacity.3,4 Introducing more components into the active materials can generate more phase boundaries to store extra lithium ions and enhance the reversible capacity.11 The formation of chemical bonds in the interface of each phase can increase the interfacial defects, EC, and structure stability, thus achieving higher capacity and cyclability.1,15 In Fig. 5b and Table S5, ESI,† SnO2@TiO2/C is seen to have a higher specific capacity (830.7 mA h g−1) than TiO2/C (169.6 mA h g−1) after 100 cycles due to its larger amount of SnO2, C, Sn–O–C, and Ti–O–C bonds as well as higher EC (Tables S2–S4, ESI†).
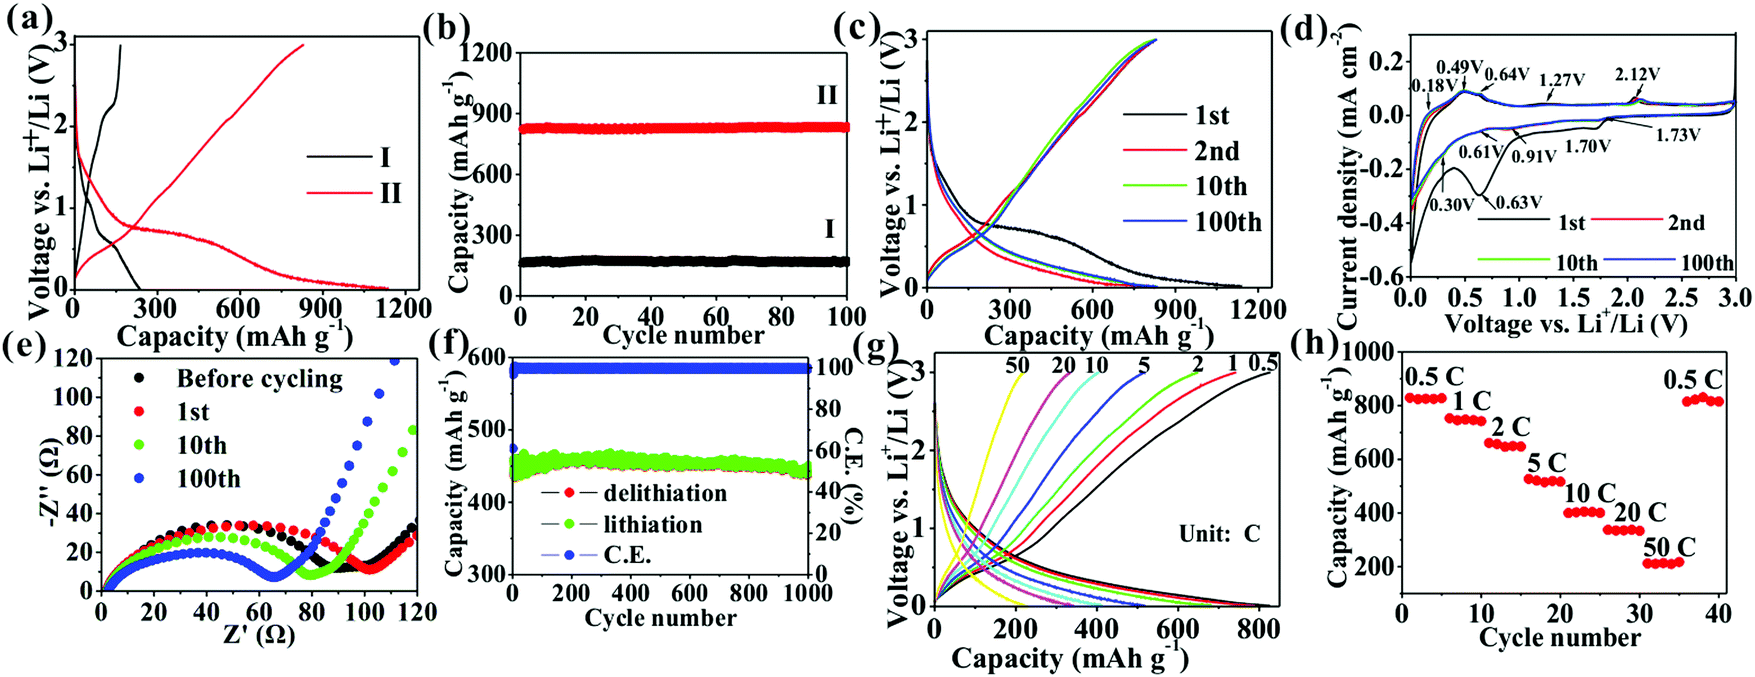 | ||
| Fig. 5 (a) First charge/discharge curves; (b) cycling curves at 0.5C of TiO2/C (I) and SnO2@TiO2/C (II); (c) charge/discharge curves at different cycles; (d) CV curves; (e) Nyquist plots; (f) cycling performance at 10C; (g) charge/discharge curves at different current densities; and (h) rate performance of SnO2@TiO2/C. | ||
The electrochemical performance of SnO2@TiO2/C was further investigated. Fig. 5c shows its voltage profiles at different cycle numbers. The first discharge and charge capacities are 1141.2 and 823.4 mA h g−1, respectively, with a first CE of 72.2%. The low CE has been reported to arise from the formation of an SEI layer and Li2O.15,21 The subsequent charge/discharge curves retain a similar shape, indicating the high stability of the electrode structure during cycling. After 100 cycles, a high reversible capacity of 830.7 mA h g−1 is observed, corresponding to a capacity retention of 100.9%. The increased post-cycling capacity may result from interfacial Li+ storage and electrochemical activation.15 In the present study, the obtained reversible capacity (830.7 mA h g−1) is higher than that of any previously reported TiO2-based anode (Table S6, ESI†), due to the formation of a large number of phase boundaries, chemical bonds, and mesoporous sites in the nanocomposite, facilitating the storage of more lithium ions and thus increasing the capacity.1,11,13 Additionally, adding a high amount of SnO2 and C also contributes to the enhancement of the capacity, leading to a high reversible capacity of 1419.5 mA h g−1 for the SnO2/C nanocomposite (Fig. S3, ESI†). Fig. 5d shows the CV curves of SnO2@TiO2/C, with the presence of the characteristic anodic peaks at about 2.12 V and cathodic peaks at about 1.73 V of anatase TiO2.9,10 Besides, the three anodic peaks and two cathodic peaks below 0.7 V belong to the delithiation and lithiation behaviors of SnO2, respectively.21,31 Interestingly, the presence of a pair of oxidation and reduction peaks at 1.27 and 0.91 V is not the typical delithiation/lithiation behavior of TiO2, SnO2, or C, which may be attributed to the formation of a new reversible lithium ion storage site by phase boundaries, defects, interfacial chemical bonds, and the mesoporous structure. Fig. 5e shows the Nyquist plots at different cycle numbers. The EIS were fitted to an equivalent circuit (Fig. S4, ESI†), where Rs is the electrolyte resistance, corresponding to the intersection of the high-frequency oblique line and the horizontal axis;32Rct, the charge transfer resistance, corresponding to the diameter of the depressed semicircle;32 and W, the Warburg impedance of Li+ ion diffusion, corresponding to the low-frequency slope line.32 The values of Rs and Rct at different cycle numbers are shown in Table S7, ESI.† With a rise in the cycle number, the Rs value is shown to gradually increase, suggesting the increase of the electrolyte resistance with increasing cycling number. Meanwhile, the Rct value is seen to increase after the 1st cycle due to the formation of an SEI layer, followed by a gradual decrease, probably due to electrochemical activation on cycling.15 The decrease of Rct favors the enhancement of the capacity and cyclability. In Fig. 5f, a long cycling life is shown at 10C, with a high specific capacity of 438.5 mA h g−1 at a 0.004% capacity loss per cycle after 1000 cycles as well as an average CE of 99.72% during 2–1000 cycles, indicating the high reversibility of the electrode during cycling. The lithium ion transport of SnO2@TiO2/C was investigated by measuring the rate capability at current densities of 0.5 to 50C (Fig. 5g and h), and the shape of the charge/discharge curves remains unchanged at different current densities, indicating that the electrode structure is stable during rate testing. The rate capacities are measured as 827.4, 742.2, 647.8, 516.8, 400.6, 333.5, and 217.7 mA h g−1 at 0.5, 1, 2, 5, 10, 20, and 50C, respectively, with a high capacity of 217.7 mA h g−1 at 50C, sufficiently proving the excellent rate performance of SnO2@TiO2/C. Importantly, the specific capacity returns to almost 100% of the initial capacity with the current density back to 0.5C, confirming that the electrode structure is still highly stable even after high current charging and discharging. Our SnO2@TiO2/C nanocomposite is superior to other TiO2-based anodes in cycling and rate performances (Table S6, ESI†). Especially, the rate capability is comparable and even superior to that of other anodes, such as a Sn-based anode, a SiOx/SiOy membrane, a Si nanotube, Nb18W16O93, a Li4Ti5O12 nanowire, and a graphite/Si/carbon composite (Table S8, ESI†).
The reasons for the high capacity of SnO2@TiO2/C are further explored by estimating the pseudocapacity contribution in the total capacity using CV curves at different scanning rates (Fig. 6a). The relationship between the scanning rate (v) and peak current (ip) satisfies the following eqn (1):
log(i) = a![[thin space (1/6-em)]](https://www.rsc.org/images/entities/i_char_2009.gif) log(v) + log(b) log(v) + log(b) | (1) |
| i (V) = k1v1/2 + k2v | (2) |
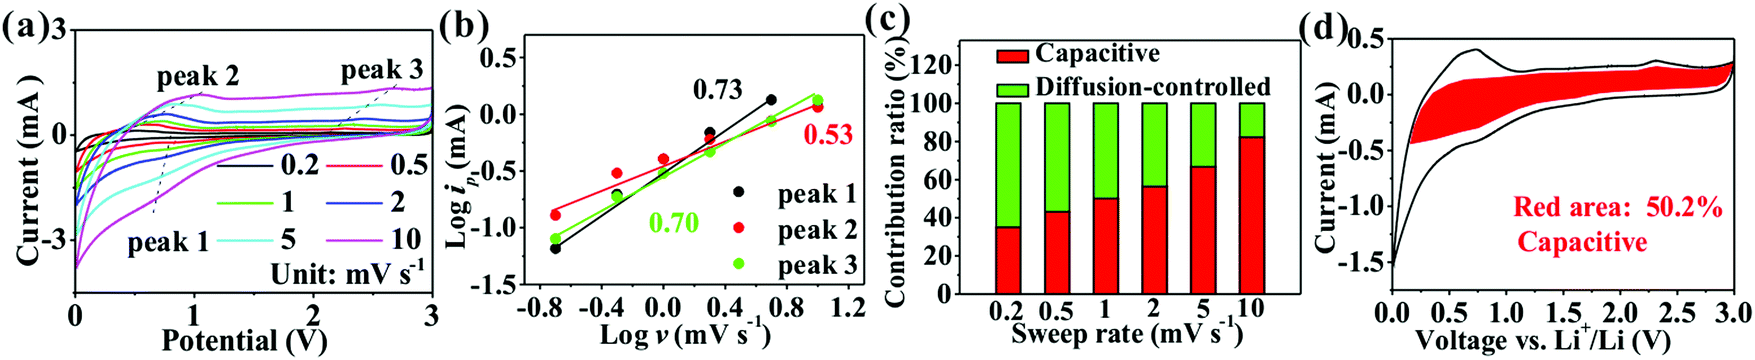 | ||
| Fig. 6 (a) CV curves at different scanning rates; (b) the line relationship of log(i) vs. log(v) at peaks 1–3 marked in (a); (c) the percentages of the pseudocapacitive contribution at different scanning rates; and (d) the detailed pseudocapacitive contribution at a scanning rate of 1 mV s−1 of SnO2@TiO2/C. | ||
The practicality of the SnO2@TiO2/C anode was confirmed by testing the delivery capacity of a full cell assembled with a prelithiated SnO2@TiO2/C anode and LiCoO2 cathode. The full cell exhibits a high capacity of 142.2 mA h g−1, a capacity retention of 93.3% after 100 cycles at 0.1C (Fig. 7a and b) and a superior rate performance with a capacity of 110.7 mA h g−1 at 1C (Fig. 7c and d), which are higher than the values of the reported full cells of graphite/LiCoO2 and graphite/LiFePO4.33–35 The gravimetric energy density of the full cell can be calculated by the following eqn (3):36
 | (3) |
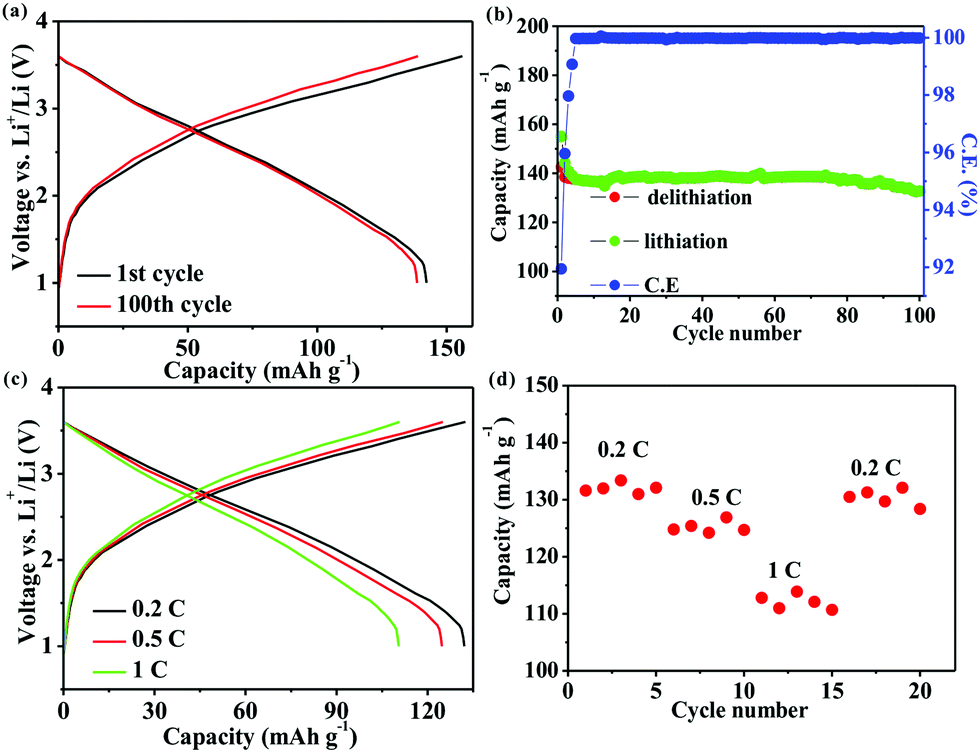 | ||
| Fig. 7 (a) The charge/discharge curves at 0.1C; (b) the cycling performance at 0.1C; (c) the charge/discharge curves at different current densities; and (d) the rate performance of full cells. The capacity is calculated based on the mass of LiCoO2. | ||
The high stability of the electrode structure was verified by SEM and TEM analysis of the electrode after 2000 cycles at 10C. In the SEM images, the electrode surface is observed to be intact (Fig. S5a and b, ESI†), without any cracks in the nanoparticles (Fig. S5c and d, ESI†). These results confirm the high structural stability of SnO2/TiO2/C nanocomposites during cycling, which is ascribed to the unique nanoarchitecture of SnO2@TiO2/C (Fig. 8). Specifically, the carbon coating on the surface of TiO2 and SnO2 nanocrystals can greatly suppress the structural volume change, enhance the electrical conductivity, and inhibit the aggregation of nanocrystals, thus improving the cyclability and rate performance.42,43 Additionally, the formation of Ti–O–C and Sn–O–C bonds in the interfaces can promote interfacial charge transfer and enhance the structural stability of SnO2@TiO2/C, thus contributing to fast lithium ion transport and long cycling life.15 Furthermore, the phase boundaries and mesoporous structure can afford the storage of additional Li+ and thus achieve a high capacity.42,43 Finally, the ultrasmall nanocrystals can supply enormous active storage sites and shorten the Li+ diffusion distance, thus facilitating high capacity and enhancing the rate capability.42,43
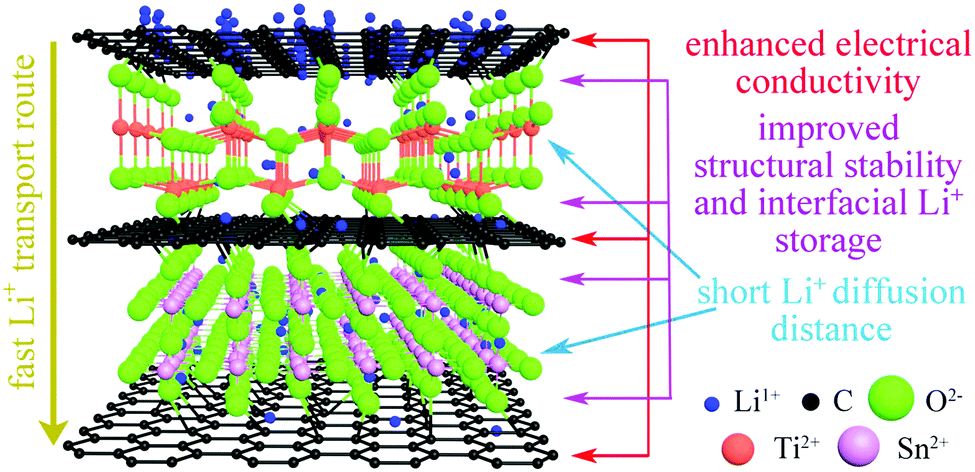 | ||
| Fig. 8 A schematic illustration of the lithium ion storage mechanism in the SnO2@TiO2/C nanoarchitecture. | ||
Conclusion
In this research, we propose a one-step pressure-induced vapor phase method for fabricating a chemically bonded SnO2@TiO2/C nanocomposite with a highly mesoporous structure as well as SnO2 and TiO2 nanocrystals of a size of about 10 nm. The fine multi-component nanocrystals are shown to induce a large amount of phase boundaries, defects, interfacial chemical bonds, and mesoporous structures, endowing the SnO2@TiO2/C nanocomposite with a high reversible capacity of 830.7 mA h g−1 after 100 cycles at 0.5C, 438.5 mA h g−1 after 1000 cycles at 10C, and 217.7 mA h g−1 at 50C in the half cell. In the full cell, a high energy density of 328.4 and 245.9 W h kg−1 is achieved at 0.1 and 1C, respectively. These lithium ion storage performances are superior to those of previously reported TiO2-based anodes.Conflicts of interest
There are no conflicts of interest to declare.Acknowledgements
The work was provided technical support by “Ceshigo Research Service agency for TEM, http://www.ceshigo.com”.References
- S. Cao, Z. Xue, C. Yang, J. Qin, L. Zhang, P. Yu, S. Wang, Y. Zhao, X. Zhang and R. Liu, Nano Energy, 2018, 50, 25–34 CrossRef CAS.
- S. Wang, Y. Yang, W. Quan, Y. Hong, Z. Zhang, Z. Tang and J. Li, Nano Energy, 2017, 32, 294–301 CrossRef CAS.
- K. J. Hong and S. O. Kim, Energy Storage Mater., 2016, 2, 27–34 CrossRef.
- M. Zhang, K. Yin, Z. D. Hood, Z. Bi, C. A. Bridges, S. Dai, Y. S. Meng, M. P. Paranthaman and M. Chi, J. Mater. Chem. A, 2017, 5, 20651–20657 RSC.
- F. Shahvaranfard, M. Altomare, Y. Hou, S. Hejazi, W. Meng, B. Osuagwu, N. Li, C. J. Brabec and P. Schmuki, Adv. Funct. Mater., 2020, 1909738 CrossRef CAS.
- C. Gao, T. Wei, Y. Zhang, X. Song, Y. Huan, H. Liu, M. Zhao, J. Yu and X. Chen, Adv. Mater., 2019, 31, 1806596 CrossRef PubMed.
- S. Liu, Z. Wang, C. Yu, H. B. Wu, G. Wang, Q. Dong, J. Qiu, A. Eychmüller and X. W. (David) Lou, Adv. Mater., 2013, 25, 3462–3467 CrossRef CAS PubMed.
- Y. Ren, Z. Liu, F. Pourpoint, A. R. Armstrong, C. P. Grey and P. G. Bruce, Angew. Chem., Int. Ed., 2012, 51, 2164–2167 CrossRef CAS PubMed.
- S. Tian, A. Xing, H. Tang, Z. H. Bao and G. M. Wu, J. Mater. Chem. A, 2014, 2, 2896–2900 RSC.
- R. Mo, Z. Lei, K. Sun and D. Rooney, Adv. Mater., 2014, 26, 2084–2088 CrossRef CAS PubMed.
- Q. Wu, J. Xu, X. Yang, F. Lu, S. He, J. Yang, H. Fan and M. Wu, Adv. Energy Mater., 2015, 5, 1401756 CrossRef.
- S. Huang, L. Zhang, X. Lu, L. Liu, L. Liu, X. Sun, Y. Yin, S. Oswald, Z. Zou, F. Ding and O. G. Schmidt, ACS Nano, 2017, 11, 821–830 CrossRef CAS PubMed.
- Y. Xing, S. Wang, B. Fang, G. Song, D. P. Wilkinson and S. Zhang, J. Power Sources, 2018, 385, 10–17 CrossRef CAS.
- C. Chen, Y. Yang, S. Ding, Z. Wei, X. Tang, P. Li, T. Wang, G. Cao and M. Zhang, Energy Storage Mater., 2018, 13, 215–222 CrossRef.
- M. Han, Z. Lin and J. Yu, J. Mater. Chem. A, 2019, 7, 4804–4812 RSC.
- Q. Wu, J. Xu, X. Yang, F. Lu, S. He, J. Yang, H. Fan and M. Wu, Adv. Energy Mater., 2014, 5, 1401756 CrossRef.
- A. Magasinski, P. Dixon, B. Hertzberg, A. Kvit, J. Ayala and G. Yushin, Nat. Mater., 2010, 9, 353–358 CrossRef CAS PubMed.
- J. Qiu, C. Lai, Y. Wang, S. Li and S. Zhang, Chem. Eng. J., 2014, 256, 247–254 CrossRef CAS.
- A. Mondal, S. Maiti, K. Singha, S. Mahanty and A. B. Panda, J. Mater. Chem. A, 2017, 5, 23853–23862 RSC.
- M. Han and J. Yu, Diamond Relat. Mater., 2018, 87, 10–17 CrossRef CAS.
- M. Han and J. Yu, Energy Technol., 2019, 7, 1900084 CrossRef.
- X. Tian, X. Li, T. Yang, K. Wang, H. Wang, Y. Song, Z. Liu, Q. Guo and C. Chen, Electrochim. Acta, 2017, 247, 1060–1071 CrossRef CAS.
- Y. Zhou, R. Ma, S. L. Candelaria, J. Wang, Q. Liu, E. Uchaker, P. Li, Y. Chen and G. Cao, J. Power Sources, 2016, 314, 39–48 CrossRef CAS.
- Q. Guo, Z. Zheng, H. Gao, J. Ma and X. Qin, J. Power Sources, 2013, 240, 149–154 CrossRef CAS.
- S. Kang, X. Chen and J. Niu, Nano Lett., 2018, 18, 467–474 CrossRef CAS PubMed.
- H.-K. Roh, M.-S. Kim, K. Y. Chung, M. Ulaganathan, V. Aravindan, S. Madhavi, K. C. Roh and K.-B. Kim, J. Mater. Chem. A, 2017, 5, 17506–17516 RSC.
- S. Sakthivel and H. Kisch, Angew. Chem., Int. Ed., 2003, 42, 4908–4911 CrossRef CAS PubMed.
- R. Tian, Y. Zhang, Z. Chen, H. Duan, B. Xu, Y. Guo, H. Kang, H. Li and H. Liu, Sci. Rep., 2016, 6, 19195 CrossRef CAS PubMed.
- D. Li, S. Dai, J. Li, C. Zhang, M. Richard-Plouet, A. Goullet and A. Granier, J. Electron. Mater., 2018, 47, 7372–7379 CrossRef CAS.
- L. Sun, H. Si, Y. Zhang, Y. Shi, K. Wang, J. Liu and Y. Zhang, J. Power Sources, 2019, 415, 126–135 CrossRef CAS.
- S. Kang, X. Chen and J. Niu, Nano Lett., 2017, 18, 467–474 CrossRef PubMed.
- X. Zhuang, P. Song, G. Chen, L. Shi, Y. Wu, X. Tao, H. Liu and D. Zhang, ACS Appl. Mater. Interfaces, 2017, 9, 28464–28472 CrossRef CAS PubMed.
- Y. S. Jung, P. Lu, A. S. Cavanagh, C. Ban, G.-H. Kim, S. H. Lee, S. M. George, S. J. Harris and A. C. Dillon, Adv. Energy Mater., 2013, 3, 213–219 CrossRef CAS.
- N.-S. Choi, Y. Lee, S.-S. Kim, S.-C. Shin and Y.-M. Kang, J. Power Sources, 2010, 195, 2368–2371 CrossRef CAS.
- J. Chong, S. Xun, H. Zheng, X. Song, G. Liu, P. Ridgway, J. Wang and V. S. Battaglia, J. Power Sources, 2011, 196, 7707–7714 CrossRef CAS.
- H. J. Kwon, J.-Y. Hwang, H.-J. Shin, M.-G. Jeong, K. Y. Chung, Y.-K. Sun and H.-G. Jung, Nano Lett., 2020, 20, 625–635 CrossRef CAS PubMed.
- H. J. Kim, S. Choi, S. J. Lee, M. W. Seo, J. G. Lee, E. Deniz, J. L. Yong, E. K. Kim and W. Choi, Nano Lett., 2016, 16, 282–288 CrossRef CAS PubMed.
- S. Chen, L. Shen, P. A. van Aken, J. Maier and Y. Yu, Adv. Mater., 2017, 29, 1605650 CrossRef PubMed.
- W. He, Y. Liang, H. Tian, S. Zhang, Z. Meng and W. Q. Han, Energy Storage Mater., 2017, 8, 119–126 CrossRef.
- H. Xiong, H. Yildirim, E. V. Shevchenko, V. B. Prakapenka, B. Koo, M. D. Slater, M. Balasubramanian, S. K. R. S. Sankaranarayanan, J. P. Greeley, S. Tepavcevic, N. M. Dimitrijevic, P. Podsiadlo and C. S. Johnson, J. Phys. Chem. C, 2012, 116, 3181–3187 CrossRef CAS.
- N. Plylahan, M. Letiche, M. K. S. Barr, B. Ellis, S. Maria, T. N. T. Phan, E. Bloch, P. Knauth and T. Djenizian, J. Power Sources, 2015, 273, 1182–1188 CrossRef CAS.
- M. Han, Y. Mu, F. Yuan, J. Liang, T. Jiang, X. Bai and J. Yu, J. Mater. Chem. A, 2020, 8, 3822–3833 RSC.
- M. Han and J. Yu, J. Power Sources, 2019, 414, 435–443 CrossRef CAS.
Footnote |
| † Electronic supplementary information (ESI) available. See DOI: 10.1039/d0ma00140f |
| This journal is © The Royal Society of Chemistry 2020 |