 Open Access Article
Differential antimicrobial and cellular response of electrolytically metalized halloysite nanotubes having different amounts of surface metallization
Ahmed
Humayun
a,
Yangyang
Luo
a,
Anusha
Elumalai
ab and
David K.
Mills
 *ab
*ab
aSchool of Biological Sciences and the Center for Biomedical Engineering and Rehabilitation Science, Louisiana Tech University, Carson Taylor Hall, Room 128, Ruston, LA 71272, USA. E-mail: dkmills@latech.edu; Fax: +1-318-257-4574; Tel: +1-318-257-2640
bSchool of Biological Sciences, Louisiana Tech University, Ruston, LA 71272, USA
First published on 15th July 2020
Abstract
We demonstrate an electrolytic method to metalize the outer surface of halloysite nanotubes (HNTs). Different metal HNT (mHNT) combinations (copper, silver, zinc) were produced with metal content in the 5–30 wt% range. mHNTs were characterized using a Scanning Electron Microscope (SEM), energy-dispersive spectroscopy (EDS), X-ray fluorescence (XRF), Fourier-transform infrared spectroscopy (FTIR) and X-ray powder diffraction (XRD). Different amounts of surface/lumen metal content of a system can confer differing antimicrobial/cellular response; hence, it is essential to assess the antimicrobial/cellular response as a function of metal content. Cellular response after exposure to mHNTs was studied in Staphylococcus aureus and pre-osteoblasts, respectively. Coated mHNTs could easily be identified using the characterization methods, and contrasting bacterial and cellular responses were obtained, which we propose was due to the extent of metallization. These findings demonstrate the potential of this method for creating metal-coated HNTs and suggest they have potential as an implant coating solution.
1. Introduction
Due to increased incidences of microbial infections and rising microbial resistance to antibiotics, innovative antimicrobial agents are the need of the present age.1–3 Metal nanoparticles (NPs) exhibit significant antimicrobial activity by themselves4–6 as well as a synergistic activity when combined with other antimicrobial agents,7,8 however, their utility is restricted due to their inherent instability leading to agglomeration and thus a reduction in potency. Furthermore, at high concentrations their cytotoxic effects outstrip the antimicrobial potential.9Metals NPs and oxides inhibit bacterial growth by inducing oxidative stress and the production of reactive oxygen species.10 Metal NPs, including silver, zinc, and copper NPs are used commercially due to low cost, abundance, and relatively less toxicity; however, owing to extremely high surface energy, they agglomerate into larger particles, thereby diminishing the desired effects.11 This situation can be resolved by using surfactant materials such as polyvinylpyrrolidone, polyethylene glycol, and sodium citrate, however, this has proven to be a temporary band-aid fix at best due to associated high costs, intricate pre and post-processing steps and possible eco-toxicity.12 HNTs can be a viable solution to this problem as they can adsorb metal NPs, thus reduce their agglomeration13 and potentiate a more sustained metal NPs release in a system by desorption, and therefore increase the likelihood of achieving more pragmatic utilities and results. Previous investigations confirm that metal NPs, when adsorbed on HNTs, retain their antimicrobial properties.9,14,15
Halloysite nanotubes (HNTs), are a dioctahedral 1![[thin space (1/6-em)]](https://www.rsc.org/images/entities/char_2009.gif) :
:![[thin space (1/6-em)]](https://www.rsc.org/images/entities/char_2009.gif) 1 nano clay made of rolled-up layers of aluminosilicate sheets, it is 500–1000 nm long, 50 nm diameter with 15–50 nm lumen, it occurs throughout the world and is biocompatible,16 further, it is of significant interest due its high adsorption capacity,17 unique surfaces, and lumen charge polarity chemistry, non-toxic nature,18 wide distribution, and low cost.19 It has been incorporated in corrosion-resistant coatings20,21 and fire-retardant materials.22,23 Due to its charged hollow lumen it is used as a container for various chemicals including drugs,16,24–26 dyes,27,28 and metals,30 in recent years it has generated interest as an adsorbent surface for various antimicrobial,29 catalytic,31,32 and heavy metal remediation,33 as a filler for structural modification in bone cements,34–36 dental fillings,37 and polymer additive.38–40
1 nano clay made of rolled-up layers of aluminosilicate sheets, it is 500–1000 nm long, 50 nm diameter with 15–50 nm lumen, it occurs throughout the world and is biocompatible,16 further, it is of significant interest due its high adsorption capacity,17 unique surfaces, and lumen charge polarity chemistry, non-toxic nature,18 wide distribution, and low cost.19 It has been incorporated in corrosion-resistant coatings20,21 and fire-retardant materials.22,23 Due to its charged hollow lumen it is used as a container for various chemicals including drugs,16,24–26 dyes,27,28 and metals,30 in recent years it has generated interest as an adsorbent surface for various antimicrobial,29 catalytic,31,32 and heavy metal remediation,33 as a filler for structural modification in bone cements,34–36 dental fillings,37 and polymer additive.38–40
The deposition of metal NPs on HNTs is a straightforward process because of their inherent adsorbent ability, which can be further enhanced using chemical modifications. In this study, we employed a modified electrolytic method for metalizing HNTs based on a process previously described by Mills et al.41 We used several electrolytic parameters to regulate the behavior of metal nanoparticles in the electrolytic system in order to influence metal NPs density, interacting, with the HNTs. NP adsorption onto the HNT surface would also be directly affected. As different amounts of metal content in a structure can confer contrasting antimicrobial/cellular responses, it is also essential to assess the antimicrobial and cellular response as a function of metal content.
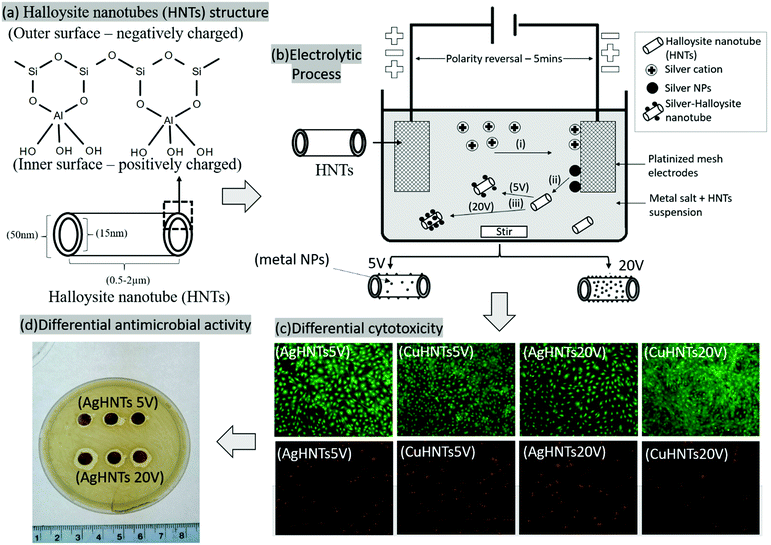
In this study, we demonstrate an electrolytic synthesis of reduced metal species, their subsequent adsorption on HNTs' outer surface, and study its contrasting antimicrobial and cellular response in Staphylococcus aureus and preosteoblast cell, respectively as a function of the nature and quantity of metal deposition on HNTs external surface. Different mHNTs (m = silver, copper, or zinc) were synthesized electrolytically having metal content within 5–30 wt% range at two different voltages 5 and 20 V respectively and characterized using SEM, energy-dispersive spectroscopy (EDS), X-ray fluorescence (XRF), Fourier-transform infrared spectroscopy (FTIR), UV-Visible spectroscopy, and X-ray powder diffraction (XRD).
2. Materials and methods
2.1 Materials
Staphylococcus aureus (S. aureus) ATCC® 6538™ 50 CFU, AgNO3, CuSO4, ZnSO4·7H2O (99.9% pure), HNTs, ethanol, acetone, propanol, methanol, live–dead kit, Mueller Hinton broth, and agar were purchased from Sigma-Aldrich (St Louis, MO). Resazurin dye was obtained from Cayman Chemicals (Ann Arbor, MI), DC power source (VWR Accupower 500 electrophoresis power supply), platinum mesh electrodes, plastic Petri dishes, and ammeter (TekPower TP9605BT) were purchased from Amazon.com LLC (Seattle, WA). Resazurin dye from Cayman Chemicals (Ann Arbor, MI), Live/Dead® viability/cytotoxicity kit and cryomedium from Thermo Fisher Scientific (Waltham, MA).2.2 Electrolytic metallization of HNTs
mHNTs were prepared using a modified protocol based on an electrolytic metallization procedure previously described by Mills et al.1 Briefly, an electrolysis setup was assembled consisting of two platinized titanium mesh held parallel at 2 in distance and connected to a DC power source (VWR Accupower 500) (Fig. 1). Ultrasonicated 100 mL aqueous solution of metal salts (2.5 mM) and 50 mg HNT were dispersed in a glass beaker, and voltages of 5 and 20 V respectively were maintained at 80 °C with polarity reversal every 5 min intervals2 with constant magnetic stirring to reduce electrophoretic buildup at the working electrode and thus increase reduced species density in the solution. Then, the supernatant was decanted three times and the solution was centrifuged at 5000 rpm for 5 min with water to separate out mHNTs from un-adsorbed metal particles and dried at 30 °C.2.3 Characterization
Hitachi S-4800 field-emission SEM (Tokyo, Japan) was used to examine the surface morphology of the coated HNTs and to visually confirm the presence of the metal coating appearing as clusters on the otherwise smooth HNT outer surface. SEM-EDS were carried out with an EDAX energy dispersive X-ray analyzer linked to the HITACHI S-4800 SEM to evaluate the elemental composition and weight percentage (wt%) deposition on the AgHNTs. EDS was operated at a working distance of 15 mm and an acceleration voltage of 15 kV; EDS spectra were analyzed using the EDAX Genesis software.X-ray crystal diffraction analysis was recorded on a Bruker D8 Venture diffractometer (Bruker, Karlsruhe, Germany) with Cu Kα1 radiation (λ![[thin space (1/6-em)]](https://www.rsc.org/images/entities/char_2009.gif) =
= ![[thin space (1/6-em)]](https://www.rsc.org/images/entities/char_2009.gif) 1.5418
1.5418![[thin space (1/6-em)]](https://www.rsc.org/images/entities/char_2009.gif) Å). The scan speed and step size used were 2 s and 0.02° respectively, the diffraction patterns were recorded on a Philips PW 1710 X-ray powder diffractometer over 2θ within 3° to 85°.
Å). The scan speed and step size used were 2 s and 0.02° respectively, the diffraction patterns were recorded on a Philips PW 1710 X-ray powder diffractometer over 2θ within 3° to 85°.
The samples were analyzed using a Thermo/ARLQuant’X energy dispersive X-ray fluorescence spectrometer. The X-ray tube was operated at 30 kV for 60 live seconds, using a 0.05 mm (thick) Cu primary beam filter in an air path for silver metal detection. The XRF spectra were studied using Wintrace 7.1™ software (Thermo Fisher Scientific, Waltham, MA).
The infrared spectrum was recorded at a resolution of 4 s−1 with 16 scans using a Thermo Scientific NICOLET™ IR100 FT-IR Spectrometer (Thermo Fisher Scientific; Waltham, MA). Thermo Scientific OMNIC™ software was used to study the stretching bands.
UV spectra of the silver nanoparticles were recorded using the NanoDrop-2000c spectrophotometer (Thermo Fisher Scientific, Waltham, MA) set at a 250–600 nm scan range. Microplate absorbances were analyzed using Biotek 800TS microplate reader (Winooski, VT) set at 630 nm absorbance.
mHNTs discs for antimicrobial assay were prepared. Here, 6 mm discs were punched from Whatman # three filter paper, and 1 mg of mHNTs in 2 mL ethanol was gradually infused using an automatic pipette, the discs were dried in an incubator at 37 °C3 and plated on Mueller-Hinton agar plates spread plated with 20 μL of 0.5 McFarland S. aureus and incubated at 37 °C overnight in an incubator.
A resazurin assay was used for qualitative minimum inhibitory concentration determination, where, 0.25 mg of mHNTs were serially diluted in 100 μL of Mueller Hinton broth and inoculated with 10 μL of 1 × 10⁵ CFU mL−1 of S. aureus Gram-positive bacteria and incubated in wells of a 96 well plate at 30 °C for 6 h after which 20 μL of 0.0015 wt/v% resazurin aqueous solution was added to each well. Live bacteria cells reduce the blue non-fluorescent resazurin to pink fluorescent resorufin, thus providing a direct analysis of the bacterial metabolic activity.4
For each experiment (n = 3), passage four pre-osteoblasts were thawed and resuspended in complete medium, prepared as described above, and used when they achieved sub-confluency. Cytotoxicity tests and cell proliferation tests were performed by pre-seeding cells in 48-well plates at a concentration of 1 × 10⁵ cells per well and cultured for 24 hours. Cells were then rinsed with HBSS and incubated in complete medium with mHNTs at 20 μg mL−1 for a 24 h duration. Pre-osteoblast cultures without exposure to mHNT were used as control.
For viability studies, the staining solution was prepared by mixing 5 μL of 4 mM Calcein AM Solution and 20 μL of 2 mM EthD-III Solution to 10 mL of DPBS. Cell culture plates were washed twice with HBSS, and then 50 μL of staining solution was added to each well plate. These substrates were then incubated at room temperature for 30 min. Each cytotoxicity experiment was repeated three times. Images were captured using an Olympus BX51 fluorescence microscope (Olympus Corporation, Tokyo, Japan) equipped with an Olympus DP11 digital camera system. ImageJ5 was used for counting fluorescent cells from thresholded 8bit images at a cell size limit of 50–200 pixel2.
![[thin space (1/6-em)]](https://www.rsc.org/images/entities/char_2009.gif) <
< ![[thin space (1/6-em)]](https://www.rsc.org/images/entities/char_2009.gif) 0.05), and all the results were reported as mean ± standard deviation (p
0.05), and all the results were reported as mean ± standard deviation (p![[thin space (1/6-em)]](https://www.rsc.org/images/entities/char_2009.gif) <
< ![[thin space (1/6-em)]](https://www.rsc.org/images/entities/char_2009.gif) 0.05, n = 3) unless otherwise specified.
0.05, n = 3) unless otherwise specified.
3. Results and discussion
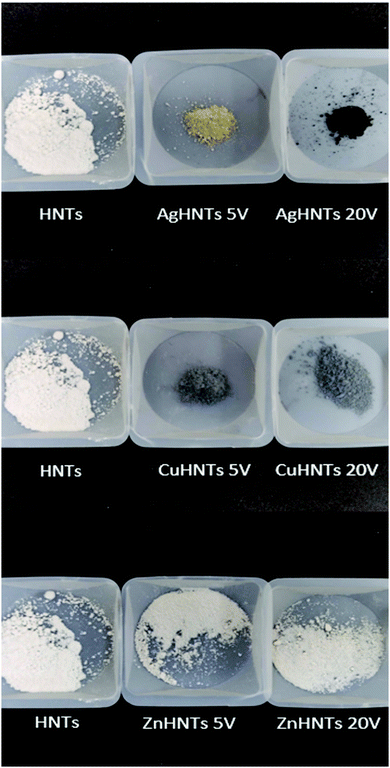
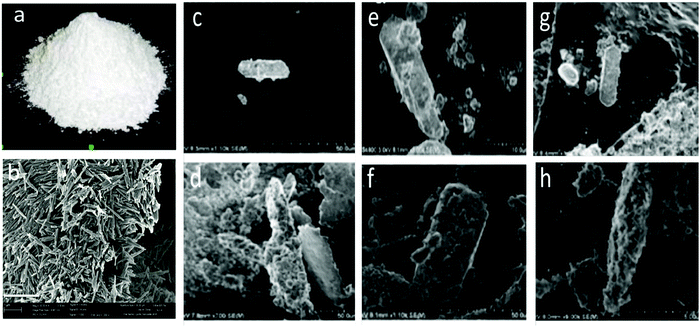
mHNTs with varying metal content were synthesized by application of 5 and 20 V, which could easily be distinguished by visual analysis of the obtained samples, which turned darker with an increasing metal content as shown in Fig. 2.SEM-EDS analysis revealed a positive correlation between applied voltage and metal content (wt%) in mHNTs, which can be observed in terms of increased surface deposition on an otherwise smooth HNT, which increased with the applied voltage, brief patches of HNT surface were visible at 5 V however at 20 V the surface of mHNT was covered with irregular patches (Fig. 3).
These findings were confirmed using XRF, where an increasing amount of metal content was observed as a function of voltage increment (Fig. 4). A similar trend was observed in the XRD spectra, where increasing respective metal peak intensities were observed with increased metal content. In general, higher applied voltage samples displayed stronger corresponding metal and subdued halloysite peaks, respectively, whereas low voltage samples exhibited the contrary, i.e., stronger halloysite and weaker metal peaks respectively (Fig. 5a–c). In another study constructed Ag–ZnO–HNTs, where different amounts of ZnO metallization was achieved by using varying amounts of zinc precursor salts for reduction and similar gradation in the XRD, were obtained,6 similar results were obtained when HNTs were mixed with varying amounts of titanium dioxide.7
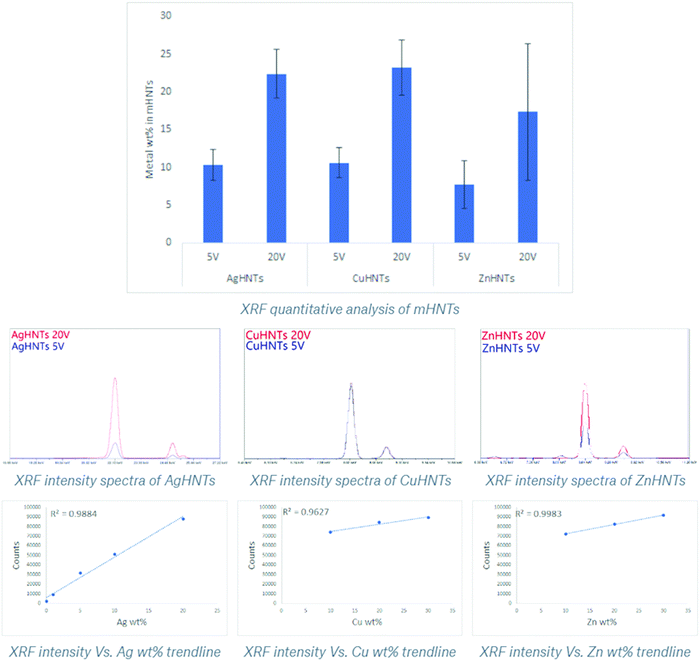 | ||
Fig. 4 XRF quantitative analysis of Ag, Cu, and ZnHNTs, respectively. Adsorbed metal content in mHNTs increased with applied voltage (5 and 20 V). (error bar indicates standard deviation p < ![[thin space (1/6-em)]](https://www.rsc.org/images/entities/char_2009.gif) 0.05). 0.05). | ||
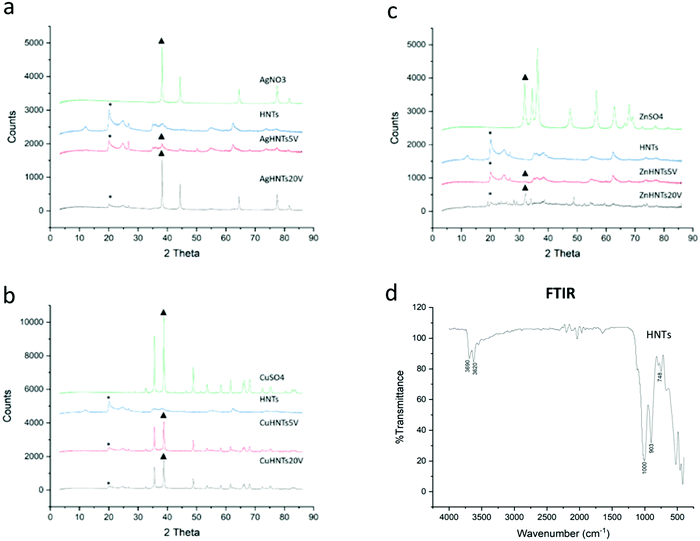 | ||
| Fig. 5 XRD spectra of AgHNTs (a), CuHNTs (b), and ZnHNTs (c). (d) FTIR pattern of as received HNTs displaying the characteristic FTIR pattern. | ||
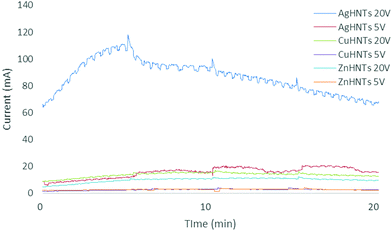
FTIR analysis of HNTs showed the inner and outer layer Al–OH stretching at 3690 and 3620 cm−1, in-plane Si–O–Si stretching at 1000 cm−1 and 1091 cm−1 and, symmetric Si–O–Si stretching at 748 cm−1 (Fig. 5d). Amperage was recorded, and higher currents were detected for higher voltages (Fig. 6), which can be explained as being due to a higher ionization of metal salt electrolytes leading to increased ionic density in the solution resulting in an increased population of metal nanoparticles interacting with HNTs surface leading to corresponding increased metal wt% in mHNTs with increased applied voltage. Previous studies have shown a reduction in the mean particle size of silver with an increase in current density.8,9
A similar trend was observed with UV analysis, an increase in NPs concentration for silver, copper, and zinc NPs, respectively, with an increasing voltage at 420, 228, and 360 nm, respectively (Fig. 7). Nanoparticles due to a collective oscillation of the conduction electrons exhibit absorption of visible electromagnetic waves, this is referred to as the surface plasmon resonance effect, this phenomenon is of particular interest because it enables the possibility of metal NPs detection and size analysis using UV-vis spectroscopy.10
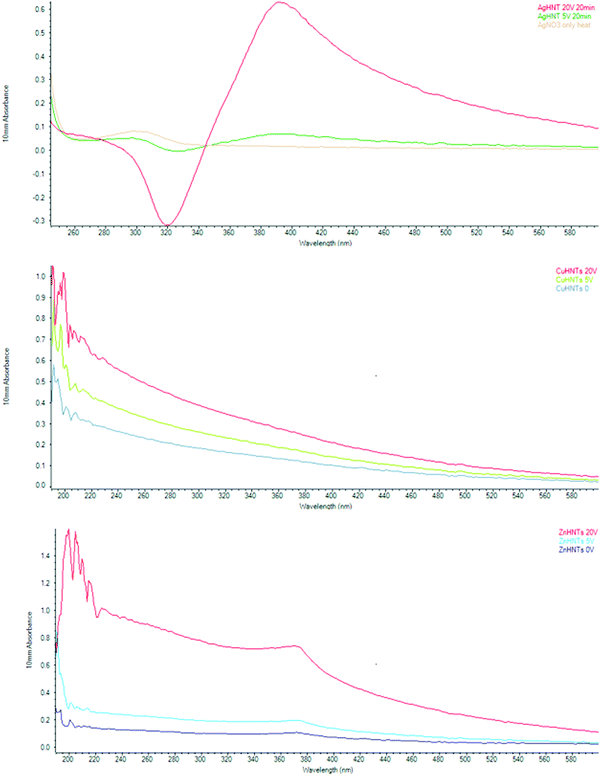 | ||
| Fig. 7 UV-Vis spectra of mHNTs (m = Ag, Zn, or Cu, respectively). Peaks were observed for Ag, Cu, and Zn at 420, 228, and 360 nm respectively. | ||
Previous studies have shown that silver NPs size can be controlled electrochemically,8 and antimicrobial action is strongly size dependent,11 and a strong correlation between silver NPs and UV-visible absorbance exists.12 Similarly, Zn NPs have been reported to display a strong absorption peak at 360 nm.13–15 Similarly, Cu NPs can also be detected and are size quantifiable using UV-Vis spectroscopy.16
mHNTs were evaluated for antimicrobial effect on S. aureus using the resazurin dye assay, a positive correlation was observed between observed minimum inhibitory concentration (MIC, at least 3 out of a total of 4 wells are dark blue in appearance, n = 4) and metal content of mHNTs. MICs for AgHNTs (0.25 and 0.125 mg mL−1 respectively), CuHNTs (none and 0.25 mg mL−1 respectively), and ZnHNTs (0.125 and 0.25 mg mL−1 respectively) at 5 and 20 V respectively were observed (Fig. 8).
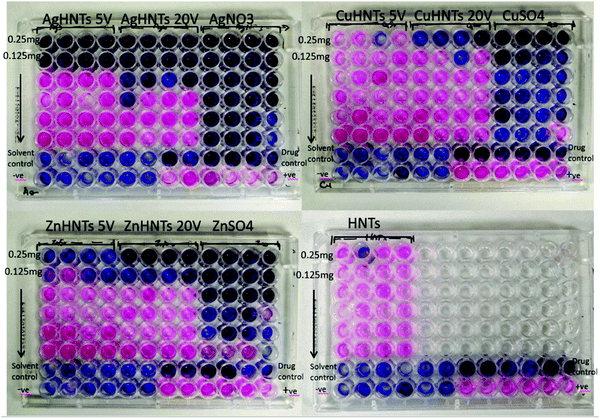 | ||
| Fig. 8 Determination of MIC for mHNTs against S. aureus using resazurin assay. Purple well corresponds to dead, whereas partially purple/pink, and pink wells correspond to live bacteria, (n = 4). | ||
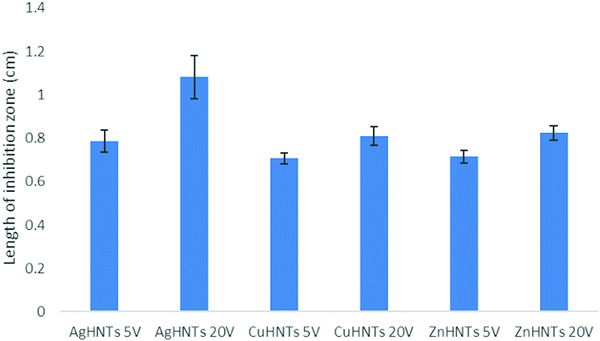
A disc diffusion assay was performed using agar plating (Fig. 9) mHNTs 20 V had greater average zones of inhibitions than mHNTs at 5 V due to their higher metal content (Fig. 10).
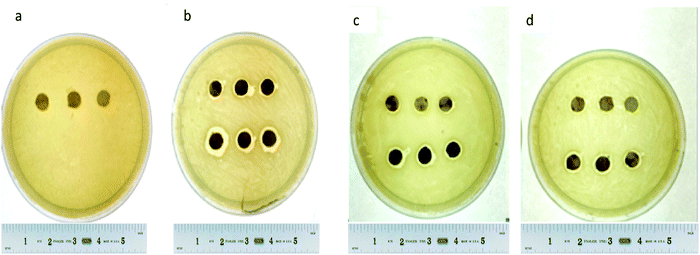 | ||
| Fig. 9 Disc diffusion assay of (a) HNTs, (b) AgHNTs, (c) CuHNTs, (d) ZnHNTs, (5 V – top, 20 V – bottom. | ||
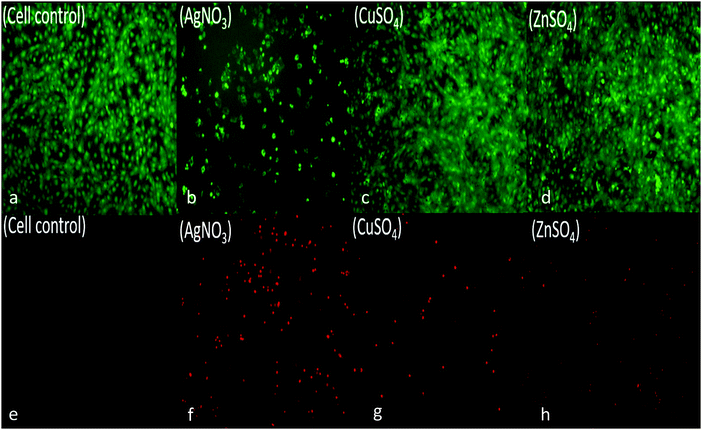
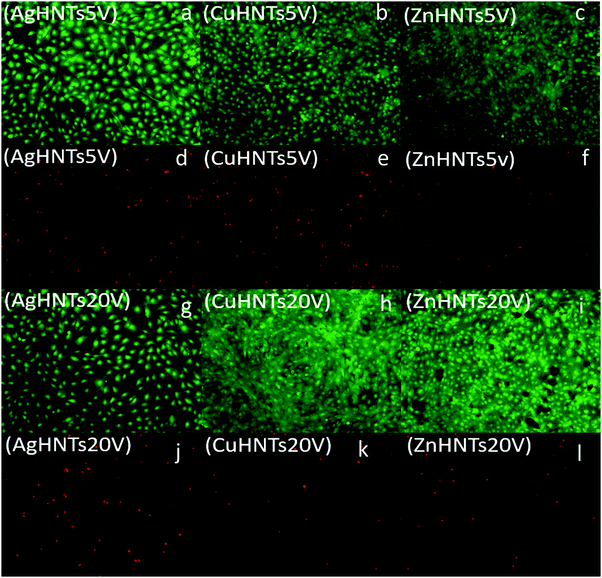
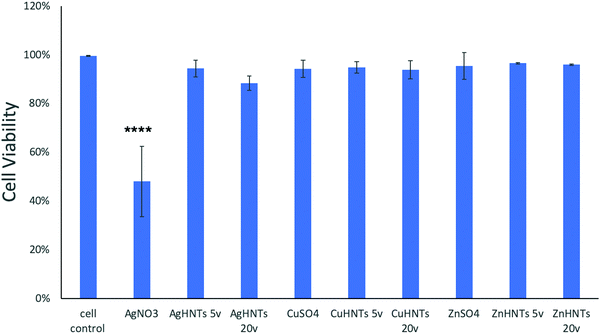
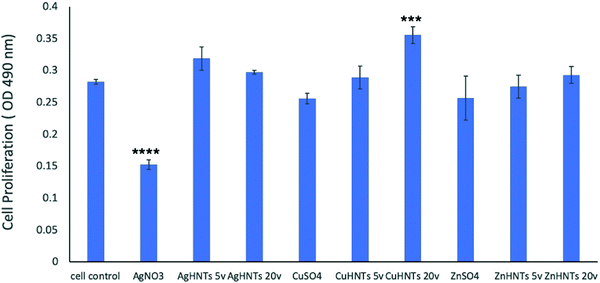
To assess for any potential cytotoxicity issues, pre-osteoblasts were co-cultured with free metal particles and cell viability significantly decreased in the presence of AgNO3 (Fig. 11 and 13). Ag NPs have been reported to be cytotoxic and genotoxic,17 size-dependent toxicity has also been reported.18 One study also reported that Ag NPs damage the eukaryotic DNA by affecting the ATP content.19 In the process of electrolytic metallization on HNTs, higher metal accumulation was observed in the 20 voltage treatment with reduced silver content at 5 volts (Fig. 3). Therefore, AgHNTs (20 V) contain more Ag NPs than AgHNTs (5 V). Due to the cytotoxicity of Ag NPs, an increased amount of AgNPs results in decreased cell viability (Fig. 12, AgHNTs (20 V) vs. AgHNTs (5 V)). CuHNTs and ZnHNTs exhibited insignificant contrast for both voltages in terms of cell viability; however, displayed there was a significant difference in cellular proliferation tests.
In contrast, Zn and Cu NPs have been demonstrated in several studies to be cell supportive. One study reported that low concentration exposure of copper NPs led to increased cellular proliferation in rat cerebral endothelial cells, whereas toxicity was observed at higher concentrations.20 Another study reported the angiogenesis promoting the ability of copper NPs.21 ZnO NPs have remarkably been shown to have exhibited selective cytotoxicity to cancer cells and none towards normal cells;22 another study reported minimal cytotoxicity to human T cells at levels toxic to prokaryotes.23 A similar trend was observed in our cell proliferation studies (Fig. 14).
The results of these studies are consistent with our hypothesis, the nature and the quantity of a specific metal deposited on the HNT surface has an influence over the antimicrobial response and cytotoxicity of mHNTs.
4. Conclusion
Several methods exist for metalizing HNTs; however, they are limited in scope as the extent of HNT metallization cannot be controlled, which, as demonstrated above, is a vital parameter in surface metallization. We demonstrated the electrolytic synthesis of metal-coated HNTs (mHNTs) with varying degrees of surface metallization that displayed contrasting antimicrobial and cellular response from Staphylococcus aureus and pre-osteoblasts, respectively. Metalizing the HNT's exterior surface and the quantity of metal decoration as a function of the applied voltage was achieved. We anticipate that future developments leading to the deposition of more than two metals will open up potentially novel biomedical applications when combined with halloysite's proven ability to release a range of drugs over a sustained period.Author contributions
The authors all contributed to the writing of the manuscript. A. H., Y. L., and A. E. conducted the experiments under the direction of D. K. M. All authors reviewed and analyzed the data.Conflicts of interest
The authors declare no conflict of interest.Acknowledgements
Mr Davis Bailey and Dr Sven Eklund for training. Funding for this study was provided by a grant (to Dr Mills) from the Louisiana Biomedical Research Network (through an Institutional Development Award (IDeA) from the National Institute of General Medical Sciences of the National Institutes of Health under grant number P20 GM103424-17 and Center for Dental, Oral & Craniofacial Tissue & Organ Regeneration (C-DOCTOR) with the support of NIH NIDCR (U24DE026914). The authors also wish to acknowledge the support of the College of Applied and Natural Sciences (Louisiana Tech University) Matching Grant Program (DKM) and the China Scholarship Council (YL).References
- D. Mills and C. Boyer, US Pat. 9981074B1, 2018 Search PubMed.
- R. A. Khaydarov, R. R. Khaydarov, O. Gapurova, Y. Estrin and T. Scheper, J. Nanopart. Res., 2009, 11, 1193–1200 CrossRef CAS.
- J. Kramer and A. Kirshbaum, Appl. Environ. Microbiol., 1961, 9, 334–336 CrossRef CAS.
- M. Elshikh, S. Ahmed, S. Funston, P. Dunlop, M. McGaw, R. Marchant and I. M. Banat, Biotechnol. Lett., 2016, 38, 1015–1019 CrossRef CAS.
- C. A. Schneider, W. S. Rasband and K. W. Eliceiri, Nat. Methods, 2012, 9, 671 CrossRef CAS.
- Z. Shu, Y. Zhang, Q. Yang and H. Yang, Nanoscale Res. Lett., 2017, 12, 135 CrossRef PubMed.
- A. Rapsomanikis, D. Papoulis, D. Panagiotaras, E. Kaplani and E. Stathatos, Global NEST J., 2014, 16, 485–498 Search PubMed.
- L. Rodriguez-Sanchez, M. C. Blanco and M. A. Lopez-Quintela, J. Phys. Chem. B, 2000, 104, 9683–9688 CrossRef CAS.
- L.-P. Jiang, A.-N. Wang, Y. Zhao, J.-R. Zhang and J.-J. Zhu, Inorg. Chem. Commun., 2004, 7, 506–509 CrossRef CAS.
- S. Link and M. A. El-Sayed, Annu. Rev. Phys. Chem., 2003, 54, 331–366 CrossRef CAS PubMed.
- G. A. Martinez-Castanon, N. Nino-Martinez, F. Martinez-Gutierrez, J. R. Martinez-Mendoza and F. Ruiz, J. Nanopart. Res., 2008, 10, 1343–1348 CrossRef CAS.
- R. Desai, V. Mankad, S. K. Gupta and P. K. Jha, Nanosci. Nanotechnol. Lett., 2012, 4, 30–34 CrossRef CAS.
- A. Yadav, V. Prasad, A. A. Kathe, S. Raj, D. Yadav, C. Sundaramoorthy and N. Vigneshwaran, Bull. Mater. Sci., 2006, 29, 641–645 CrossRef CAS.
- M. M. AbdElhady, Int. J. Carbohydr. Chem., 2012, 840591 Search PubMed.
- A. K. Zak, R. Razali, W. H. A. Majid and M. Darroudi, Int. J. Nanomed., 2011, 6, 1399 Search PubMed.
- G. Angajala, P. Pavan and R. Subashini, RSC Adv., 2014, 4, 51459–51470 RSC.
- P. V. AshaRani, G. Low Kah Mun, M. P. Hande and S. Valiyaveettil, ACS Nano, 2008, 3, 279–290 CrossRef.
- M. V. D. Z. Park, A. M. Neigh, J. P. Vermeulen, L. J. J. de la Fonteyne, H. W. Verharen, J. J. Briedé, H. van Loveren and W. H. de Jong, Biomaterials, 2011, 32, 9810–9817 CrossRef CAS.
- L.-Y. Wong, J. Recht and B. C. Laurent, J. Mol. Histol., 2006, 37, 261–269 CrossRef CAS PubMed.
- W. J. Trickler, S. M. Lantz, A. M. Schrand, B. L. Robinson, G. D. Newport, J. J. Schlager, M. G. Paule, W. Slikker, A. S. Biris and S. M. Hussain, Nanomedicine, 2012, 7, 835–846 CrossRef CAS.
- N. Mroczek-Sosnowska, E. Sawosz, K. Vadalasetty, M. Łukasiewicz, J. Niemiec, M. Wierzbicki, M. Kutwin, S. Jaworski and A. Chwalibog, Int. J. Mol. Sci., 2015, 16, 4838–4849 CrossRef CAS.
- L. Taccola, V. Raffa, C. Riggio, O. Vittorio, M. C. Iorio, R. Vanacore, A. Pietrabissa and A. Cuschieri, Int. J. Nanomed., 2011, 6, 1129 CAS.
- K. M. Reddy, K. Feris, J. Bell, D. G. Wingett, C. Hanley and A. Punnoose, Appl. Phys. Lett., 2007, 90, 213902 CrossRef.
- G. Cavallaro, et al. , J. Phys. Chem. C, 2015, 119(16), 8944–8951 CrossRef CAS.
- Y. Lvov, W. Wang, L. Zhang and R. Fakhrullin, Adv. Mater., 2016, 28, 1227–1250 CrossRef CAS.
- G. Cavallaro, G. Lazzara, S. Milioto, F. Parisi, V. Evtugyn, E. Rozhina and R. Fakhrullin, ACS Appl. Mater. Interfaces, 2018, 10, 8265–8273 CrossRef CAS.
- S. Patel, U. Jammalamadaka, L. Sun, K. Tappa and D. K. Mills, Bioengineering, 2015, 3(1), 1 CrossRef.
- M. Massaro, G. Lazzara and R. Noto, et al. , Rend. Fis. Acc. Lincei, 2020, 31, 213–221 CrossRef.
- G. Gorrasi, Carbohydr. Polym., 2015, 127, 47–53 CrossRef CAS PubMed.
- Y. Liu, J. Zhang, H. Guan, Y. Zhao, J.-H. Yang and B. Zhang, Appl. Surf. Sci., 2018, 427, 106–113 CrossRef CAS.
- S. Barrientos-Ramírez, E. V. Ramos-Fernández, J. Silvestre-Albero, A. Sepúlveda-Escribano, M. M. Pastor-Blas and A. González-Montiel, Microporous Mesoporous Mater., 2009, 120, 132–140 CrossRef.
- A. Glotov, A. Stavitskaya, Y. Chudakov, E. Ivanov, W. Huang, V. Vinokurov, A. Zolotukhina, A. Maximov, E. Karakhanov and Y. Lvov, Bull. Chem. Soc. Jpn., 2019, 92(1), 61–69 CrossRef CAS.
- A. A. Hermawan, J. W. Chang, P. Pasbakhsh, F. Hart and A. Talei, Appl. Clay Sci., 2018, 160, 106–115 CrossRef CAS.
- W. Wei, E. Abdllayev, A. Goeders, A. Hollister, L. Lvov and D. K. Mills, Macromol. Mater. Eng., 2012, 297, 645–653 CrossRef CAS.
- U. Jammalamadaka, K. Tappa, J. A. Weisman, J. C. Nicholson and D. K. Mills, Nanotechnol., Sci. Appl., 2017, 10, 105–114 CrossRef CAS.
- U. Jammalamadaka, K. Tappa and D. K. Mills, Calcium phosphate/clay nanotube bone cement with enhanced mechanical properties and sustained drug release, in Clay Science and Engineering, ed. M. Zoveidavianpoor, InTech Publishers, 2018 Search PubMed.
- D. A. Cunha, N. S. Rodrigues and L. C. Souza, et al. , Materials, 2018, 11(7), 1080 CrossRef.
- M. Liu, C. Wu, Y. Jiao, S. Xiong and C. Zhou, J. Mater. Chem. B, 2013, 1(15), 20782089 RSC.
- X. Zhao, C. Zhou and M. Liu, J. Mater. Chem. B, 2020, 8(5), 838–851 RSC.
- K. Roy, S. C. Debnath, A. Pongwisuthiruchte and P. Potiyaraj, Appl. Clay Sci., 2019, 183, 105300 CrossRef CAS.
- D. K. Mills and C. Boyer, Method for metalizing nanotubes through electrolysis, US Pat., 9981074B1, 2018 Search PubMed.
| This journal is © The Royal Society of Chemistry 2020 |

