DOI:
10.1039/D0MA00092B
(Paper)
Mater. Adv., 2020,
1, 2346-2356
Unusual redshift due to selective hydrogen bonding between F− ion and sensor motif: a naked eye colorimetric sensor for F− ions in an aqueous environment†
Received
11th March 2020
, Accepted 21st August 2020
First published on 24th August 2020
Abstract
Naked-eye detection of anions is a challenging but useful technique. In this study, two novel colorimetric monomeric sensors based on highly selective 2,4-dinitrophenylhydrazine were designed, synthesized, and employed as a selective ratiometric optical sensor for F− ion detection via the naked eye. The anion recognition properties were investigated via a pattern of color change as well as changes in absorbance signaling maxima. Sensor molecules were characterized by 1H NMR, 13CNMR, HRMS, and FTIR spectroscopy. Selectivity towards F− ions was attributed to the capability of H-bonding interaction of N–H bonds, which was determined by 1H NMR titration, 19F NMR titration, and UV-vis spectroscopic titration. The association constants of 0.263 × 10⁶ M−1 (compound 4) and 6.4988 × 10⁶ M−1 were calculated using the Benesi–Hildebrand equation from UV-vis spectroscopic analysis. The limit of detection (LOD) for both monomeric sensors was 68.182 nM (compound 4) and 72.341 nM (compound 9) and for the polymeric sensor, it was 18.98157 nM (compound 11). Job's plot analysis revealed the existence of 1![[thin space (1/6-em)]](https://www.rsc.org/images/entities/char_2009.gif) :1 complex formation of F− ions with both monomeric sensor molecules. The same colorimetric response and selectivity properties were exhibited by the norbornene-based homopolymer of the polymeric sensor molecule towards F− ions.
:1 complex formation of F− ions with both monomeric sensor molecules. The same colorimetric response and selectivity properties were exhibited by the norbornene-based homopolymer of the polymeric sensor molecule towards F− ions.
1. Introduction
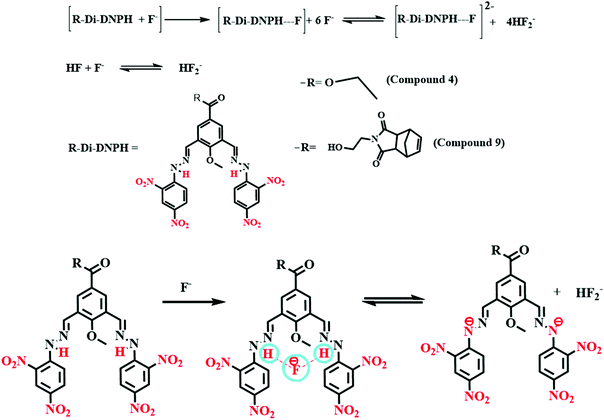
All anions play an important role in both biological and environmental systems.1,2 Among them, F− ions are vital to humans because their deficiency leads to osteoporosis, and their overexposure causes weak bones and dental issues.3–5 Hence, F− ion detection and removal are important challenges nowadays. Some of the existing techniques for F− ion determination include using a smartphone, an ion-selective electrode or a membrane-selective electrode, solid-state combination, optical methods, etc. In most of the cases, instruments are expensive and difficult to handle.6 Therefore, developing comparatively cheaper and easy-to-handle F− ion techniques is currently an attractive topic for researchers in different fields. Inorganic fluoride is mainly obtained from F− ion-containing rocks, e.g., apatite, fluorite, biotite, and hornblende. Other sources include volcanic ash, agricultural fertilizers, combustion of coal, etc. Improper disposal of fly ash on the ground surface contributes fluoride to groundwater.7,8 The WHO-permitted range of F− ion concentration in groundwater is 0.6 mg mL−1 to 1.5 mg mL−1. The presence of this anionic species beyond this range is carcinogenic.9 Hence, the superior detection and quantification of F− ions is a new challenge for researchers. Among all the existing detection techniques of F− ions, colorimetric detection using a simple chemical sensor has recently gained research interest due to its low cost, easy handling, and easily available environment-friendly chemical characteristics for making such a kind of sensors.10–13 Using the colorimetric technique, we can detect anions through the naked eye, which is otherwise impossible in the case of other fluorometric probes. It also facilitates the easy detection of F− ions in real water samples. So, colorimetric naked-eye recognition is an essential tool for F− ion detection at the ppm-level.14 All monomeric colorimetric sensors contain one chromogenic site and one binding site. Upon binding the analyte to the binding site of the sensor molecule, the chromogenic unit responds by changing its color, which can be seen by the naked eye. The analyte can bind to the sensor through both covalent and non-covalent ways. Non-covalent interaction is mostly electrostatic interaction, including π interaction and H-bonding interaction.15–17 For H-bonding interaction, various research groups reported various moieties such as hydrazine-based indoles, bodipy-indole conjugates, calixpyrroles, polyamines, urea, thiourea, amides, imidazole, pyrrolyl derivatives, sulphonamides, amides, etc.18–26 All the above moieties form H-bonding interactions with the smallest negatively charged dense species (mostly F− ions) and are responsible for a drastic color change.27–34 Many of the above-mentioned systems can undergo abstraction of a proton by the classical Bronsted acid–base type of interaction at a higher concentration of F− ions.34–42 All the above monomeric systems can detect the analyte at the ppm level through a change in the spectroscopic behavior at a particular wavelength. Among the reported F− ion sensors, very few systems have a ratiometric sensing property, which depends on various factors like concentration, electronic environment, phototransformation, etc. A redshift of more than 100 nm is rare for most of the existing F− ion sensors, which makes our proposed sensor very effective compared to other reported systems. In the case of a polymeric sensor, the chromogenic unit increases due to an increase in the repeating unit, so the color intensity of the polymeric sensor is higher than that of the monomeric sensor. Thus, naked-eye detection becomes easy in the case of a polymer-based sensor compared to the monomeric sensor. On the other hand, in the case of the polymeric probe, side-chain interaction between probes and analyte increases the sensing efficiency by many fold.43
 |
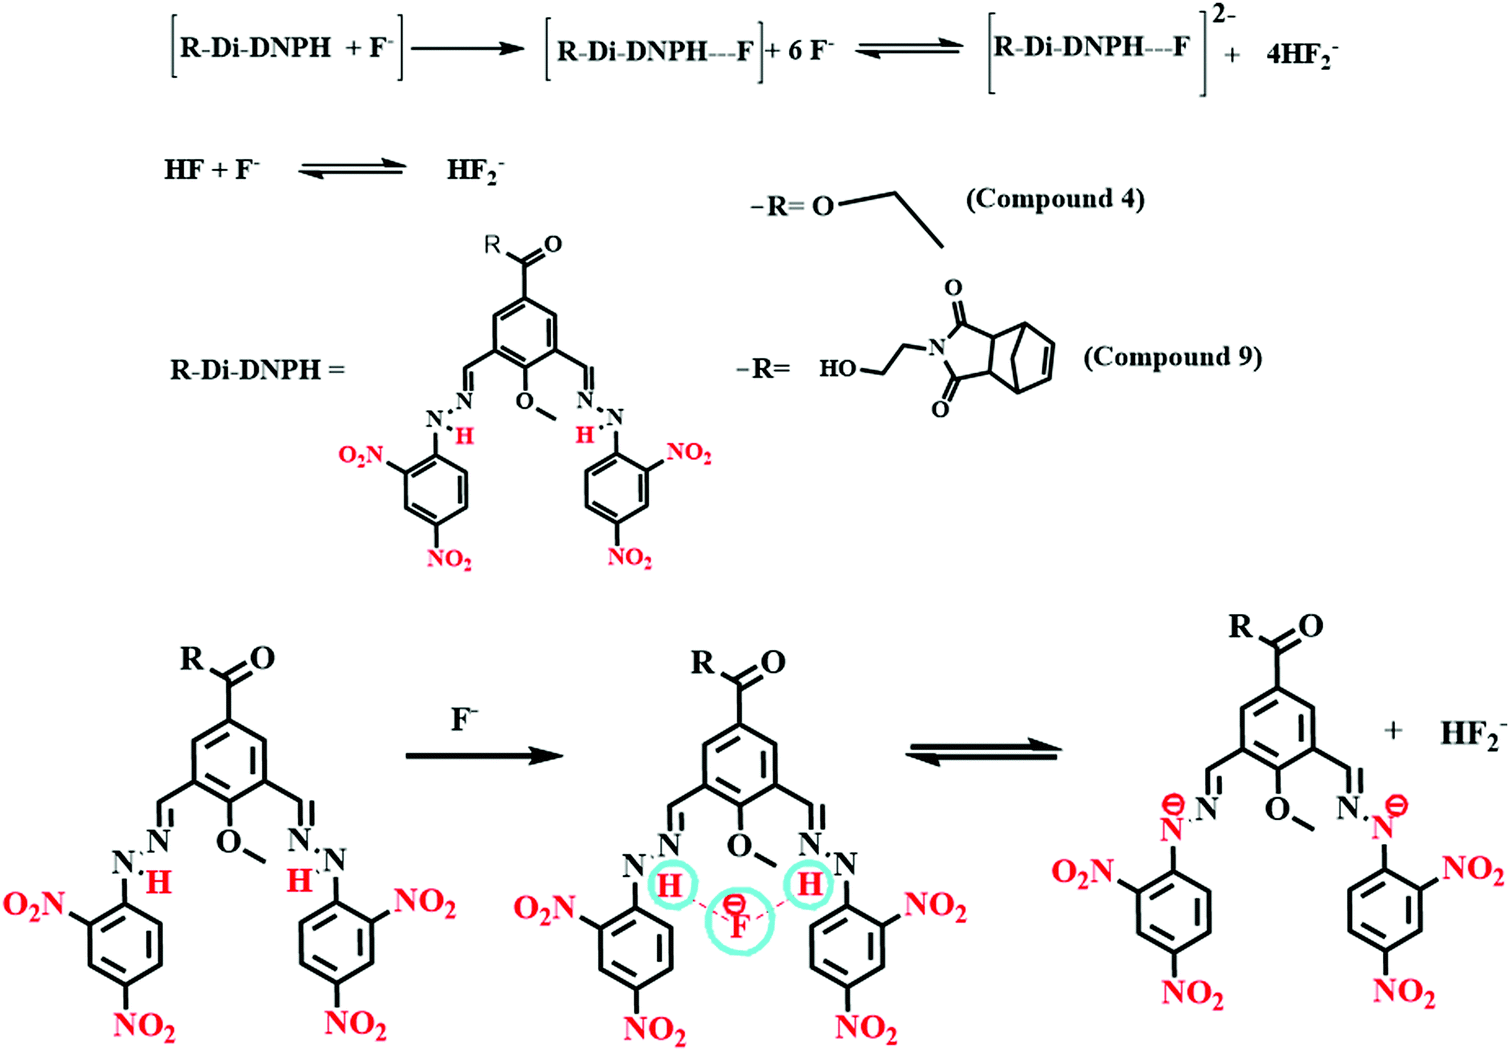
| | Fig. 1 Synthetic schemes of (A) compound 4, (B) compound 9, and (C) compound 11. | |
2. Design and synthesis of sensors
To investigate the preparation of an efficient, low-cost colorimetric fluoride sensor, monomeric and polymeric sensors were synthesized as shown in Fig. 1 (all the experimental procedures are given in the ESI†). Compound 2 was prepared by incorporation of the dial (Fig. S1, ESI†) to the ester of 4-hydroxybenzoic acid (compound 1 Fig. S1, ESI†) by refluxing. The condensation of the dial (compound 3 Fig. S1, ESI†) with 2,4-DNPH resulted in the final sensor molecule (compound 4 Fig. S1, ESI†). Similarly, we incorporated the dial to 4-hydroxy benzoic acid by refluxing to obtain compound 6 (Fig. S1, ESI†). For incorporation of that dial to the norbornene monomer (compound 5 Fig. S1, ESI†), DCC coupling and column chromatography were performed, which resulted in the formation of compound 7 (Fig. S1, ESI†). Compound 9 (Fig. S1, ESI†) was isolated by the condensation of the nordial (compound 8, Fig. S1, ESI†) with 2,4-DNPH refluxing in EtOH. Ring-opening metathesis polymerization was performed by a Grubbs catalyst (2nd generation) with molecule compound 8, and we obtained compound 10 (Fig. S1, ESI†). The final polymeric sensor, (compound 11 Fig. S1, ESI†) was obtained through the post polymer modification reaction involving the condensation of 2,4-DNPH with compound 10 (Fig. S1, ESI†) and molecular weight was obtained by GPC (gel permeation chromatography Fig. S23, ESI†). All the above monomeric sensor molecules (compound 4 (Fig. S1, ESI†), compound 9 (Fig. S1, ESI†), and the polymeric sensor (compound 11, Fig. S1, ESI†)) were synthesized and well-characterized using 1H NMR, 13CNMR, ESI-mass and FT-IR spectroscopy techniques (Fig. S2–S22, ESI†).
3. Results and discussion
3.1 Optical properties (selectivity and sensitivity study)
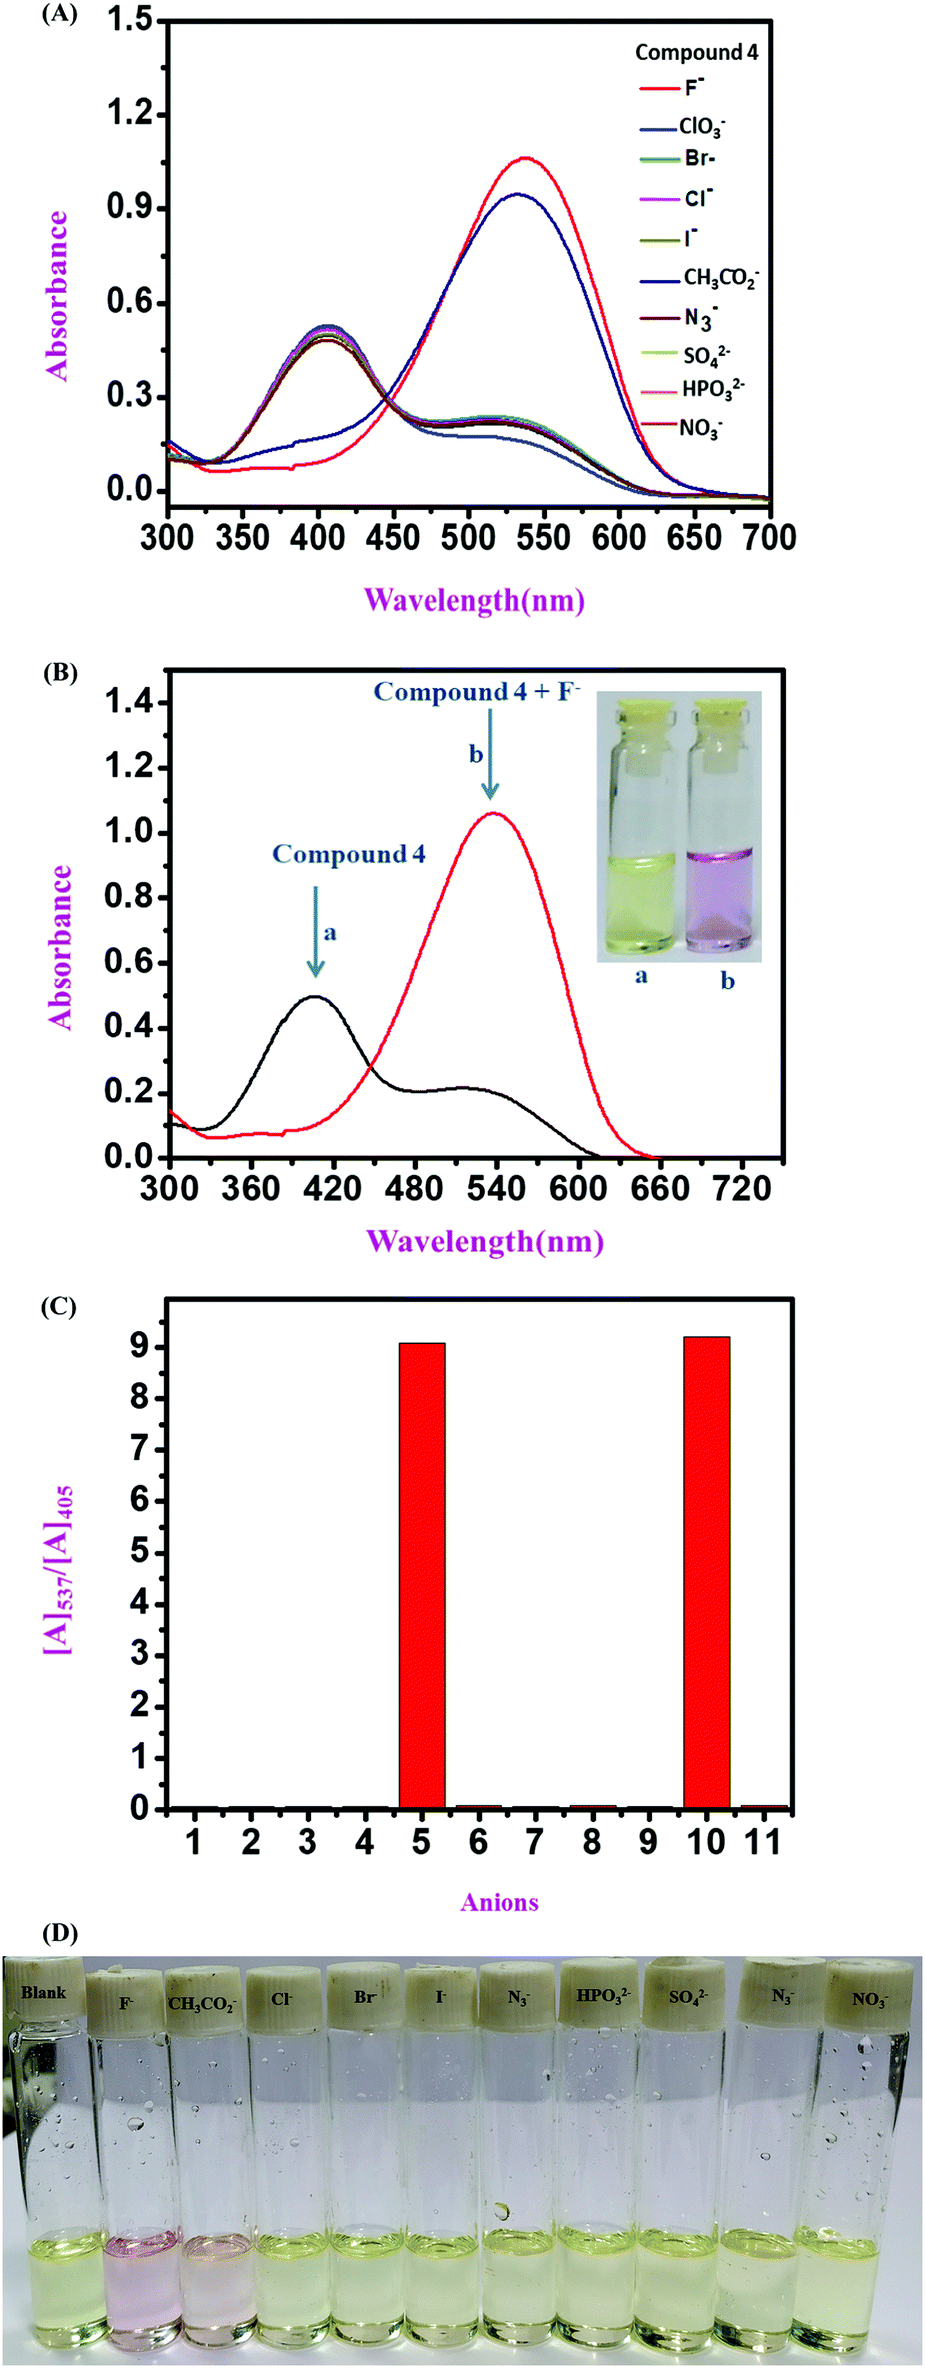
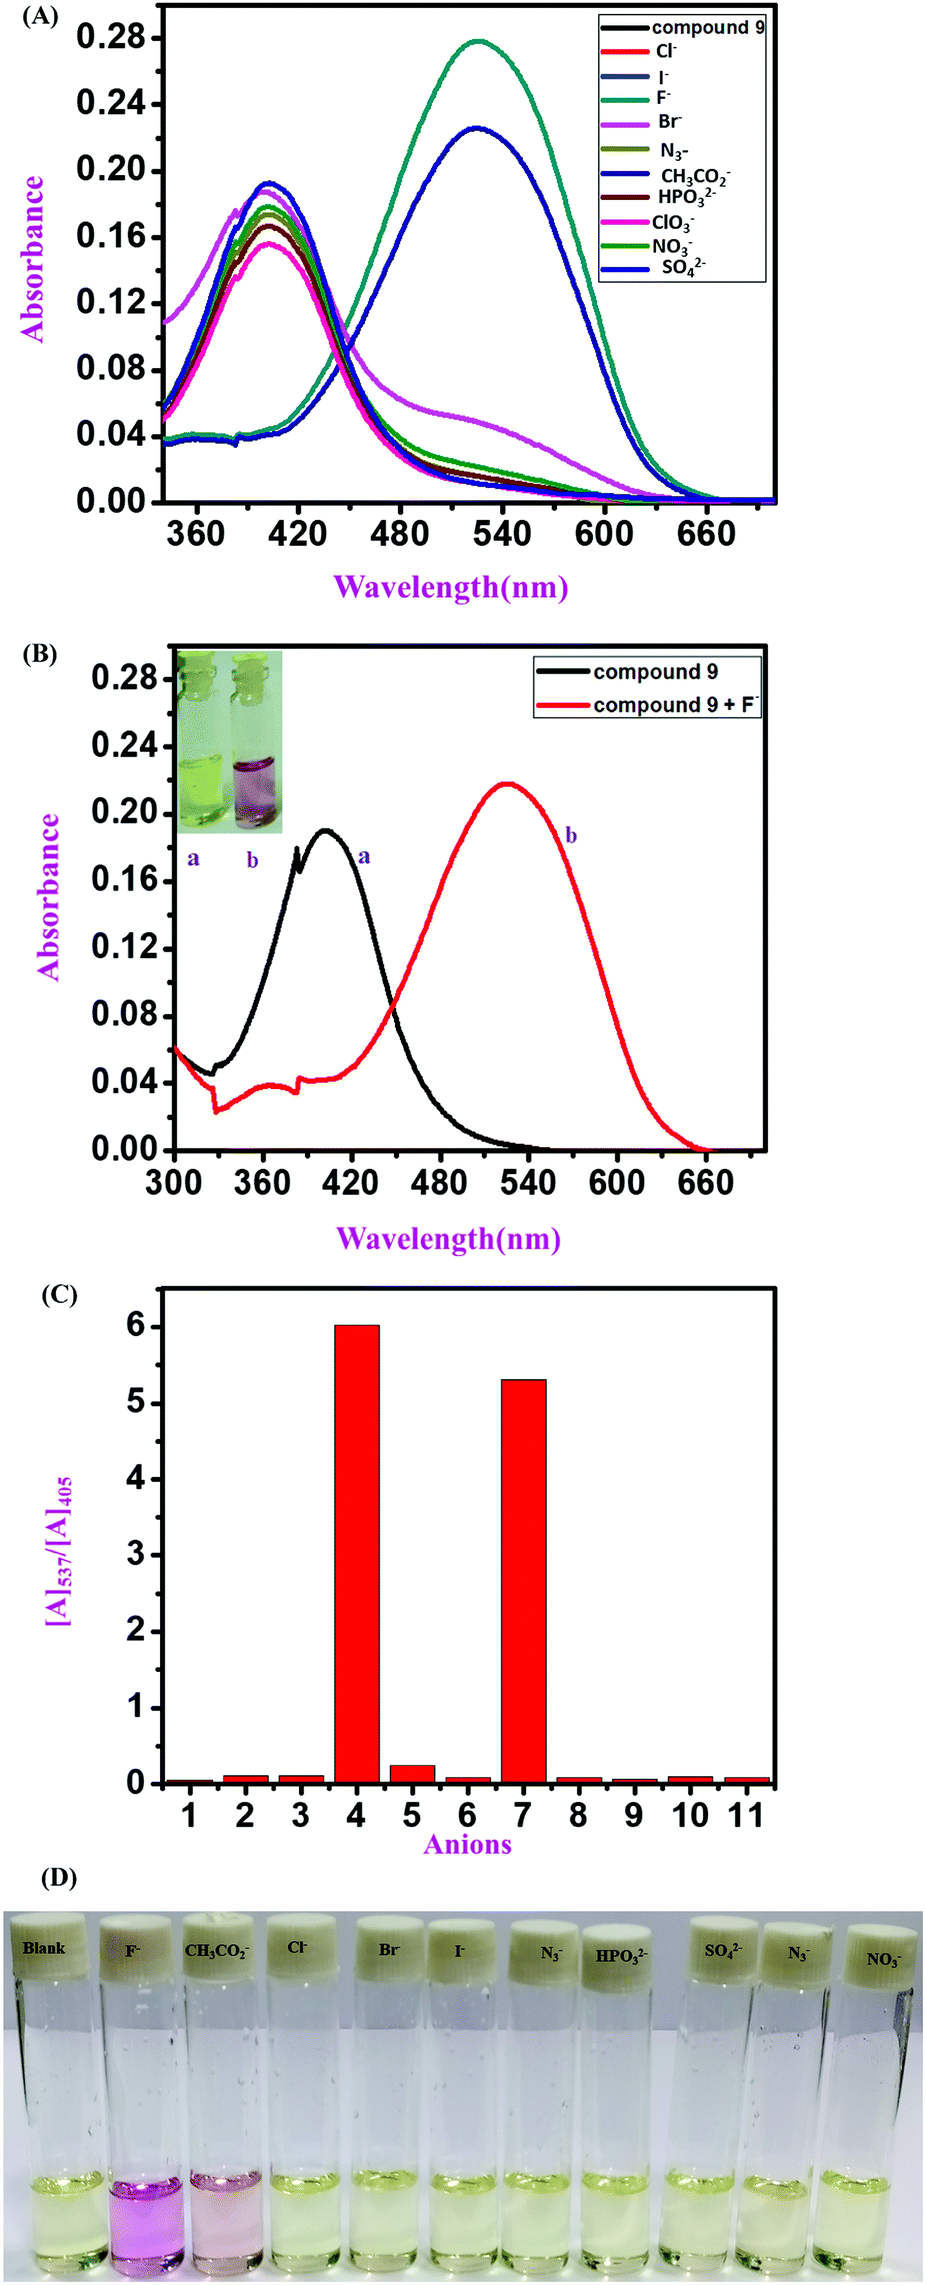
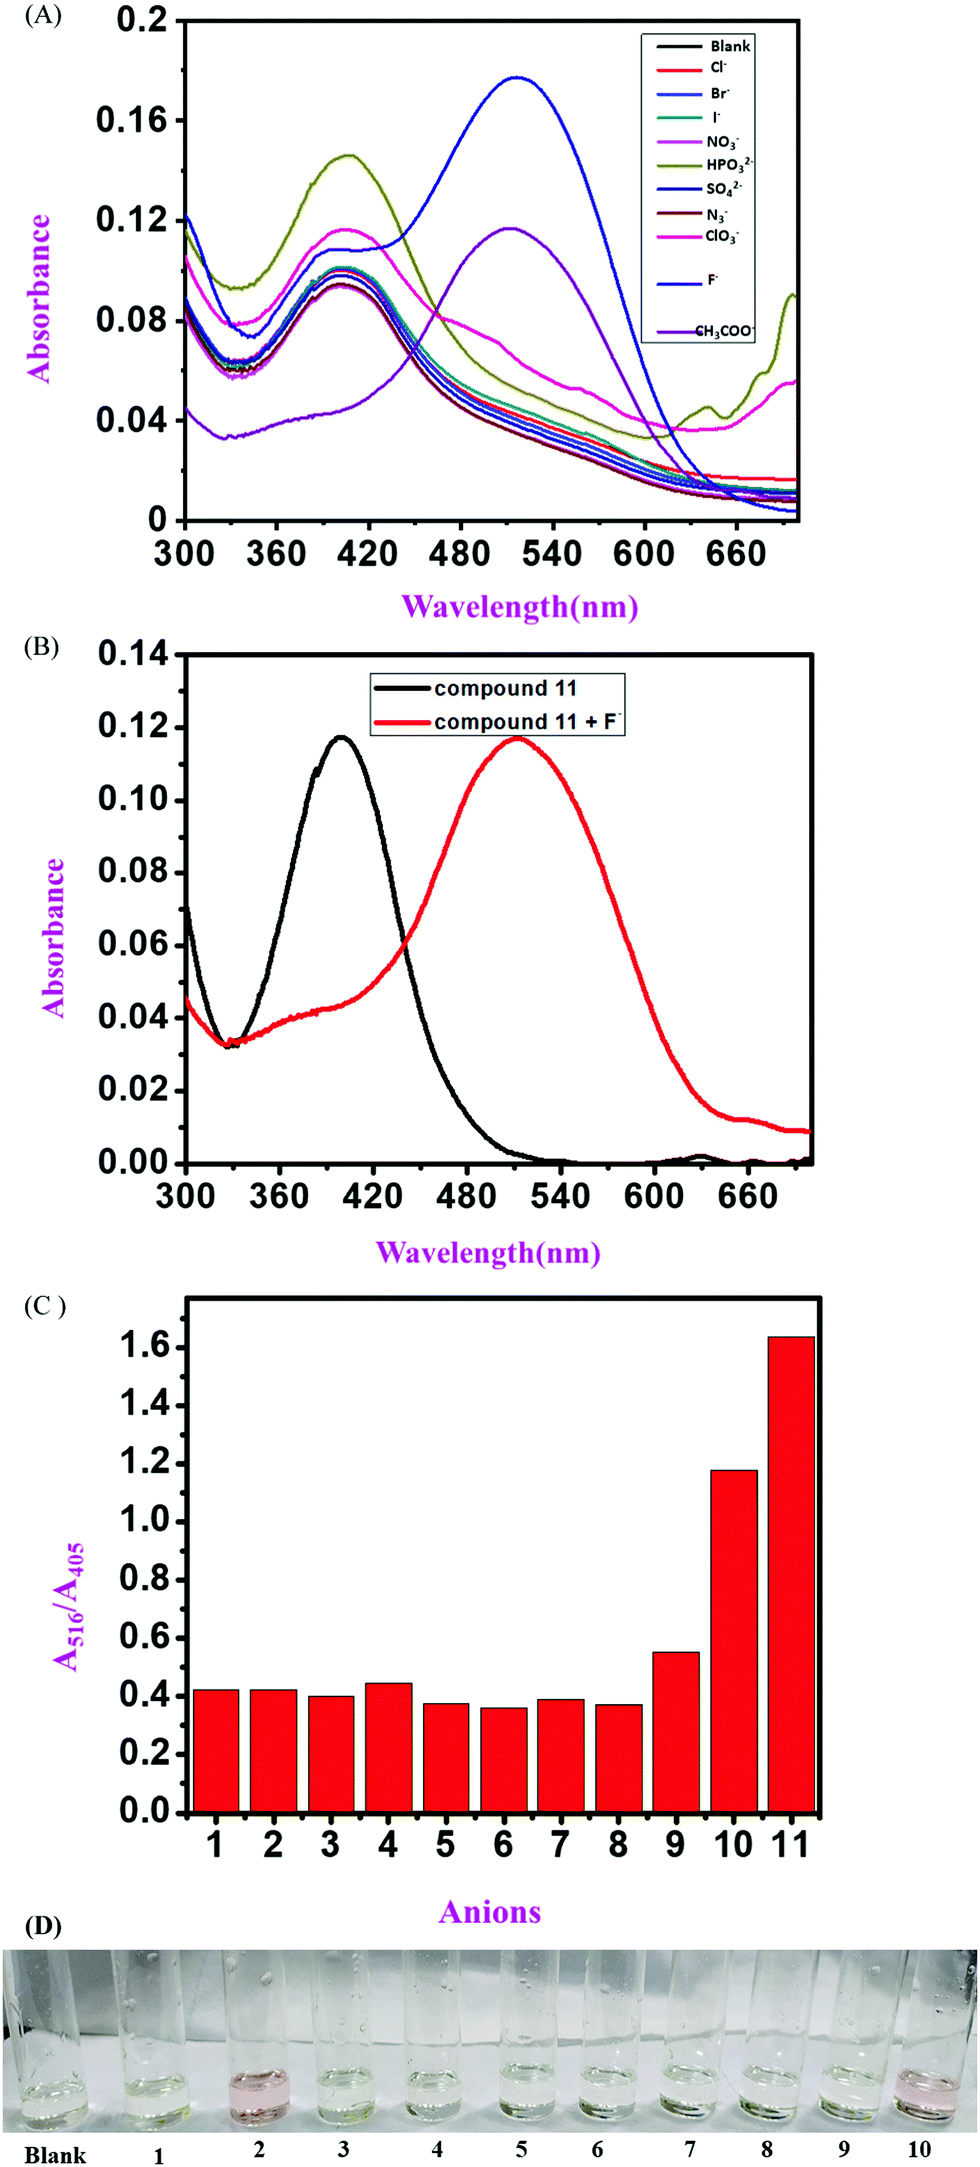
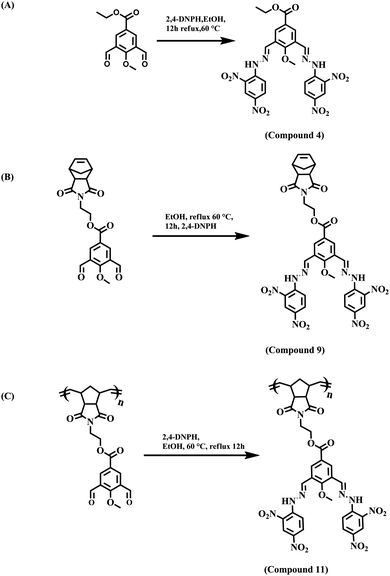
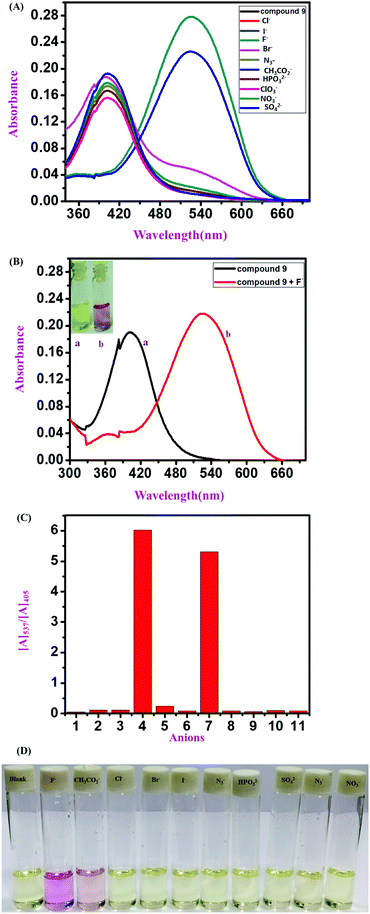
Absorbance spectra of the monomeric and polymeric sensors were recorded in a DMSO:H2O 9:1 v/v solvent mixture with Tris–HCl buffer at pH 7.4. All three sensor molecules exhibited an absorbance maximum at λmax 405 nm, and the color of the sensors was light yellow, which was visible to the naked eye (Fig. 2–4). Selectivity is an important parameter for investigating the performance and further applicability of a sensing mechanism. The anion receptor properties were investigated upon the addition of various interfering anions (F−, Cl−, Br−, CH3CO2−, I−, ClO3−, HPO32−, N3−, SO42− and NO3−), and an interesting shift in the absorbance peak was observed from 405 nm to 537 nm selectively for ion addition (Fig. 2 and 3) to the monomeric sensor compound 4 and compound 9. The colors of the monomeric sensor solutions were changed from light yellow to dark pink instantly within seconds under the optimized conditions of Tris–HCl buffer (pH 7.4) at room temperature in a DMSO:H2O 9:1 v/v solvent mixture. The above interesting selectivity was observed only for F− ions in the presence of other interfering anions for all the monomeric and polymeric sensor molecules. The F− ion is a highly electronegative species, as a result of which a strong H-bonding interaction occurred, which is responsible for the drastic color changes of the sensors in addition to the F− ion acceptor site44,45 (Fig. 2–4).
 |
| | Fig. 2 (A) UV-vis absorbance spectra of compound 4 (2.5 × 10⁻⁵ M) in the presence of different anions (2.5 × 10⁻⁵ M Cl−, Br−, I−, CH3CO2−, NO3−, ClO3−, N3−, HPO32−, F−, and SO42−) (in a DMSO:H2O 9:1 v/v solution mixture with Tris–HCl buffer at pH 7.4). (B) UV-vis absorbance spectra of compound 4 (2.5 × 10⁻⁵ M) in the absence and presence of F− ions (2.5 × 10⁻⁵ M). (C) Corresponding bar diagram for the selectivity of compound 4 (2.5 × 10⁻⁵ M) in the presence of different anions: (1) blank, (2) Cl−, (3) Br− (4) I−, (5) CH3CO2−, (6) NO3−, (7) ClO3−, (8) N3−, (9) HPO32−, (10) F− and (11) SO42−. (D) Pictorial presentation of compound 4 (2.5 × 10⁻⁵ M) in the presence of different anions (2.5 × 10⁻⁵ M TBA+ salt of anions in water). | |
 |
| | Fig. 3 (A) UV-vis absorbance spectra of compound 9 (1.5 × 10⁻⁵ M) in the presence of different anions (2.5 × 10⁻⁵ M Cl−, Br−, I−, CH3CO2−, NO3−, ClO3−, N3−, HPO32−, F−, and SO42−) (in a DMSO:H2O 9:1 v/v solution mixture with Tris–HCl buffer at pH 7.4). (B) UV-vis absorbance spectra of compound 9 (1.5 × 10⁻⁵ M) in the absence and presence of F− ions (2.5 × 10⁻⁵ M). (C) Corresponding bar diagram for the selectivity of compound 9 (2.5 × 10⁻⁵ M) in the presence of different anions: (1) blank, (2) Cl−, (3) Br− (4) F−, (5) I−, (6) NO3−, (7) CH3CO2−, (8) N3−, (9) HPO32−, and (10) SO42−. (D) Pictorial presentation of compound 9 (1.5 × 10⁻⁵ M) in the presence of different anions (2.5 × 10⁻⁵ M TBA+ salt of anions in water). | |
 |
| | Fig. 4 (A) UV-vis absorbance spectra of compound 11 (1 mg in 2 mL of DMSO solvent) in the presence of different anions (2.5 × 10⁻⁵ M Cl−, Br−, I−, CH3CO2−, NO3−, ClO3−, N3−, HPO32−, F−, and SO42−) (in a DMSO:H2O 9:1, v/v solution mixture with Tris–HCl buffer at pH 7.4). (B) UV-vis absorbance spectra of compound 11 (1 mg in 2 mL of DMSO solvent) in the absence and presence of F− ions (2.5 × 10⁻⁵ M). (C) Corresponding bar diagram for the selectivity of compound 11 (1 mg in 2 mL of DMSO solvent) in the presence of different anions: (1) blank, (2) Cl−, (3) Br−, (4) I−, (5) SO42−, (6) NO3−, (7) ClO3−, (8) N3−, (9) HPO32−, (10) CH3CO2−, and (11) F−. (D) Pictorial presentation of compound 11 (1 mg in 2 mL of DMSO solvent) in the presence of different anions (2.5 × 10⁻⁵ M TBA+ salt of anions in water). | |
A comparative UV-vis study was carried out in the presence of various interfering anions, F−, Cl−, Br−, CH3CO2−, I−, ClO3−, HPO32−, N3− NO3− and SO42−, with compound 11 (polymeric sensor). The color change upon the addition of F− ions for the polymeric sensor was investigated, taking 1 mg of the polymeric sensor and dissolving 1800 mL of DMSO solution. Upon the addition of F− ions selectively, the absorbance maximum shifted from λmax 405 nm to λmax 516 nm in the 9:1 (v/v) DMSO:H2O solution mixture at pH 7.4 in the Tris–HCl buffer solution. The color of the blank polymeric sensor was light yellow, as detected by the naked eye, which changes instantly to dark pink by the addition of F− ions (TBA+ salt 10−2 M stock solution in water). The color intensity of the polymeric sensor was higher than that observed for the monomeric sensors because of the greater number of repeating units in the polymeric backbone than in the monomeric sensors. It was observed that, due to the polymeric repeating unit, the spectra were broad for both blank polymeric sensors and in the presence of TBAF. The more intense and drastic naked eye and spectroscopic color changes are one of the advantages of polymeric sensors compared to the monomeric sensors with the selective addition of F− ions (Fig. 4).
3.2 Spectroscopic titration study
3.2.1 UV-vis spectroscopic titration.
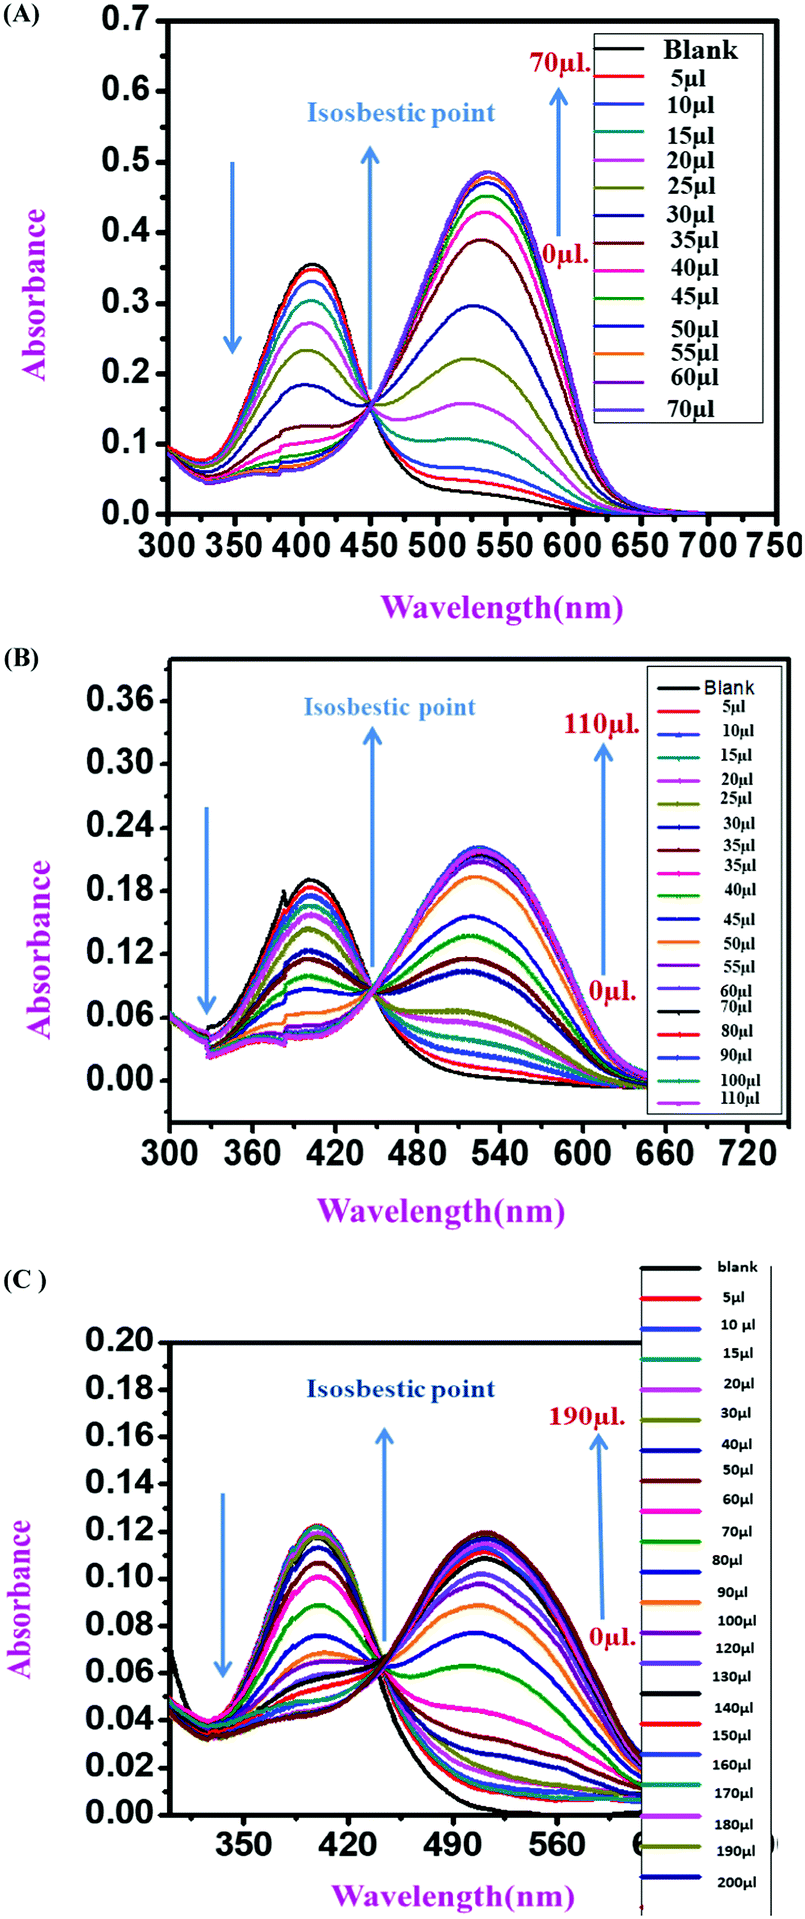
To investigate the interaction mechanism between fluoride and sensor molecules, concentration-dependent UV-vis titration studies were carried out with (2.5 × 10⁻⁶ M) compound 4 and 10−4 M F− ions as a stock solution in the DMSO:H2O (9:1 v/v) solution in the presence of Tris–HCl buffer solution (pH 7.4) (Fig. 5). With the gradual addition of F− ions into the sensor (compound 4) solution, the absorbance at λmax 405 nm for the monomeric sensors decreased, and a new absorbance band gradually increased at λmax 537 nm. Upon the addition of 2.5 × 10⁻⁶ M F− ions (4 equivalent F− ion), a saturation point was attained by the monomeric sensor (for compound 4). For the concentration-dependent titration experiment, compound 9 was taken as a 2.5 × 10⁻⁶ M solution in DMSO solvent with 10−3 M F− ions as a stock solution (TBA+ salt). Unlike compound 4, in the case of compound 9, the absorption maximum at λmax 405 nm also gradually decreased upon the addition of the F− ion solution, and a new maximum was generated at λmax 537 nm in the medium. A saturation point was achieved at 3.0 × 10⁻⁵ M F− ion concentration. A polymeric sensor molecule (1 mg/2 mL DMSO solvent) was obtained upon the addition of F− ions (10−3 M). A saturation point was achieved in the (6.5 × 10⁻⁵ M) F− ion solution. The absorbance maximum at λmax 405 nm decreased, and a new absorption maximum was generated at λmax 516 nm. A saturation point was achieved in the (6.5 × 10⁻⁵ M) F− ion solution. Due to the high redshift of absorption spectra from λmax 405 nm to λmax 537 nm (for the monomeric sensor), and from λmax 405 nm to λmax 516 nm (for the polymeric sensor), an isosbestic point was observed at about λmax 444 nm (for all sensor molecules), which provides the strongest evidence for the interaction of the sensor with the analyte. So, from the concentration-dependent UV-vis titration spectra, it was observed that the analyte was interacting with the monomeric and polymeric sensors in a ratiometric fashion. During the experiment, when the F− ion concentration was increased gradually, the color of the monomeric sensor changed from light yellow to dark pink in the cuvette, as detected by the naked eye.36,37A537/A405 (for monomeric sensors) and A516/A405 (for the polymeric sensor) were linearly and positively correlated with the F− ion concentration, as shown in Fig. 5.
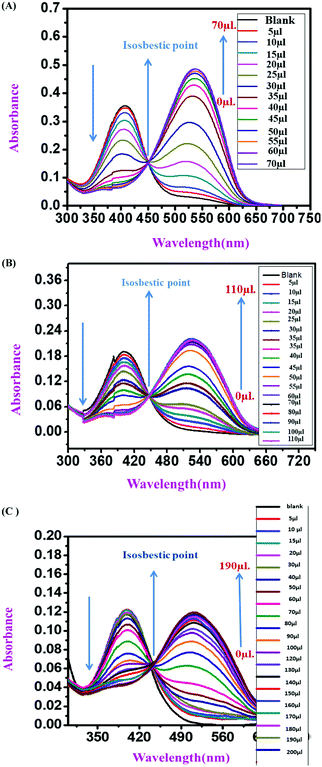 |
| | Fig. 5 UV-vis titration spectra for (A) compound 4 (2.5 × 10⁻⁶ M); (B) compound 9 (1.5 × 10⁻⁵ M); (C) compound 11 (1 mg in 2 mL of DMSO:H2O [9:1 v/v] solvent) in the presence the TBA+ salt of F− ions (10−4 M stock solution, 10−3 M and 10−3 M stock solution) in the DMSO:H2O (9:1 v/v) solution with Tris–HCl buffer (pH 7.4). | |
As the sensors contain a strong electron-withdrawing –NO2 group, it withdraws electrons from the NH group, resulting in a partially positive charge on the H-atom. This positively charged H atom is a harder acid in nature. The F− ion is a hard base due to its high negative charge density and smaller size than the other interfering anions (F−, Cl−, Br−, CH3CO2−, I−, ClO3−, HPO32−, N3−, SO42− and NO3−). As a result of the HSAB principle, the F− ion can make a strong H-bonding interaction with partially positively charged H-atoms of NH groups present in both the monomeric and polymeric sensors.36 Because of this reason, the sensor molecules undergo interaction ratiometrically with F− ions.
3.2.2
1H NMR titration study.
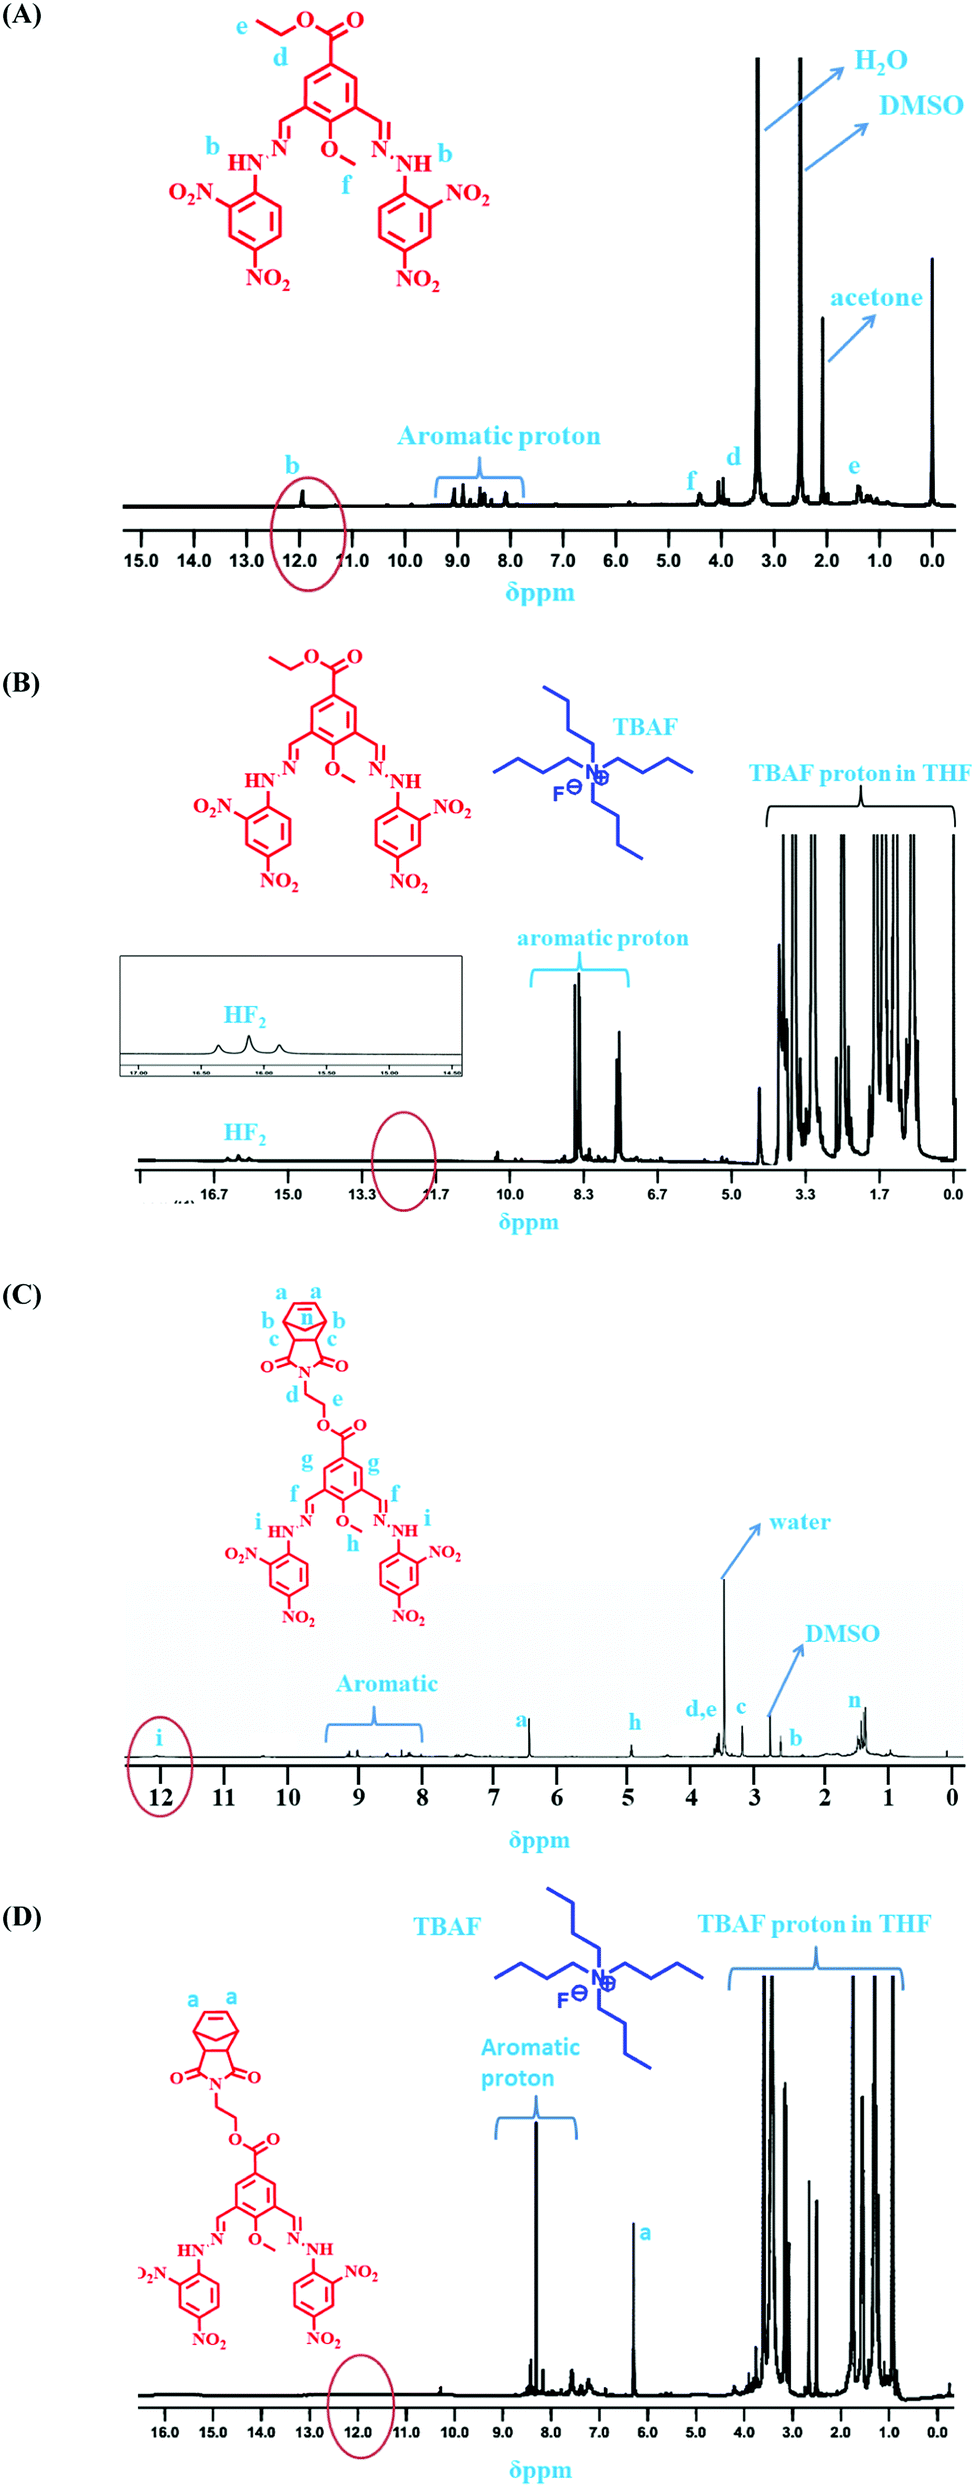
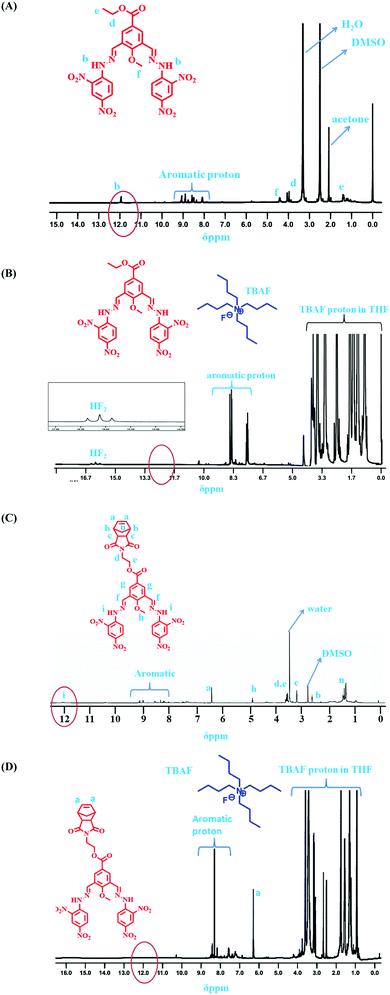
For the further investigation of the interaction mechanism, 5 μL of F− ions (10−2 M) was added to the monomeric sensors of concentration 10−3 M in the 0.5 M DMSO-d6 solvent, followed by NMR titration. The NMR spectra showed that, after the addition of TBAF, the NH peak at around 12 ppm vanished, and a triplet was formed at around 16 ppm. Besides, the splitting number of the aromatic peaks was found to decrease compared to the splitting before the addition of the analyte to the monomeric sensors. A new peak was generated at about 16 ppm, which implies the formation of HF2−. This observation indicates that the F− ion abstracted the H-atom from the NH group, making all the sensor molecules negatively charged. This abstraction of a H-atom generated a highly water-soluble species, HF2−, in the medium. The negative charge formed due to the abstraction of H-atoms can delocalize from the N atoms all over the molecule, resulting in a decreased splitting of all aromatic peaks due to ICT.37 Here, a naked-eye color change was observed from light yellow to dark pink in the NMR tube itself upon the addition of F− ions to the sensors due to strong ICT (intermolecular charge transfer) during the titration experiment (Fig. 6).
 |
| | Fig. 6
1H NMR spectrum after the addition of TBAF (10−2 M) to (A) compound 4 (10−3 M); (B) after the addition of TBAF to compound 4 (10−3 M); (C) compound 9 (10−3 M); (D) after the addition of TBAF to compound 9 (10−3 M) in DMSO-d6. | |
3.2.3
19F NMR titration study.
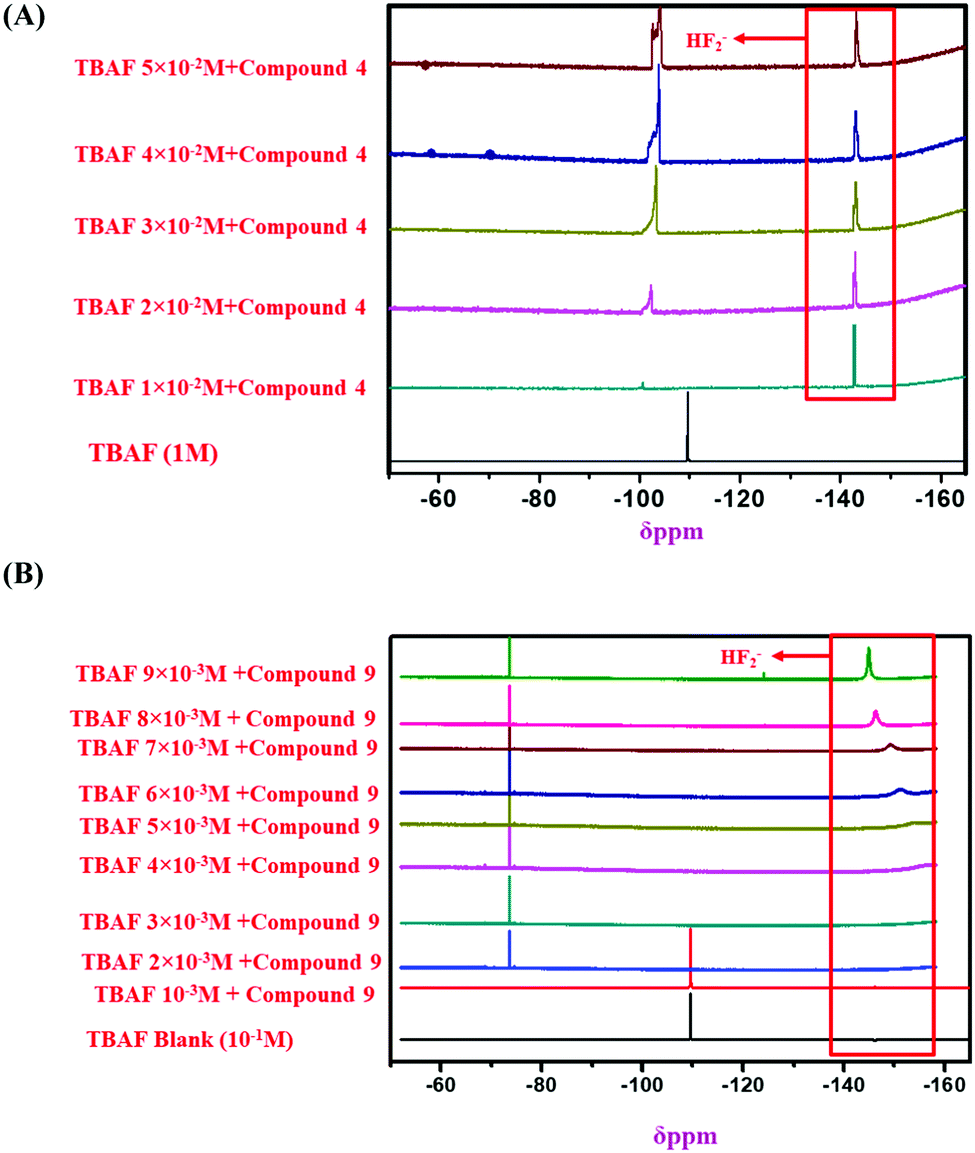
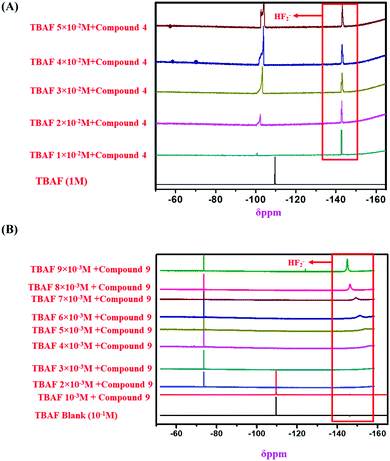
To investigate the interaction of F− ions with the monomeric sensors (compound 4 and compound 9), a 19F NMR titration experiment was performed using a Bruker 500 MHz instrument. Then, by fixing the concentration of monomeric sensors (10−2 M for both), solutions with the TBAF concentration of 1 M (stock solution concentration) (for compound 4) and TBAF concentration of 10−1 M (stock solution concentration) were added in 5 μL amounts, and spectra were recorded after every addition of F− ions. Then, all 19F NMR spectral data were plotted (Fig. 7), and it was observed that, for compound 4, the addition of F− ions first abstracted the H from NH to produce HF2−, which gives a 19F NMR peak at −150 ppm. A further increase in the concentration of F− ions resulted in one more peak at −110 ppm, which was due to the interaction of F− ions with sensor molecules.37 From the above experiment, we can conclude that with the increasing concentration of F− ions, two different electronic-environmental fluorides existed, one is HF2− and the other one is due to sensor-bound fluoride species. For another sensor, i.e., compound 9, a similar experiment was performed; the 10−2 M concentration of the sensor compound was fixed, and a 10−1 M F− ion solution was added to it gradually. The 19F NMR spectra were recorded after every addition of F− ions, and all the 19F NMR data were plotted. From the 19F NMR titration plot, for compound 9, the first peak appeared at −75 ppm; with the gradual addition of F− ions, another peak appeared in the 19F NMR spectra at −150 ppm. At a higher concentration of F− ions, both peaks at −75 ppm and −150 ppm existed in the 19F NMR spectra. This observation confirmed that sensor compound 9 first formed a complex with the analyte through a strong H-bonding interaction, which corresponded to the peak at −75 ppm, and then formed HF2− with the gradual addition of F− ions by abstracting H from the sensor molecule, which corresponded to the other peak at −150 ppm. Based on all the 19F NMR titration spectra, both monomeric sensors were found to result in a similar type of interaction (Fig. 7).
 |
| | Fig. 7
19F NMR titration spectra of (A) compound 4 (10−2 M); (B) compound 9 (10−2 M) with the addition of TBAF (1 M and 10−1 M as the stock solution) in DMSO-d6. | |
3.3 Job's plot
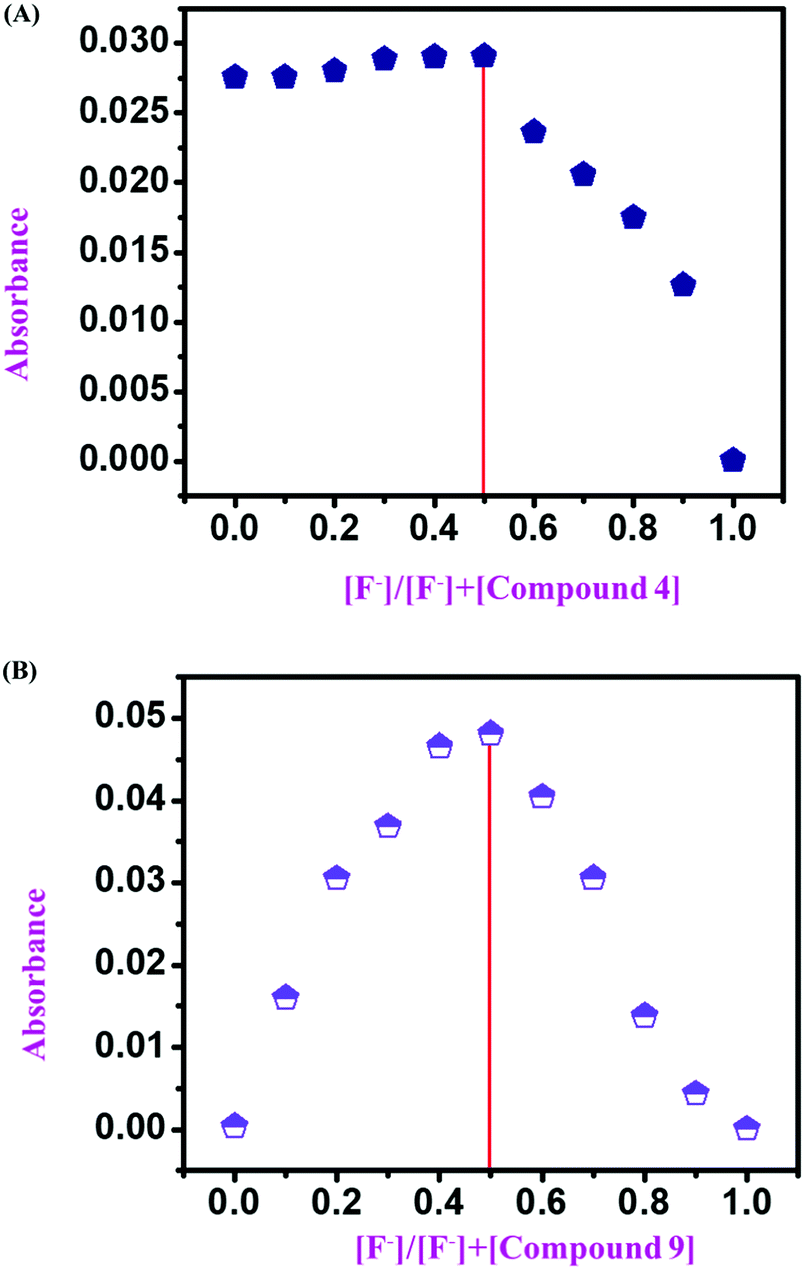
After confirmation of the sensing mechanism by UV-vis spectral analysis (both comparative and titration spectra), 1H NMR titration, and 19F NMR titration, we concluded the interaction mechanism for both monomeric sensors (compound 4 and compound 9) concerning F− ion concentration. For this, we considered both monomeric sensors’ concentration (10−4 and 10−3 M as stock) and analyte concentration (TBAF 10−4 M). Then, a series of samples was used for UV-vis spectral analysis by varying the mole fraction of both sensors and analyte in the range of 0 to 1. Then a UV-vis experiment was performed for every set of samples. After that, the UV-absorption data were plotted against the mole fraction of the F− ion to obtain a Job's plot. It was observed that at the anion mole fraction of 0.5, the absorption value for the sensor molecule was maximum. This value confirms that the monomeric sensors (compound 4 and compound 9) formed a 1:1 complex with the F− ion (10−4 M and 10−3 M) (Fig. 8).
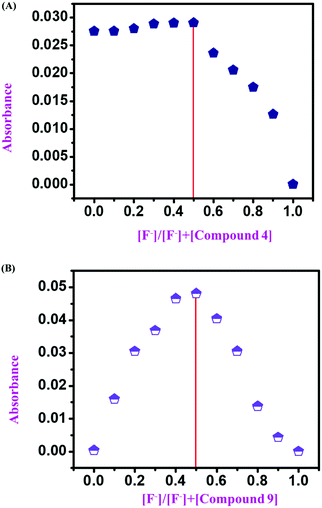 |
| | Fig. 8 Job's plot for (A) compound 4 and (B) compound 9. | |
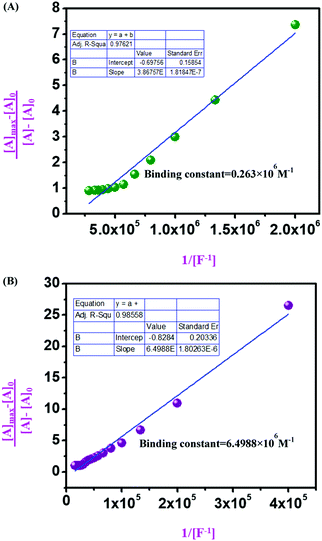
3.4 Binding constant and limit of detection (LOD)
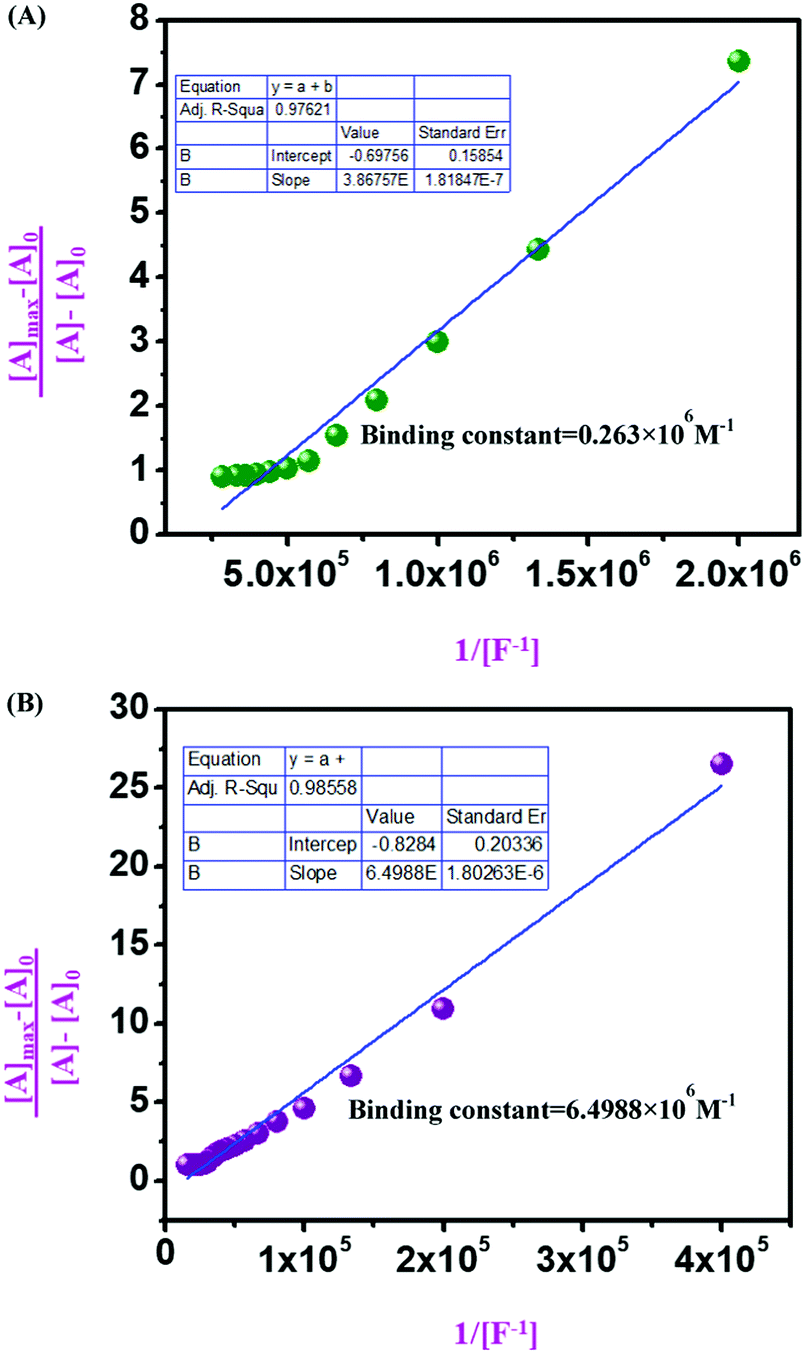
From UV-vis spectroscopic concentration-dependent analysis for compound 4 (2.5 × 10⁻⁶ M) and compound 9 (1.5 × 10⁻⁵ M), it was observed that with the increase in F− ion concentration, a ratiometric change occurred in the spectra. Absorbance maxima were shifted from λmax 405 nm to λmax 537 nm with the generation of an isosbestic point at λmax 444 nm and a drastic naked eye color change occurred from light yellow to dark pink. From the titration between sensor and analyte, the binding constant or association constant of sensors with the analyte was calculated by using the Benesi–Hildebrand equation. For calculating the binding constant, we considered the absorbance value of monomeric sensors at λmax 537 nm, which appeared with the gradual addition of F− ions (10−4 M and 10−3 M TBAF stock solutions). A linear fitting plot was obtained by plotting [Amax] − [A]0/[A] − [A0] versus 1/[F−], and the reciprocal value of the slope of that linear fitted plot was the binding constant for both sensors towards F− ions, where [A] is the absorbance of the sensor molecule at λmax 537 nm at a particular concentration of the F− ion, [A0] is absorbance at λmax 405 nm at that particular rF− ion concentration, and [Amax] is maximum absorbance at λmax 537 nm among all absorbance values at λmax 537 nm. From the Benesi–Hildebrand plot, the binding constant was 0.263 × 10⁶ M−1 for compound 4 and 6.4988 × 10⁶ M−1 for compound 9 (Fig. 9).
 |
| | Fig. 9 Benesi–Hildebrand diagram plotting absorption at λmax 537 nm for (A) compound 4; (B) compound 9 (in DMSO:H2O 9:1 v/v solution with Tris–HCl buffer at pH 7.4). | |
Furthermore, the corresponding absorbance vs. concentration of F− ions for compound 4 (2.5 × 10⁻⁶ M) (Fig. 10A), compound 9 (1.5 × 10⁻⁵ M) (Fig. 10B), and compound 11 (1 mg/2 mL solvent) (Fig. 10C) has been used for calculating the LOD. The limit of detection has been calculated using LOD = 3σ/k, where k is the slope of each linear plot for the mentioned sensors, and σ is the standard deviation of blank measurements. With this, the calculated LOD values for compound 4, compound 9, and compound 11 are 68.182 × 10⁻⁹ M, 72.341 × 10⁻⁹ M, and 18.98157 × 10⁻⁹ M, respectively.
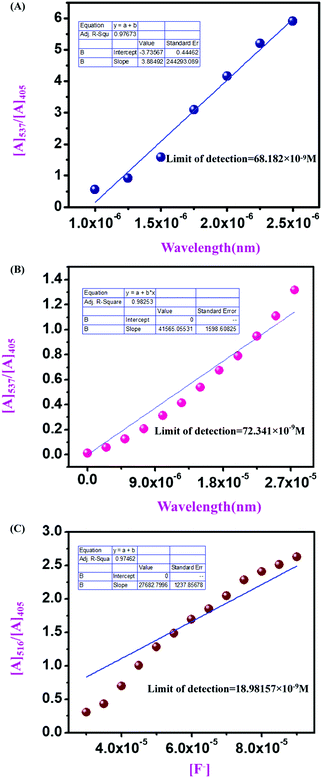 |
| | Fig. 10 Plots of A537/A406versus [F−] ranging from 1.0 × 10⁻⁶ M to 2.5 × 10⁻⁵ M for (A) (compound 4); (B) compound 9 (in DMSO:H2O 9:1, v/v solution with Tris–HCl buffer at pH 7.4). Plots of A516/A405versus [F−] ranging from 0 to 2.7 × 10⁻⁵ M and 8.0 × 10⁻⁵ M for (C) compound 11 (in DMSO:H2O 9:1, v/v solution with Tris–HCl buffer at pH 7.4). | |
4. Time-dependent analysis and real sample analysis
The response of the sensors towards F− ions was within 3 minutes for compound 4 (Fig. S24, ESI†), compound 9 (Fig. S25, ESI†), and compound 11 (Fig. S26, ESI†) from the UV-vis experiment. For real sample analysis, a F− ion-containing branded toothpaste was collected from a nearby supermarket. After that, 100 mg of that toothpaste was dissolved in 10 mL of HPLC grade water. Then the toothpaste solution was centrifuged for 30 min, and the residual solution was filtered down by syringe filtration. Then, a UV-vis spectroscopic analysis was performed using compounds 4, 9, and 11 with the toothpaste solution, respectively. For the analysis, compound 4 (2.5 × 10⁻⁶ M), compound 9 (1.5 × 10⁻⁵ M) and compound 11 were taken as 1 mg/2 mL DMSO:H2O 9:1 v/v, in Tris–HCl buffer of pH 7.4. To the solution of both monomeric and polymeric sensors of 100 μL, a toothpaste solution was added, and UV-vis analysis was done. In the recovery experiments, the spiked samples were obtained by adding standard solutions with varying F− ion concentrations into the toothpaste samples. The recovered F− ion concentration obtained from analysis was 1.2 × 10⁻⁶ M using compound 4 (Fig. S27, ESI†), 1.016 × 10⁻⁶ M using compound 9 (Fig. S28, ESI†), and 0.9213 × 10⁻⁶ M using compound 11 (Fig. S29, ESI†).
5. Mechanism of interaction of sensors with analyte
From all the above analytical studies, the interaction mechanism of all monomeric (compound 4 and compound 9) and polymeric sensors (compound 11) with F− ions was confirmed. The Job's plot confirms the 1:1 binding stoichiometry of the monomeric sensors with F− ions (Fig. 8). Then, 1H NMR and 19F NMR titrations confirmed the actual interaction mechanism (both strong H-bond formation and abstraction of H-atoms to produce HF2− species) of the sensors using the analyte (Fig. 6 and 7). As the F− ion is smaller in size among all the halides, and negative charge density is also high, this makes F− ions a hard base in nature. Due to that hard nature, it can abstract the H-atom (hard acid) from –NH groups of the sensors, simultaneously forming HF2− in the medium and generating negative charge on the molecules (all monomeric and polymeric sensors). This negative charge on all sensors acts as a donor site, and the electron-withdrawing –NO2 group of the DNPH moiety acted as an acceptor site. Due to the presence of donor and acceptor sites in the same sensor molecule, a strong ICT (intermolecular charge transfer) occurred from the negatively charged dense donor site (NH– group) to the electron-withdrawing acceptor site (NO2 group), which was confirmed by both 1H NMR and 19F NMR titration studies (Fig. 6 and 7).39 Also, in the presence of two 2,4-DNPH groups, a nice cavity was produced by the sensor molecules for F− ions only (as an acetate anion does not interfere with the F− ion). So, it can be concluded that both the species ([sensors + F− ion] and [sensors]2−) were present in the solution for all the sensors (compound 4, compound 9, and compound 11). The pictorial representation of the interaction mechanism for F− ions with the sensors is given below in Fig. 11.
 |
| | Fig. 11 Binding mechanism of fluoride and sensor compound 4 and compound 9. | |
6. Conclusion
In conclusion, the sensors were synthesized successfully and well-characterized by 1H NMR, 13CNMR, HRMS, and FTIR spectroscopies. All these sensors show a selective colorimetric response (from light yellow to dark pink) at a micromolar level in semi-aqueous medium with F− ions. The binding interaction with sensors was investigated by performing 1H NMR, 19F NMR, and UV-vis spectroscopic titrations. The analysis proved that the binding ratio was 1:1 (from the Job's plot) due to H-bonding interaction between the sensors and F− ions. The drastic color change from yellow to pink was due to H-atom abstraction by the probe and ICT from the N–H group, with the high electron-withdrawing nitro groups. Hence, we have successfully explained all the syntheses, analyses of monomeric and polymeric sensors, and the mechanism of interaction of the analyte with the sensors.
Abbreviations
| ICT | Intermolecular charge transfer |
| 2,4-DNPH | 2,4-Dinitrophenyl hydrazine |
Conflicts of interest
There are no conflicts to declare.
Acknowledgements
J. S. thanks the DBT for a research fellowship and T. S. thanks IISER-K for a research fellowship. R. S. acknowledges the DBT and the DST-SERB research project. The authors thank IISER-K for the infrastructure and all the facilities.
References
- D. A. Jose, S. Mishra, A. Ghosh, A. Shrivastav, S. K. Mishra and A. Das, Colorimetric sensor for ATP in aqueous solution, Org. Lett., 1979, 2007, 10 Search PubMed.
- S. Saha, A. Ghosh, P. Mahato, P. Misra, S. K. Mishra, E. Suresh, S. Das and A. Das, Specific Recognition and Sensing of CN− in Sodium Cyanide Solution, Org. Lett., 2010, 15, 34063 Search PubMed.
- D. Jose, D. K. Kumar, B. Ganguly and A. Das, Efficient and simple colorimetric fluoride ion sensor based on receptors having urea and thiourea binding sites, Org. Lett., 2004, 20, 3445 CrossRef.
- A. Maity, F. Ali, H. Agarwal, B. Anothumakkoolb and A. Das, Tuning of multiple luminescence output and white-light emission from a single gelator molecule through an ESIPT coupled AIEE process, Chem. Commun., 2015, 51, 2130 RSC.
- US EPA, National primary drinking water regulations, fluoride, final rule and the proposed rule, US Environmental protection Agency, Federal Register, 1985b, 50(220), 47142.
- A. Salifu, B. Petrusevski, K. Ghebremichael, R. Baumah and G. Amy, Multivariate statistical analysis for fluoride occurrences in groundwater in the northern region of ghana, J. Contam. Hydrol., 2012, 140–141, 34–44 CrossRef CAS.
- Exposure to inadequate or excess fluoride: a major public health concern (WHO, 2019), https://apps.who.int/iris/bitstream/handle/10665/329484/WHO-CED-PHE-EPE-19.4.5-eng.pdf?ua=1.
-
K. Brindha and L. Elango, in Fluoride in Groundwater: Causes, Implication, and Mitigation Measures, Fluoride Properties, Application and Environmental Management, ed. S. D. Monroy, 2011, p. 111 Search PubMed.
- H. P. Petrone, M. Giordano, S. Giustino and M. F. Guarino, Enduring Fluoride Health Hazard for the Vesuvius area population: The Case ofAD 79 Herculaneum, Endemic Fluorosis at Vesuvius, PLoS One, 2011, 6, 1 CrossRef.
- P. Das, M. K. Kesharwani, A. K. Mandal, E. Suresh, B. Ganguly and A. das, An alternative approach: a highly selective dual responding fluoride sensor having active methylene group as a binding site, Org. Biomol. Chem., 2012, 10, 2263 RSC.
- S. Roy, A. Maity, N. Mudi, M. Shyamal and A. Mishra, Rhodamine scaffolds as real-time chemosensors for selective detection of bisulfite in an aqueous medium, Photochem. Photobiol. Sci., 2019, 18, 1342 RSC.
- Y. Jo, N. Chidalla and D. Cho, Bis-ureidoquinoline as a Selective Fluoride Anion Sensor through Hydrogen-Bond Interaction, J. Org. Chem., 2014, 79, 9418 CrossRef CAS.
- D. E. Gomez, L. Fabbrizzi and M. Licchelli, Why, on Interaction of Urea-Based Receptors with Fluoride, Beautiful Colors Develop, J. Org. Chem., 2005, 70, 5717 CrossRef.
- M. Shyamal, P. Mazumdar, S. Maity, S. Samanta, G. P. Sahoo and A. Misra, Highly Selective Turn-On Fluorogenic Chemosensor for Robust Quantification of Zn(2) Based on Aggregation Induced Emission Enhancement Feature, ACS Sens., 2016, 6, 739 CrossRef.
- X. Cao, W. Lin, Q. Yu and J. Wang, Ratiometric sensing of fluoride anions based on a BODIPY-coumarin platform, Org. Lett., 2011, 22, 6098 CrossRef.
- S. Sarkar and R. Shunmugam, Unusual redshift of the sensor while detecting the presence of Cd2+ in the aqueous environment, ACS Appl. Mater. Interfaces, 2013, 5, 7379 CrossRef CAS.
- I. S. Turan and E. U. Akkaya, Chemiluminescence Sensing of Fluoride Ions Using a Self-Immolative Amplifier, Org. Lett., 2014, 16, 1680 CrossRef CAS.
- P. Thiampanya, N. Muangsin and B. Pulpoka, Azocalix[4] arene Strapped Calix[4]pyrrole: A Confirmable Fluoride Sensor, Org. Lett., 2012, 14, 4050 CrossRef CAS.
- M. Thakeuchi, T. Shioya and T. M. Swager, Allosteric Fluoride Anion Recognition by a Doubly Strapped Porphyrin, Angew. Chem., Int. Ed., 2001, 40, 3372 CrossRef.
- J. M. Stauber, G. E. Alliger, D. G. Nocera and C. C. Cummins, Second-Coordination-Sphere Assisted Selective Colorimetric Turn-on Fluoride Sensing by a Mono-Metallic Co(II) Hexacarboxamide Cryptand Complex, Inorg. Chem., 2017, 56, 7615 CrossRef CAS.
- H. Aboubakr, H. Brisset, O. Siri and J. Raimundo, Highly Specific and Reversible Fluoride Sensor Based on an Organic Semiconductor, Anal. Chem., 2013, 85, 9968 CrossRef CAS.
- A. S. Oshchepkov, T. A. Shumilova, S. R. Namashivaya, O. A. Fedorova, P. V. Dorovatovskii, V. N. Khrustalev and E. A. Kataev, Hybride Macrocycles for Selective Binding and Sensing of Fluoride in Aqueous Solution, J. Org. Chem., 2018, 83, 2145 CrossRef CAS.
- P. A. Gale and C. Caltagirone, Anion sensing by small molecules and molecular ensemble, Chem. Soc. Rev., 2015, 44, 4212 RSC.
- R. Kaushik, R. Sakla, A. Ghosh, G.t. Selvan, P. M. Selvakumar and D. A. Jose, Selective Detection of H2S by Copper Complex Embedded in Vesicles Through Metal Indicator Displacement Approach, ACS Sens., 2018, 3, 1142 CrossRef CAS.
- R. Shunmugam, G. J. Gabriel, C. E. Smith, K. A. Aamer and G. N. Tew, A Highly Selective Colorimetric Aqueous Sensor for Mercury, Chem. – Eur. J., 2008, 14, 3904 CrossRef CAS.
- S. Bhattacharya, S. Sarkar and R. Shunmugam, Unique norbornene polymer-based “in-field” sensor for As(III), J. Mater. Chem. A, 2013, 1, 8398 RSC.
- S. D. Starner, S. Arungundram and C. H. Saunders, Anion sensors based on b,b′-disubstituted porphyrin derivatives, Tetrahedron Lett., 2002, 43, 7785 CrossRef.
- R. Sivakumar, V. Reena, N. Anathi, M. Babu, S. Anandan and S. Velmathi, Colorimetric and fluorescence sensing of fluoride anion with potential salisaldimine based Schiff base receptor, Spectrochim. Acta, Part A, 2010, 75, 1146 CrossRef.
- A. Sahana, A. Banerjee, S. Lohar, S. Panja, S. K. Mukhopadhyay, J. S. Matalobos and D. Das, Fluorescence sensing of arsenate at a nanomolar level in a greener way: a naphthalene-based probe for living cell imaging, Chem. Commun., 2013, 49, 7231 RSC.
- J. F. Lamere, N. Saffon, I. D. Santos and S. F. Forgues, Aggregation-induced emission enhancement in organic ion pairs, Langmuir, 2010, 26, 10210 CrossRef CAS.
- G. J. Mao, T. T. Wei, X. X. Wang, S. Y. Huan, D. Q. Lu, J. Zhang, X. B. Zhang, W. H. Tan, G. I. Shen and R. Q. Yu, High-Sensitivity Naphthalene-Based Two-Photon Fluorescent Probe Suitable for Direct Bioimaging of H2S in Living Cells, Anal. Chem., 2013, 85, 7875 CrossRef CAS.
- Y. Zhou, J. F. Zhang and J. Yoon, Fluorescence and colorimetric chemosensors for fluoride-ion detection, Chem. Rev., 2014, 114, 5511 CrossRef CAS.
- K. B. Wiberg and D. J. Rush, Solvent Effect on the Thioamide Rotational Barrier: An Experimental and Theoretical Study, J. Am. Chem. Soc., 2001, 123, 2038 CrossRef CAS.
- E. W. Seo, J. H. Han, C. H. Heo, J. H. Shin, H. M. Kim and B. R. Chao, A Small-Molecule Two-Photon Probe for Nitric Oxide in Living Tissues, Chem. – Eur. J., 2012, 18, 12388 CrossRef CAS.
- Z. Dai, L. Tian, B. Song, X. L. Lui and J. L. Yuan, Development of a novel lysosome-targetable time-gated luminescence probe for ratiometric and luminescence lifetime detection of nitric oxide in vivo, Chem. Sci., 2017, 8, 1969 RSC.
- C. G. Dai, J. L. Wang, Y. L. Fu, H. P. Zhou and Q. H. Song, Selective and Real-Time Detection of Nitric Oxide by a Two-Photon Fluorescent Probe in Live Cells and Tissue Slices, Anal. Chem., 2017, 89, 10511 CrossRef CAS.
- D. A. Jose, P. Kar, D. Koley, B. Ganguly, W. Thiel, H. N. Ghosh and A. Das, Fluoride Ion Receptor Based on Dipyrrolyl Derivatives Bearing Electron-Withdrawing Groups: Synthesis, Optical, and Electrochemical Sensing and Computational Studies, Inorg. Chem., 2007, 46, 5576 CrossRef CAS.
- R. Pegu, R. Mandal, A. K. Guhab and S. Pratihar, A selective ratiometric fluoride ion sensor with a (2,4-dinitrophenyl) hydrazine derivative of bis(indolyl) methane and its mode of interaction, New J. Chem., 2015, 39, 5984 CAS.
- L. K. Kumawat, A. A. Abogunrin, M. Kickham, J. Pardeshi, O. Fenelon, M. Schroeder and R. B. P. Elmes, Squaramide-Napthalimide Conjugates as ‘Turn-On’ Fluorescent Sensors for Bromide Through an Aggregation-Disaggregation Approach, Front. Chem., 2019, 7, 354 CrossRef CAS.
- A. Aydogan, A. Koca, M. K. Sener and J. L. Sessler, EDOT-functionalized calix [4] pyrrole for the electrochemical sensing of fluoride in water, Org. Lett., 2014, 16, 3764 CrossRef CAS.
- D. A. Jose, D. K. Kumar, B. Ganguly and A. Das, Efficient and simple colorimetric fluoride ion sensor based on receptor having urea and thiourea binding sites, Org. Lett., 2004, 6, 3445 CrossRef CAS.
- H. Tong, L. Wang, X. Jing and F. Wang, “TURN-ON” conjugated polymer fluorescent chemosensor for fluoride ion, Macromolecules, 2003, 36, 2584 CrossRef CAS.
- H. A. Benesi and J. H. Hilderbrand, A Spectrophotometric Investigation of the Interaction of Iodine with Aromatic Hydrocarbon, J. Am. Chem. Soc., 1949, 71, 2703 CrossRef CAS.
- D. Sharma, S. K. Sahoo, S. Chaudhary, R. K. Bera and J. F. Challan, Fluorescence ‘turn-on’ sensor for F− derivative from vitamin B6 cofactor, Analyst, 2013, 138, 3646 RSC.
- S. K. Sahoo, G. D. Kimb and H. G. Choi, Optical sensing of anions using C3v-symmetric tripodal receptors, J. Photochem. Photobiol., C, 2016, 27, 30–53 CrossRef CAS.
Footnote |
| † Electronic supplementary information (ESI) available. See DOI: 10.1039/d0ma00092b |
|
| This journal is © The Royal Society of Chemistry 2020 |
Click here to see how this site uses Cookies. View our privacy policy here. 
 Open Access Article
 This Open Access Article is licensed under a
  *
*