 Open Access Article
FeNiMo trimetallic nanoparticles encapsulated in carbon cages as efficient hydrogen evolution reaction electrocatalysts†
Ziqi
Zhang
a,
Linchuan
Cong
a,
Zhuochen
Yu
a,
Lina
Qu
a,
Miaomiao
Qian
a and
Weimin
Huang
 *ab
*ab
aCollege of Chemistry, Jilin University, Changchun 130012, China. E-mail: huangwm@jlu.edu.cn; Tel: +86-431-80561579
bKey Laboratory of Physics and Technology for Advanced Batteries of Ministry of Education, Jilin University, Changchun 130012, China
First published on 12th March 2020
Abstract
Hydrogen is one of the most desirable alternatives to fossil fuels due to its renewability and large energy density. The electrocatalytic hydrogen evolution reaction (HER) is drawing more and more attention since it can produce H2 powered by renewable energy. Therefore, efficient and durable electrocatalysts are an urgent need. On the one hand, the high price and low reserve of noble metals hinder their further applications. On the other hand, various non-noble metal electrocatalysts cannot achieve satisfactory stability and efficiency. Thus, this paper reports a cheap and feasible way to synthesize a carbon cage-encapsulated FeNiMo compound. It exhibits the desired overpotentials of 199 mV at 10 mA cm−2 in an alkaline solution and 246 mV at 10 mA cm−2 in an acidic solution. Besides, it exhibits similar current density loss to commercial Pt/C after 10![[thin space (1/6-em)]](https://www.rsc.org/images/entities/char_2009.gif) 000 CV cycles, which suggests satisfactory durability.
000 CV cycles, which suggests satisfactory durability.
1. Introduction
The increasing greenhouse effect has aroused increasing attention towards renewable energy source conversion and storage.1 Hydrogen is considered as one of the most desirable alternatives to fossil fuels.2 The electrocatalytic hydrogen evolution reaction (HER) can produce H2 powered by renewable energy, including solar or wind energy.3,4 In order to drive HER with a lower overpotential, efficient and durable electrocatalysts are an urgent need.5 Although noble metals such as Pt, Ir and Ru are used as mainstream electrocatalysts, their high cost and low abundance hinder their further applications.6 Therefore, the use of low-cost and earth-abundant electrocatalysts to replace noble metal catalysts is necessary.7–9 Recently, many transition metals and their compounds have been used as non-noble electrocatalysts, including transition metal oxides,10 sulfides,11–14 phosphides,15–20 carbides,21 and nitrides.22 Among them, the compounds based on Co, Fe and Ni are most frequently used as electrocatalysts for HER due to their low cost and deficient 3d electron structures.23–25 However, due to their weak electronic conductivity and stability, the electrocatalysts based on Fe, Ni and Co are still not able to compete with noble-metal-based electrocatalysts.26 Therefore, we aim to solve these issues in two ways. First, we can establish unique carbon nanostructures, such as carbon nanotubes27 and graphene,28 to enhance the conductivity and stability morphologically. Second, we can combine the metals (Mo) on the left half of the transition metals in the periodic table with the metals (Fe and Ni) on the right half of the series with more filled d-bands, which can build well-pronounced synergism in electrocatalysis.29In this paper, we report a new Fe, Ni and Mo trimetallic compound encapsulated in a carbon cage as an efficient HER electrocatalyst. This material was synthesized by a two-step hydrothermal reaction at room temperature and one-step direct carbonization, which is facile, low-cost and environmentally friendly. It exhibits the desired overpotentials of 199 mV at 10 mA cm−2 in an alkaline solution and 246 mV at 10 mA cm−2 in an acidic solution. Besides, it has satisfactory durability, which is better than that of a commercial Pt/C catalyst.
2. Experimental section
2.1. Reagents
Potassium ferricyanide (K3[Fe(CN)6], analytical reagent), potassium ferrocyanide trihydrate (K4[Fe(CN)6]·3H2O, analytical reagent), sodium citrate (Na3C6H5O7, 99%), ethyl alcohol (C2H5OH, ≥99.8%), sulfuric acid (H2SO4, 98%) and potassium hydroxide (KOH, 96%) were obtained from Beijing Chemical Works. Nickel nitrate hexahydrate (Ni(NO3)2·6H2O, 98%) and ammonium molybdate tetrahydrate (H24Mo7N6O24·4H20) were obtained from Aladdin. Pt/C (20 wt%, JM), Nafion (5.0 wt%, Dupont), and N2 gas (99.99%) were also employed. All chemical reagents were used as received without further purification. All aqueous solutions were prepared with ultrapure water (resistivity of 18.25 MΩ cm).2.2. Physical characterization
Scanning electron microscopy (SEM) was performed on a HITACHI SU020 microscope. Transmission electron microscopy (TEM) and elemental mapping were performed on an FEI Tecnai G20/JEM2010 microscope. X-ray photoelectron spectra (XPS) were recorded on a Thermo ESCALAB 250Xi with an excitation source of Al Kα radiation. X-ray diffraction (XRD) patterns were carried out using an Empyrean (PANalytical B.V.) with a Cu Kα radiation source (λ1 = 1.5406 Å) operating at 40.0 kV and 40.0 mA, and the diffraction data were recorded in the 2θ range of 5–80° with a scan rate of 4 degrees per min.2.3. Preparation of Fe3+NiMoC
In a typical procedure,30 0.6 mmol of nickel nitrate and 0.9 mmol of sodium citrate were dissolved in 20 mL of deionized (DI) water to form solution A, and 0.4 mmol of potassium ferricyanide was dissolved in another 20 mL of DI water to form solution B. Solutions A and B were then mixed under stirring for 1 min. The obtained mixed solution was aged for 18 h at room temperature. The mixed solution was centrifuged and washed several times with DI water and dried in a vacuum overnight at 60 °C to obtain the Fe–Ni Prussian blue analogue (Fe3+Ni-PBA). In addition, 0.4 mmol of ferrocyanide trihydrate was used to take the place of 0.4 mmol of potassium ferricyanide and the product was named Fe2+Ni-PBA.Next, 200 mg of Fe3+Ni-PBA was dissolved in 10 ml of DI water, which was subsequently injected into 10 ml of DI water containing 200 mg of ammonium molybdate tetrahydrate. The mixed solution was then stirred for 24 h at room temperature, centrifuged with DI water several times and dried overnight in a vacuum at 60 °C to get Fe, Ni and Mo compounds named Fe3+NiMo. In addition, Fe2+Ni-PBA was treated in the same way to get Fe2+NiMo. The precipitate (Fe2+NiMo or Fe3+NiMo) was heated at 800 °C for 4 h at a rate of 3 °C min−1 in a tube furnace and in N2 atmosphere to obtain the carbide of FeNiMo compounds. The final products were named Fe3+NiMoC or Fe2+NiMoC, respectively. As control groups, Fe2+Ni-PBA and Fe3+Ni-PBA were heated under the same conditions as above to get the corresponding carbonization products, which were named Fe2+Ni-PBAC and Fe3+Ni-PBAC, respectively.
2.4. Cathode preparation
Briefly, 5 mg of (Fe2+Ni-PBAC, Fe3+Ni-PBAC, Fe2+NiMoC, Fe3+NiMoC or Pt/C (20 wt%)) was dispersed in 240 μL of a mixed solution of ethyl alcohol, 240 μL of ultrapure water and 20 μL of 5 wt% Nafion and ultrasonicated for 10 min. Next, 5 μL of liquid was pipetted onto the surface of a glassy carbon electrode (GCE, 3 mm) (loading ∼0.7077 mg cm−2) and allowed to dry naturally. The modified GCE served as the working electrode.2.5. Electrochemical measurements
Electrochemical measurements were performed using a CHI 660E electrochemical workstation with a three-electrode system that included a working electrode (GCE), a counter electrode (Pt foil, 1 × 1 cm2) and a reference electrode (Hg/HgO, 1 M KOH electrolyte) in 1 M KOH solution, or a Hg/Hg2SO4 (saturated K2SO4 electrolyte) electrode in 0.5 M H2SO4 solution. The experimental potential values were calibrated by using the following equation: E vs. RHE = E vs. Hg/HgO + 0.098 + 0.059 pH; E vs. RHE = E vs. Hg/Hg2SO4 + 0.616 + 0.059 pH. Before the test, N2 flow (20 mL min−1) was continuously fed to the cathode through the electrolyte in the cell for 30 min. The linear sweep voltammetry (LSV) experiments were performed at a scan rate of 10 mV s−1 from 0.2 to −0.7 V (vs. RHE) in N2-saturated 0.5 M H2SO4 or 1 M KOH solution, respectively. Electrochemical impedance spectra (EIS) measurements were performed at an overpotential of 300 mV (vs. RHE) with frequencies from 0.1 to 100![[thin space (1/6-em)]](https://www.rsc.org/images/entities/char_2009.gif) 000 Hz and an amplitude of 5 mV. The electrochemically active surface area (ECSA) was estimated by CVs and was tested from −0.80 to −0.70 V (vs. Hg/HgO) with a scan rate from 10 to 100 mV s−1 in N2-saturated 1 M KOH, or tested from −0.65 to −0.55 V (vs. Hg/Hg2SO4) with a scan rate from 10 to 100 mV s−1 in N2-saturated 0.5 M H2SO4. Durability cyclic voltammetry (CV) tests were conducted from −0.4 to 0 V (vs. RHE) in N2-saturated 0.5 M H2SO4 or 1 M KOH solution with the scan rate of 100 mV s−1 for 10
000 Hz and an amplitude of 5 mV. The electrochemically active surface area (ECSA) was estimated by CVs and was tested from −0.80 to −0.70 V (vs. Hg/HgO) with a scan rate from 10 to 100 mV s−1 in N2-saturated 1 M KOH, or tested from −0.65 to −0.55 V (vs. Hg/Hg2SO4) with a scan rate from 10 to 100 mV s−1 in N2-saturated 0.5 M H2SO4. Durability cyclic voltammetry (CV) tests were conducted from −0.4 to 0 V (vs. RHE) in N2-saturated 0.5 M H2SO4 or 1 M KOH solution with the scan rate of 100 mV s−1 for 10![[thin space (1/6-em)]](https://www.rsc.org/images/entities/char_2009.gif) 000 segments and the differences in the LSV curves before and after CVs were compared.
000 segments and the differences in the LSV curves before and after CVs were compared.
3. Results and discussion
3.1 Physical characterization
SEM was used to observe the morphologies of the samples before carbonization. As shown in Fig. 1a and b, the Fe2+Ni-PBA has irregular aggregation while the Fe3+Ni-PBA is made of independent cubic nanocrystals. The addition of ammonium molybdate tetrahydrate made the Fe2+Ni-PBA particles stick together (Fig. 1c) while most of the Fe3+Ni-PBA cubes remained uniform and independent after mixing (Fig. 1d), which allowed them to form dispersive nanoparticles after carbonization (Fig. 2a), thus enlarging the surface area and increasing the number of active sites.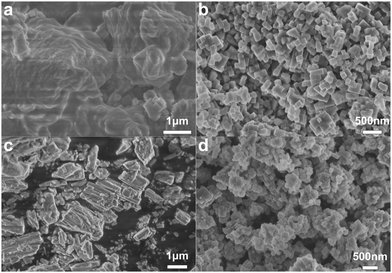 | ||
| Fig. 1 SEM images of Fe2+Ni-PBA (a), Fe3+Ni-PBA (b), Fe2+NiMo (c), and Fe3+NiMo (d) before carbonization. | ||
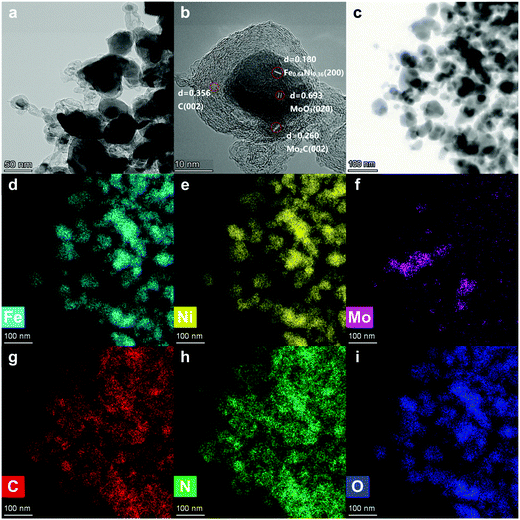
In Fig. 2a, the metallic nanoparticles are surrounded by graphitic layers that can serve as a “cage”, encapsulating the metallic compounds inside. These carbon cages are connected by carbonized tubes made from N-doped carbon (Fig. 2g and h).
In order to investigate the morphology of the single carbon cage, high-resolution TEM was carried out. In Fig. 2b, the Fe, Ni and Mo compounds, including Fe0.64Ni0.36, Mo2C and MoO3, are wrapped by the graphitic layers. The graphitic layers can serve as a carbon cage and encapsulate the Fe, Ni and Mo compounds inside, which can protect the active sites from the environment. The graphitic layers can also serve as a desirable electron transport medium due to its excellent conductivity. Thus, the graphitic layer structure can enhance the durability and improve the catalytic efficiency at the same time. Besides, the graphitic layers were not oriented parallel to the axis and showed considerable defects and edges on the surface,31 which can improve the surface affinity for H+ in the solution.
The XRD pattern of Fe3+NiMoC is shown in Fig. 3a. The typical peak at ≈25° indicates the (002) face of graphite carbon, which is characteristic of the carbon framework. The diffraction peaks at 43.6°, 50.8°, and 74.7° can be indexed to the (111), (200), and (220) planes of Fe0.64Ni0.36, and the peaks at 34.3°, 37.9°, 39.3°, 52.1°, 61.4°, 69.5°, 72.3°, 74.5° and 75.5° can be assigned to the (021), (200), (121), (221), (040), (321), (042), (240) and (142) planes of Mo2C.32
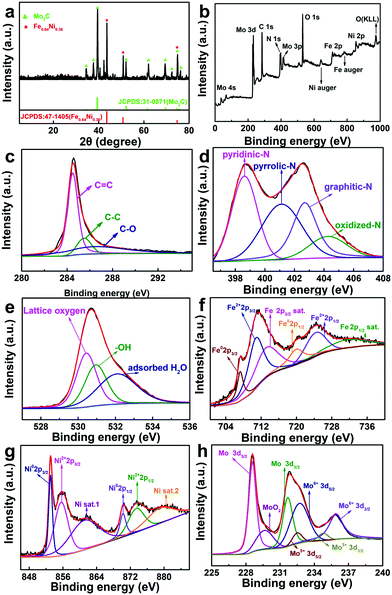 | ||
| Fig. 3 XRD pattern (a), XPS survey spectrum (b) and the corresponding high-resolution spectra (c–h) of Fe3+NiMoC. | ||
In order to investigate the compound surface including the chemical composition and element bonding configurations, X-ray photoelectron spectroscopy (XPS) was carried out for Fe3+NiMoC. As shown in Fig. 3b, the existence of C, N, O, Fe, Ni and Mo with the atomic contents of C-43.15%, N-22.47%, O-20.15%, Fe-3.75%, N-2.16% and Mo-8.32% was confirmed. In the C 1s spectra (Fig. 3c), the peaks were observed at 284.5, 285.5, and 286.5 eV, which can be ascribed to C![[double bond, length as m-dash]](https://www.rsc.org/images/entities/char_e001.gif) C, C–C and C–O, respectively.33,34Fig. 3d shows the high-resolution spectrum of N 1s, which presents 4 types of N coordination environments at 398.6 eV for pyridinic-N, 400.3 eV for pyrrolic-N, 401.1 eV for graphitic-N and 402.7 eV for oxidized-N.35,36 Meanwhile, the N content was determined to be 3.94 at%, which suggests that N atoms have been successfully doped into the carbon network. N doping in the porous carbon is beneficial for stabilizing metallic Fe, Ni and Mo as well as their compounds. In the meantime, it can regulate the electronic structure and surface permeability of catalyst.5 The O 1s spectrum in Fig. 3e contains three peaks at 530.4
C, C–C and C–O, respectively.33,34Fig. 3d shows the high-resolution spectrum of N 1s, which presents 4 types of N coordination environments at 398.6 eV for pyridinic-N, 400.3 eV for pyrrolic-N, 401.1 eV for graphitic-N and 402.7 eV for oxidized-N.35,36 Meanwhile, the N content was determined to be 3.94 at%, which suggests that N atoms have been successfully doped into the carbon network. N doping in the porous carbon is beneficial for stabilizing metallic Fe, Ni and Mo as well as their compounds. In the meantime, it can regulate the electronic structure and surface permeability of catalyst.5 The O 1s spectrum in Fig. 3e contains three peaks at 530.4 ![[thin space (1/6-em)]](https://www.rsc.org/images/entities/char_2009.gif) eV, 531.0
eV, 531.0 ![[thin space (1/6-em)]](https://www.rsc.org/images/entities/char_2009.gif) eV and 532.1
eV and 532.1 ![[thin space (1/6-em)]](https://www.rsc.org/images/entities/char_2009.gif) eV belonging to lattice oxygen, –OH groups and adsorbed H2O, respectively. These three peaks all shifted to high binding energies compared to pure MoO3,37 suggesting that electrons were transferred from the oxygen of MoO3 to Ni, which decreased the electron cloud density of oxygen. Therefore, the binding energies changed and partial oxygen vacancies were formed.38,39 In Fig. 3f and g, the Fe02p and Ni02p peaks can be ascribed to the Fe3+ and Ni2+ ions being reduced to Fe0.64Ni0.36 at high temperature. The Fe2+2p and Ni2+2p peaks may belong to the coordination center of N-doped carbon. In addition, the Fe and Ni satellite peaks can be ascribed to the formation of the iron carbide and the spinel structure NiFe2O4,40,41 which were possibly produced by calcining the Fe3+, Ni2+ and sodium citrate at high temperatures and both have been reported to be excellent active centres toward the HER.31 In Fig. 3h, the Mo 3d peaks at 232.7
eV belonging to lattice oxygen, –OH groups and adsorbed H2O, respectively. These three peaks all shifted to high binding energies compared to pure MoO3,37 suggesting that electrons were transferred from the oxygen of MoO3 to Ni, which decreased the electron cloud density of oxygen. Therefore, the binding energies changed and partial oxygen vacancies were formed.38,39 In Fig. 3f and g, the Fe02p and Ni02p peaks can be ascribed to the Fe3+ and Ni2+ ions being reduced to Fe0.64Ni0.36 at high temperature. The Fe2+2p and Ni2+2p peaks may belong to the coordination center of N-doped carbon. In addition, the Fe and Ni satellite peaks can be ascribed to the formation of the iron carbide and the spinel structure NiFe2O4,40,41 which were possibly produced by calcining the Fe3+, Ni2+ and sodium citrate at high temperatures and both have been reported to be excellent active centres toward the HER.31 In Fig. 3h, the Mo 3d peaks at 232.7 ![[thin space (1/6-em)]](https://www.rsc.org/images/entities/char_2009.gif) eV and 235.8
eV and 235.8 ![[thin space (1/6-em)]](https://www.rsc.org/images/entities/char_2009.gif) eV are assigned to Mo6+ 3d5/2 and Mo6+ 3d3/2 of MoO3 produced by the thermal decomposition of ammonium molybdate.42 Mo5+ peaks (232.5
eV are assigned to Mo6+ 3d5/2 and Mo6+ 3d3/2 of MoO3 produced by the thermal decomposition of ammonium molybdate.42 Mo5+ peaks (232.5![[thin space (1/6-em)]](https://www.rsc.org/images/entities/char_2009.gif) eV and 234.8
eV and 234.8![[thin space (1/6-em)]](https://www.rsc.org/images/entities/char_2009.gif) eV) reveal the formation of oxygen vacancies due to the substitution of Ni and Fe atoms for Mo atoms in MoO3 lattice.43
eV) reveal the formation of oxygen vacancies due to the substitution of Ni and Fe atoms for Mo atoms in MoO3 lattice.43
In the XRD patterns, Mo2C has the highest content among the Mo compounds while XPS indicates that the oxide of Mo dominates. This is mostly because XRD studies the bulk phase while XPS focuses on the surface; i.e., Fe3+NiMoC is mainly made up of Fe064Ni036 and Mo2C with the surface oxidation of Mo. In general, the N-doped carbon network established by carbonizing Fe3+Ni-PBA can serve as a conductive fundamental base to tightly immobilize carbon cages. The carbon cages can form a natural barrier to keep metallic active sites inside from being damaged by the environment. The low oxygen coordinated defect sites in the Fe, Ni and Mo compounds can serve as the HER active center, thus enhancing the electrocatalytic activity.30,44,45
3.2 HER catalytic activities in acidic solution
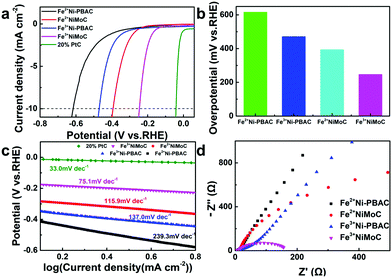
The HER catalytic performance was firstly tested in 0.5 M H2SO4. As seen in Fig. 4a and b, Fe3+Ni-PBAC (471 mV vs. RHE) and Fe3+NiMoC (246 mV vs. RHE) showed lower overpotentials as compared to Fe2+Ni-PBAC (616 mV vs. RHE) and Fe2+NiMoC (393 mV vs. RHE) at 10 mA cm−2, respectively, which suggests that the electrocatalysts synthesized by Fe3+ have better catalytic activity toward the HER. This is probably due to the uniform and independent catalytic units providing a larger surface area and more active sites. On the other hand, Fe2+NiMoC and Fe3+NiMoC showed lower overpotentials (393 mV and 246 mV vs. RHE) compared to the Fe2+Ni-PBAC and Fe3+Ni-PBAC (616 mV and 417 mV vs. RHE) at 10 mA cm−2, respectively, which indicates that the addition of Mo and its compounds can enhance the catalytic efficiency toward the HER. This is consistent with the results of a previous report.46 For comparison, the 20% Pt/C was tested in the same way and showed an overpotential of 42 mV (vs. RHE) (Fig. 3a).To gain insight into the kinetics and mechanism for the HER, the Tafel plots derived from the corresponding polarization curves are presented in Fig. 4c. The Fe3+NiMoC displays a Tafel slope of −75.1 mV dec−1 compared to Pt/C catalyst (−33.0 mV dec−1). The Tafel slope is an intrinsic property of the electrocatalytic HER activity, which is related to the rate-determining step of the HER. A lower Tafel slope shows better HER kinetics.47 In the aqueous electrolyte, H+ ions obtained electrons to form H atoms and were adsorbed on the surface of the working electrode (Volmer reaction, H3O+ + e− → Hads),48 followed by either an electrochemical desorption step (Heyrovsky reaction, Hads + H3O+ + e− → H2) or a chemical desorption step (Hads + Hads → H2) to form hydrogen molecules.5 The theoretical Tafel slopes of the Volmer, Heyrovsky and Tafel reactions are −120, −40 and −30 mV dec−1, respectively. The Tafel slope of the Fe3+NiMoC was −75.1 mV dec−1, which is a Volmer–Heyrovsky mechanism with the Heyrovsky step is the rate-determining step.48 In order to study the charge transfer resistances of these 4 samples, the electrochemical impedance spectra were employed. Fig. 4d is the EIS of Fe2+Ni-PBAC, Fe3+Ni-PBAC, Fe2+NiMoC and Fe3+NiMoC at −0.3 V (vs. RHE). The Fe3+NiMoC has the minimum charge transfer resistance and thus promotes the kinetics of the HER. Besides, the charge transfer resistances and Tafel slopes, Fe3+NiMoC < Fe2+NiMoC < Fe3+Ni-PBAC < Fe2+Ni-PBAC, which is consistent with the trend of the HER overpotentials mentioned above (Fig. 4a and b).
3.3 HER catalytic activities in alkaline solution
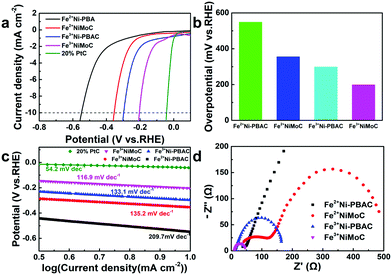
The HER catalytic performance was also tested in 1 M KOH. As shown in Fig. 5b and c, Fe3+NiMoC exhibits the smallest Tafel slope and overpotential (116.9 mV dec−1, 199 mV) of all samples (Fe3+Ni-PBAC(133. 1 mV dec−1, 298 mV), Fe2+NiMoC(135.2 mV dec−1, 355 mV), Fe2+Ni-PBAC(209.7 mV dec−1, 548 mV)) except for the commercial Pt/C catalyst (54.2 mV dec−1, 43 mV), which suggests that the HER kinetics of Fe3+NiMoC is favorable and the current density of Fe3+NiMoC will increase faster as the potential becomes more negative. EIS spectra are also shown in Fig. 5d, illustrating that Fe3+NiMoC has the smallest intrinsic resistance and charge transfer resistance, which facilitates the kinetics towards the HER, too.It is worth noting that in alkaline solution (1 M KOH), the order of catalytic efficiency is as follows: Fe3+NiMoC > Fe3+Ni-PBAC > Fe2+NiMoC > Fe2+Ni-PBAC. However, in acidic solution (0.5 M H2SO4), the order is Fe3+NiMoC > Fe2+NiMoC > Fe3+Ni-PBAC > Fe2+Ni-PBAC. In other words, the Fe3+Ni-PBAC shows a better catalytic effect in alkaline solution while the Fe2+NiMoC is better in the acidic solution. This is probably because in acidic solution, the desorption of H2 (Hads + Hads → H2) is the rate-determining step due to the abundant H+ environment, and the Fe2+NiMoC has a weaker adsorption capacity toward Hads so it exhibits a better catalytic effect than Fe3+Ni-PBAC. When it comes to the alkaline solution, the adsorption of H+ (H3O+ + e− → Hads) is the rate-determining step on account of the lack of H+. Therefore, the independent catalytic units and larger surface area led to Fe3+Ni-PBAC demonstrating preferable catalytic performance in alkaline solution.
3.4 Durability and activities of electrocatalyst
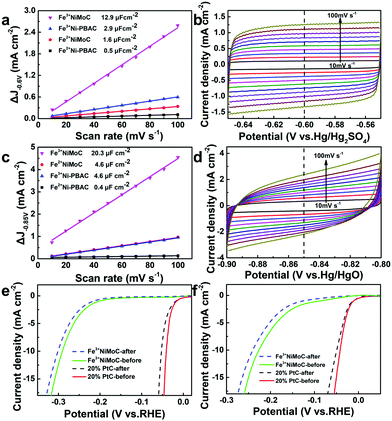
The ECSA was estimated by CVs with the equation ECSA = Cdl/Cs (where Cdl is the double layer capacitance, Cs is the capacitive behavior). The larger ECSA means more active sites.49 Since the Cs of Fe3+NiMoC is unknown, we can estimate the ECSA by comparing the value of Cdl; Cdl can be calculated from the slope of the ΔJ-scan rate line.50 The CV was firstly tested from −0.65 to −0.55 V (vs. Hg/Hg2SO4) with scan rates from 10 to 100 mV s−1 in 0.5 M H2SO4 (Fig. 6a and b). Cdl was calculated with ΔJ − 0.60 V (vs. Hg/Hg2SO4). The value of Cdl (μF cm−2) is half of the slope,51 which is 12.9 μF cm−2 for Fe3+NiMoC, 2.9 μF cm−2 for Fe3+Ni-PBAC, 1.6 μF cm−2 for Fe2+NiMoC and 0.5 μF cm−2 for Fe2+Ni-PBAC. The CV was also tested from −0.90 to −0.80 V (vs. Hg/HgO) with a scan rate from 10 to 100 mV s−1 in 1 M KOH (Fig. 6c and d). Cdl was calculated with ΔJ at −0.85 V (vs. Hg/HgO). The value of Cdl (μF cm−2) was 20.3 μF cm−2 for Fe3+NiMoC, 4.6 μF cm−2 for Fe3+Ni-PBAC, 4.6 μF cm−2 for Fe2+NiMoC and 0.4 μF cm−2 for Fe2+Ni-PBAC. It was assumed that the catalytic effect can be improved with the increasing quantity of catalytically active sites, which is consistent with the results of 3.2 and 3.3.In order to investigate the durability of the catalyst, CVs were carried out in 0.5 M H2SO4 or 1 M KOH solution. Fe3+NiMoC and 20% commercial Pt/C were electrolyzed from −0.4 to 0 V (vs. RHE) in N2-saturated 0.5 M H2SO4 or 1 M KOH solution with the scan rate of 100 mV s−1 for 10![[thin space (1/6-em)]](https://www.rsc.org/images/entities/char_2009.gif) 000 segments. In Fig. 6e and f, the LSV curves before and after CVs demonstrate that Fe3+NiMoC has less current density loss after CVs than commercial 20% Pt/C in 0.5 M H2SO4 or 1 M KOH, which suggests that Fe3+NiMoC is more durable compared to commercial Pt/C.
000 segments. In Fig. 6e and f, the LSV curves before and after CVs demonstrate that Fe3+NiMoC has less current density loss after CVs than commercial 20% Pt/C in 0.5 M H2SO4 or 1 M KOH, which suggests that Fe3+NiMoC is more durable compared to commercial Pt/C.
4. Conclusion
In summary, we synthesized a new carbon cage-encapsulated FeNiMo compound material to electrocatalyze the HER. This non-noble metal catalyst exhibits excellent electrocatalytic performance in both acidic (246 mV, 10 mA cm−2) and alkaline (199 mV, 10 mA cm−2) solutions. More importantly, we have found a cheap and feasible way to establish a carbon cage structure, which can further enhance the durability of the non-metal catalyst. In general, this paper provides a promising way to decrease the cost of the catalyst for the HER by using an efficient and durable non-noble metal catalyst to replace the noble-metal one.Conflicts of interest
The authors have no competing interests to declare.Acknowledgements
This work was supported by National Key R&D Program of China (No. 2016YFC1102802).References
- P. Lu, Y. Yang, J. Yao, M. Wang, S. Dipazir, M. Yuan, J. Zhang, X. Wang, Z. Xie and G. Zhang, Appl. Catal., B, 2019, 241, 113–119 CrossRef CAS.
- W. Lubitz and W. Tumas, Chem. Rev., 2007, 107, 3900–3903 CrossRef CAS PubMed.
- J. Zhang, W. Jia, S. Dang and Y. Cao, J. Colloid Interface Sci., 2020, 560, 161–168 CrossRef CAS.
- Z. Tao, T. Wang, X. Wang, J. Zheng and X. Li, ACS Appl. Mater. Interfaces, 2016, 8, 35390–35397 CrossRef CAS PubMed.
- J. Huang, C. Du, J. Nie, H. Zhou, X. Zhang and J. Chen, Electrochim. Acta, 2019, 326, 134982 CrossRef CAS.
- J. Tian, Q. Liu, A. M. Asiri and X. Sun, J. Am. Chem. Soc., 2014, 136, 7587–7590 CrossRef CAS PubMed.
- A. Kumar and S. Bhattacharyya, ACS Appl. Mater. Interfaces, 2017, 9, 41906–41915 CrossRef CAS PubMed.
- W. Zhu, R. Zhang, F. Qu, A. M. Asiri and X. Sun, ChemCatChem, 2017, 9, 1721–1743 CrossRef CAS.
- J. Wang, W. Cui, Q. Liu, Z. Xing, A. M. Asiri and X. Sun, Adv. Mater., 2016, 28, 215–230 CrossRef CAS.
- T. Y. Ma, S. Dai, M. Jaroniec and S. Z. Qiao, J. Am. Chem. Soc., 2014, 136, 13925–13931 CrossRef CAS PubMed.
- L. Zhang, I. S. Amiinu, X. Ren, Z. Liu, G. Du, A. M. Asiri, B. Zheng and X. Sun, Inorg. Chem., 2017, 56, 13651–13654 CrossRef CAS PubMed.
- X. Ren, W. Wang, R. Ge, S. Hao, F. Qu, G. Du, A. M. Asiri, Q. Wei, L. Chen and X. Sun, Chem. Commun., 2017, 53, 9000–9003 RSC.
- W. Wang, L. Yang, F. Qu, Z. Liu, G. Du, A. M. Asiri, Y. Yao, L. Chen and X. Sun, J. Mater. Chem. A, 2017, 5, 16585–16589 RSC.
- W. Wang, X. Ren, S. Hao, Z. Liu, F. Xie, Y. Yao, A. M. Asiri, L. Chen and X. Sun, Chem. – Eur. J., 2017, 23, 12718–12723 CrossRef CAS PubMed.
- D.-H. Ha, B. Han, M. Risch, L. Giordano, K. P. C. Yao, P. Karayaylali and Y. Shao-Horn, Nano Energy, 2016, 29, 37–45 CrossRef CAS.
- Y. Zhang, Y. Liu, M. Ma, X. Ren, Z. Liu, G. Du, A. M. Asiri and X. Sun, Chem. Commun., 2017, 53, 11048–11051 RSC.
- T. Liu, D. Liu, F. Qu, D. Wang, L. Zhang, R. Ge, S. Hao, Y. Ma, G. Du, A. M. Asiri, L. Chen and X. Sun, Adv. Energy Mater., 2017, 7, 1700020 CrossRef.
- T. Liu, L. Xie, J. Yang, R. Kong, G. Du, A. M. Asiri, X. Sun and L. Chen, ChemElectroChem, 2017, 4, 1840–1845 CrossRef CAS.
- L. Zhang, X. Ren, X. Guo, Z. Liu, A. M. Asiri, B. Li, L. Chen and X. Sun, Inorg. Chem., 2018, 57, 548–552 CrossRef CAS PubMed.
- R. Zhang, X. Ren, S. Hao, R. Ge, Z. Liu, A. M. Asiri, L. Chen, Q. Zhang and X. Sun, J. Mater. Chem. A, 2018, 6, 1985–1990 RSC.
- X. F. Lu, L. Yu, J. Zhang and X. W. Lou, Adv. Mater., 2019, 31, 1900699 CrossRef PubMed.
- N. Cheng, L. Ren, G. Casillas, S. Zhou, J. Zhuang, L. Wang, X. Xu, S. X. Dou and Y. Du, Sustainable Energy Fuels, 2019, 3, 1757–1763 RSC.
- J. Landon, E. Demeter, N. İnoğlu, C. Keturakis, I. E. Wachs, R. Vasić, A. I. Frenkel and J. R. Kitchin, ACS Catal., 2012, 2, 1793–1801 CrossRef CAS.
- Y. Xu, W. Tu, B. Zhang, S. Yin, Y. Huang, M. Kraft and R. Xu, Adv. Mater., 2017, 29, 1605957 CrossRef PubMed.
- X. F. Lu, L. Yu and X. W. Lou, Sci. Adv., 2019, 5, eaav6009 CrossRef CAS PubMed.
- M. F. Kibria and M. S. Mridha, Int. J. Hydrogen Energy, 1996, 21, 179–182 CrossRef CAS.
- M. Gong, Y. Li, H. Wang, Y. Liang, J. Z. Wu, J. Zhou, J. Wang, T. Regier, F. Wei and H. Dai, J. Am. Chem. Soc., 2013, 135, 8452–8455 CrossRef CAS PubMed.
- J. Du, C. Chen, F. Cheng and J. Chen, Inorg. Chem., 2015, 54, 5467–5474 CrossRef CAS PubMed.
- A. Subramania, A. R. Sathiya Priya and V. S. Muralidharan, Int. J. Hydrogen Energy, 2007, 32, 2843–2847 CrossRef CAS.
- X.-Y. Yu, Y. Feng, Y. Jeon, B. Guan, X. W. Lou and U. Paik, Adv. Mater., 2016, 28, 9006–9011 CrossRef CAS PubMed.
- X. Zhao, P. Pachfule, S. Li, J. R. J. Simke, J. Schmidt and A. Thomas, Angew. Chem., Int. Ed., 2018, 57, 8921–8926 CrossRef CAS PubMed.
- F.-X. Ma, H. B. Wu, B. Y. Xia, C.-Y. Xu and X. W. Lou, Angew. Chem., Int. Ed., 2015, 54, 15395–15399 CrossRef CAS PubMed.
- H. Zhang, S. Hwang, M. Wang, Z. Feng, S. Karakalos, L. Luo, Z. Qiao, X. Xie, C. Wang, D. Su, Y. Shao and G. Wu, J. Am. Chem. Soc., 2017, 139, 14143–14149 CrossRef CAS PubMed.
- J. Wang, D. Gao, G. Wang, S. Miao, H. Wu, J. Li and X. Bao, J. Mater. Chem. A, 2014, 2, 20067–20074 RSC.
- X. Fan, Z. Peng, R. Ye, H. Zhou and X. Guo, ACS Nano, 2015, 9, 7407–7418 CrossRef CAS PubMed.
- Q. Qin, H. Jang, L. Chen, G. Nam, X. Liu and J. Cho, Adv. Energy Mater., 2018, 8, 1801478 CrossRef.
- Y. Cao, H. Wang, R. Ding, L. Wang, Z. Liu and B. Lv, Appl. Catal., A, 2020, 589, 117308 CrossRef CAS.
- L. Liu, N. Chen, Y. Lei, X. Xue, L. Li, J. Wang, S. Komarneni, H. Zhu and D. Yang, J. Hazard. Mater., 2018, 360, 279–287 CrossRef CAS PubMed.
- S. Bai, C. Chen, D. Zhang, R. Luo, D. Li, A. Chen and C.-C. Liu, Sens. Actuators, B, 2014, 204, 754–762 CrossRef CAS.
- Q. Zhao, Z. Yan, C. Chen and J. Chen, Chem. Rev., 2017, 117, 10121–10211 CrossRef CAS PubMed.
- L. Cong, Z. Yu, F. Liu and W. Huang, Catal. Sci. Technol., 2019, 9, 1208–1214 RSC.
- R. S. Mann and K. C. Khulbe, Bull. Chem. Soc. Jpn., 1975, 48, 1021–1023 CrossRef CAS.
- Z. Li, J. Ma, B. Zhang, C. Song and D. Wang, CrystEngComm, 2017, 19, 1479–1485 RSC.
- X.-F. Lu, L.-F. Gu, J.-W. Wang, J.-X. Wu, P.-Q. Liao and G.-R. Li, Adv. Mater., 2017, 29, 1604437 CrossRef PubMed.
- H. Perron, T. Mellier, C. Domain, J. Roques, E. Simoni, R. Drot and H. Catalette, J. Phys.: Condens. Matter, 2007, 19, 346219 CrossRef.
- E. J. Sundstrom, X. Yang, V. S. Thoi, H. I. Karunadasa, C. J. Chang, J. R. Long and M. Head-Gordon, J. Am. Chem. Soc., 2012, 134, 5233–5242 CrossRef CAS PubMed.
- J. Wang, F. Xu, H. Jin, Y. Chen and Y. Wang, Adv. Mater., 2017, 29, 1605838 CrossRef PubMed.
- H. Gao, J. Zang, X. Liu, Y. Wang, P. Tian, S. Zhou, S. Song, P. Chen and W. Li, Appl. Surf. Sci., 2019, 494, 101–110 CrossRef CAS.
- Q. Zhang, H. Zhong, F. Meng, D. Bao, X. Zhang and X. Wei, Nano Res., 2018, 11, 1294–1300 CrossRef CAS.
- Y. Yang, Z. Lun, G. Xia, F. Zheng, M. He and Q. Chen, Energy Environ. Sci., 2015, 8, 3563–3571 RSC.
- M. A. Lukowski, A. S. Daniel, F. Meng, A. Forticaux, L. Li and S. Jin, J. Am. Chem. Soc., 2013, 135, 10274–10277 CrossRef CAS PubMed.
Footnote |
| † Electronic supplementary information (ESI) available. See DOI: 10.1039/d0ma00065e |
| This journal is © The Royal Society of Chemistry 2020 |

