 Open Access Article
Creative Commons Attribution 3.0 Unported Licence
Carbon nano-fiber forest foundation for ruthenium oxide pseudo-electrochemical capacitors†
Deepak
Sridhar
 *,
Hao
Yu
,
Jean-Luc
Meunier
and
Sasha
Omanovic
Department of Chemical Engineering, McGill University, 3610 University Street, Montreal, Quebec H3A 0C5, Canada. E-mail: deepak.sridhar@mail.mcgill.ca
First published on 14th April 2020
Abstract
Ruthenium oxide was coated on directly grown carbon nano-fibers (CNF) on nickel foam current collectors at different coating temperatures. The extended surface area and the porous nature of the CNF forest along with the pseudo-capacitance nature of ruthenium oxide enhanced the performance of the electrodes. As the ruthenium oxide coating temperature played a vital role in the charge storage process, an ideal temperature for the oxide formation was determined to optimize the capacitance and stability. Using 6 M KOH as the electrolyte, these samples showed a high aerial capacitance of 822 ± 04 mF cm−2 at a current density of 20 mA cm−2 and retained 94% of its initial capacitance after 5000 charge–discharge cycles. The maximum energy and power density measured were 362 mW h m−2 and 957 kW m−2 respectively. Considering the facileness and the high-performance metrics, this process is easy to scale-up and the electrodes are promising for high-power supercapacitors.
1. Introduction
Due to the rapid depletion of fossil fuels and the increasing severity of environmental pollution, innovation and research towards harnessing alternative energy resources have gained considerable attention.1 One of the key challenges here is the storage and conversion of harnessed energy in an efficient manner. Among the energy storage devices currently available, batteries are favored by the market because of their high energy density. Supercapacitors, on the other hand, have a relatively lower energy density, but they offer a fast charge/discharge rate, good stability, very long life-cycles, and have a high power density.2–4 These unique advantages of supercapacitors make them desirable as power sources either individually or combined with other energy storage devices to build a hybrid power supply system. Lower energy densities are the biggest downside of these devices when compared to batteries. Developing economically viable high energy density materials for supercapacitor electrodes would be the potential solution for this problem.Currently, various carbon-based materials have been intensively studied and proved to be excellent electrode materials for supercapacitors, which include carbon nanotubes (CNT), carbon aerogels, activated carbon, fullerene, graphene and carbon nano-fibers (CNF).5–8 The carbon materials have special advantages such as a high specific surface area, an excellent thermal and electrochemical stability, a wide operating temperature range, as well as good compatibility with metals oxides.9
However, one common problem among most carbon-based materials is their inherent difficulty to be used directly as an electrode on the current collector as most carbon materials are in powder or flake forms. Therefore, binders are needed to produce a slurry mixture of the materials to manufacture mechanically intact electrodes. Inevitably, the binders are electrically non-conductive which will result in higher electric resistance and undesired coverage of the electrode material surface area, which will further reduce the overall performance of a supercapacitor.10,11 Besides, the specific capacitance of carbon-based materials is still low because of their charge storage mechanism, which is based on the electrostatic charging/discharging of the electrochemical double-layer.
Another category of supercapacitor is called pseudocapacitor, which are mostly based on pseudocapacitive metal oxide/hydroxide materials such as RuO2, MnO2, V2O5, ZnO, IrO2, etc.12–14 Transition metal oxides/hydroxides can provide much higher capacitance than carbon-based materials because of the contribution of very fast reversible redox reactions during the charge storage process on the surface and within the thin sub-surface region.15,16 Among the transition metal oxides mentioned above, RuO2 is believed to be one of the best candidates for its record-high capacitance, excellent electrical conductivity, and superior electrochemical reversibility and stability.17,18 However, the major drawbacks that prevent using ruthenium oxide for commercial production include its high costs and loss of power density when operating at high charge/discharge rates. A promising solution to solve the problems mentioned above is to fabricate composite materials that utilize the porous structure and larger surface area of carbon materials together with transition metal oxides.19,20 The hybrid materials show strength in improving energy and power density, as well as enhancing the cyclic stability of the electrodes operating in various electrolytes.
In this work, we introduce for the first time, RuO2 loaded on CNF directly grown on nickel foam (Ni-f) substrates via a thermal decomposition method. The highly active redox nature of RuO2 was fully realized by enhanced surface area from the underlying CNF, which further provided exceptional specific energy and specific power. The novel and facile technique to produce binder-less electrodes are easy to scale up for commercial production due to minimal preparation steps and minimal use of RuO2. The effect of electrode preparation temperature on the capacitance was carefully investigated utilizing both surface characterization techniques and electrochemical measurements. This high-performance material with superior cycling stability makes it an outstanding candidate as pseudocapacitor electrodes for practical applications. Compared with ruthenium oxides produced by other methods, the capacitance of our electrodes is amongst the highest level of state of the art pseudocapacitors.
2. Materials and methods
2.1. Electrode preparation
CNF were grown on Ni-f (80 μM thick, MTI corp.) using the method described in our previous article.6 Briefly, Ni-f was cut into 1 cm × 1 cm squares and cleaned in 0.1 M acetic acid and then sonicated in ethanol for 10 minutes. Further, these pieces were dried and weighed (ultramicro balance Sartorius S4). Then, these cleaned foam pieces were placed on a ceramic boat and positioned at the center of a horizontal split furnace (Lindberg-Blue HTF5500; 120V/30A). Argon at a flow rate of 500 sccm was flown throughout the process. The Ni-f structure was preheated at 410 °C for 30 min and then 50 sccm of acetylene was passed for 5 min (injection phase), followed by a 30 min growth phase, and later the furnace was cooled down to the room temperature. The Ni-f was weighed before and after the growth of CNF to determine the carbon mass accumulation. The carbon accumulation was found to be 3.88 ± 0.07 mg cm−2.The ruthenium oxide layer was coated on the CNF by the thermal decomposition method. The precursor solution of 0.15 M RuCl3·xH2O (Sigma Aldrich 206229) was carefully applied on the CNF substrate using a pipet. A total of 3 drops (22.5 μL in total) of the precursor solution were deposited on the surface of CNF substrate to ensure the surface was fully covered. After applying the first coat, the CNF substrate was placed into the furnace in air and was annealed for 15 min at different temperatures (200 °C, 250 °C, 300 °C, 350 °C, 400 °C – experimental parameter). Then, the CNF substrate was removed from the furnace and placed at room temperature for cooling for 10 min before another layer was applied. Three layers of RuCl3·xH2O precursor solution was applied in total and the last layer was annealed in the furnace for 1 h in order to fully oxidize the precursor. This method was determined as being optimal, following several experiments using variations in coating layers (results not discussed in this article). A schematic of the electrode preparation is shown in Fig. 1. Error bars in the graphs or the measure of variability reported in this work represent standard deviation with n = 3, unless specified with a different n value.
2.2. Material characterization
Hitachi Cold FE SU-8000 SEM (scanning electron microscope) along with energy-dispersive X-ray spectroscopy (EDX) was used to evaluate the surface topography and elemental composition. Transmission electron microscope (TEM) images were captured using Talos-F200X from Thermo Fisher scientific. S160 carbon film-200 mesh copper grids from Agar Scientific were used to mount the sample. The RuO2–CNF electrode was simply scraped off the Ni-f, and then acetone (optima, Fischer chemical) was added onto the scraped power and pipetted onto the grid. This method was adopted to ensure the presence of RuO2 on the grid. For imaging uncoated CNF, the whole CNF forest (including Ni-f) was sonicated in acetone for two minutes and drop cast on the grid. K-Alpha X-ray Photoelectron Spectrometer system (XPS) from Thermo Fisher Scientific was used with an aluminum X-ray source to find the elemental surface composition. An X-ray spot size of 400 μm and a pass energy of 20 eV were used for high-resolution HR-XPS curves and the dwell time was set at 50 ms with energy step size 0.10 eV. A dwell time of 10 ms and pass energy of 200 eV with an energy step size of 1.00 eV was used to acquire the survey spectrum. Avantage v5.932 software was used for curve fitting. The background of each spectrum was corrected using the Shirley-type background subtraction and the mixed Gaussian–Lorentzian line shape functions were used to fit all HR-XPS. Thermal gravimetric analysis (TGA, TA Instruments Q500) was performed at a ramp rate of 5 °C min−1 in air. The whole electrode, including the Ni-f current collector, was used for the analysis. A small piece of the electrode (including the Ni-f current collector) was loaded onto the platinum pan and loaded into the analysis chamber. Raman spectroscopy measurements were obtained using a DXR3 Raman (Thermo Fisher Scientific) with a laser wavelength of 532 nm, and a laser power of 5 mW.2.3. Electrochemical characterization
The electrodes were assembled into a 2-electrode symmetric setup using a stainless-steel split cell, and the electrodes were separated using a filter paper (P8 Fisher scientific) soaked in 6 M KOH (electrolyte). Autolab PGSTAT30 (Metrohm, Netherlands) with NOVA software (v. 2.3; Metrohm, the Netherlands) was used to perform cyclic voltammetry (CV), galvanostatic charge–discharge (GCD) and electrochemical impedance spectroscopy (EIS) analysis. Experiments were also repeated using a three-electrode setup for the best performing sample in 6 M KOH, using Hg/HgO (1 M KOH, −129 mV vs. saturated calomel electrode) reference electrode and a graphite rod as the counter electrode. The working electrode was housed in a PTFE holder (WonATech Co., Ltd, South Korea) with a working area of 1 cm2 exposed to the electrolyte, and the graphite rod was placed in a glass frit to separate it from the working electrode (Ace glass, Inc., USA).3. Results and discussion
3.1. Surface and material composition analysis
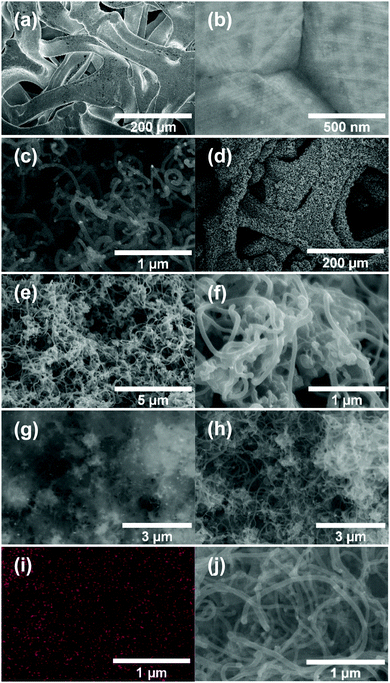
Fig. 2a and b shows the SEM images of Ni-f prior to CNF growth and RuO2 coatings. The Ni-f shows a 3D architecture with different sizes and shapes of pores. When examined under higher magnification (Fig. 2b), we can notice that the surface of pure Ni-f is rather smooth and no special micro/nano-structures can be observed apart from the grain boundaries. Uncoated CNF grown on Ni-f is shown in Fig. 2c, and the bright dots are nickel particles which are formed during the CNF growth process. Such spots do not show up on the subsequent images which are CNF coated with RuO2. Fig. 2d–h show RuO2–CNF prepared at 250 °C. Fig. 2d indicates the CNF-forest coverage with RuO2 coat is quite uniform over the Ni-f, including inside the foam open structure. Fig. 2e shows the dense structure of the CNF-forest providing a high surface area and porosity scales in the order of μm and below. Fig. 2f shows the RuO2 coating having a smooth and uniform coverage on the CNF structures, with the highly porous and ultrafine 3D network being preserved. The tubular-shaped CNFs coated with ruthenium oxide are observed to have an average diameter of 66 ± 8 nm (n = 20). Clusters of RuO2 coating on CNF can be observed in the backscattered-electron (BSE) image in Fig. 2g, and the corresponding secondary-electron (SE) image is shown in Fig. 2h. BSE and SE images showing a preserved open structure of the underlying CNF even after oxide coating along with the EDX spectra are shown in SFig. 1 (ESI†). Fig. 2i and j show the distribution of elemental ruthenium exhibiting uniform distribution of ruthenium oxide over CNF forest and the corresponding SE image, respectively. EDX mapping of all the involving elements of the electrode is shown in SFig. 2 (ESI†).HR-TEM of the CNF (uncoated) in Fig. 3a shows a mixture of graphitized and amorphous regions. We also see a narrow hollow core in this image, however not all CNF have shown such tubular structure (SFig. 3, ESI†). A small region in Fig. 3b indicated by the white square is digitally magnified and shown Fig. 3b. These graphitized pockets are disorganized in orientation amidst the amorphous region. The spacing between the graphitic lattice is about 0.34 nm. Graphitic layers here are wavy, discontinuous and the crystallite size appears to be small. The mean crystallite size (La) can be estimated from the Raman spectra (SFig. 4, ESI†) using a formula proposed by Mallet-Ladeira et al.,21 and was evaluated to be 2.21 ± 0.08 nm (n = 4). Raman spectra showed only faint peaks centered around 640 cm−1 and 520 cm−1 in the case of RuO2–CNF, in addition to the standard D (∼1344 cm−1), G (∼1586 cm−1), G′ (∼2681 cm−1) peaks, and a peak at ∼2390 cm−1, which is a combination scattering peak of D and G′.22,23 It is reported in the literature that Ru crystallites show peaks centered at ∼520 cm−1 and ∼640 cm−1.24 In this study these peaks are hard to decipher mostly due to the shadowing of the peaks intensity with the background from the bulk CNF forest underneath it. The defect ratio (ID/IG) of the as-grown CNF is found to be 2.28 ± 0.08 (n = 4), indicating a relatively high disorder in the structure.25 The curve fitting parameters of the D and G peaks are shown in STable 1 (ESI†). A TEM image of the prepared RuO2–CNF sample shows sheet-like RuO2 formation (Fig. 3c). It is to be noted that samples prepared for the TEM imaging were scrapped off the electrode. Thus, it does not really represent the topography of the actual electrode structure. It can be observed that these RuO2 sheets are randomly present on top of the CNF. A TEM at higher magnification showing the ruthenium oxide deposits, an HR-TEM and the associated EDX spectra confirming the presence of RuO2 are shown in SFig. 5 (ESI†).
 | ||
| Fig. 3 (a) HR-TEM image of uncoated CNF showing a large number of zones having graphitic layer structures when viewed in high resolution, (b) enlarged image of the white-box in Fig. 3b, showing one example of such zone. The white lines and the arrow depict the spacing between the graphitic layers, which is found to be ca. 0.34 nm, characteristic of graphite. (c) TEM image of RuO2–CNF electrode prepared at 250 °C. Arrows show some RuO2 sheets (dark regions). | ||
An XPS-survey spectrum confirms the presence of ruthenium, carbon, oxygen, and chloride on the electrode surface (Fig. 4a). The elemental composition determined from the EDX (SFig. 1, ESI†) and the XPS is shown in Fig. 4b. Fig. 5a–c show the HR-XPS for Cl 2p, Ru 3p and O 1s, respectively. Ru 3p core-level spectra are analyzed instead of Ru 3d to avoid peak overlapping with C 1s core level spectra, which could deter the identification of Ru species appropriately. NIST database was used to assign the majority of the fitted peaks26 and the fitted peak values of all the elements are shown in STable 2 (ESI†).
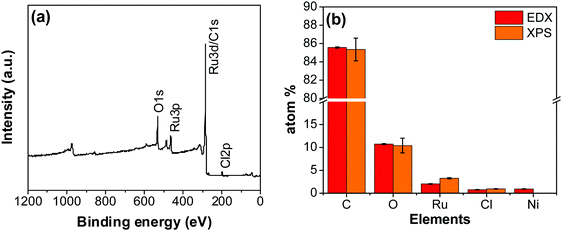 | ||
| Fig. 4 (a) XPS survey scan of the RuO2–CNF electrode prepared at 250 °C. (b) The elemental composition of the RuO2–CNF electrode determined using EDX and XPS. n = 3. | ||
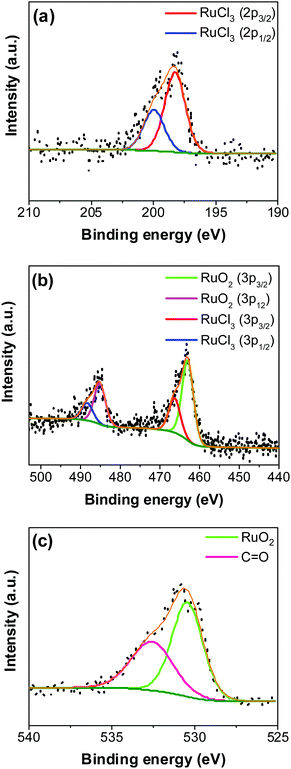
In Fig. 5a, the peaks at 198.29 ± 0.02 and 199.99 ± 0.02 eV correspond to the Cl 2p3/2 and Cl 2p1/2, respectively, due to the presence of chlorides remained from the hydrous RuCl3 precursor after the thermal decomposition (0.95 ± 0.05 atom% of Cl in the coating, Fig. 4b). Fig. 5b shows Ru 3p spectra with a doublet fitted with curves assigned to the same chemical states as in Ru 3d spectra. In the Ru 3p3/2 part of the spectra, the curves with peaks at 462.87 ± 0.22, and 466.02 ± 0.30 eV were assigned to RuO2, and RuCl3 respectively. Spin–orbit splitting (SOS) between Ru 3p3/2 and Ru 3p1/2 is found to be ∼22 eV. In the O 1s core spectra shown in Fig. 5c, RuO2 is assigned to the curves with a peak centered at 530.35 ± 0.09 eV. Additionally, the peak at 532.43 ± 0.15 eV can be assigned to C![[double bond, length as m-dash]](https://www.rsc.org/images/entities/char_e001.gif) O.27
O.27
TGA was performed in air to further investigate the electrode composition (electrode prepared 250 °C), and the change in the electrode weight percentage in the temperature range 30 °C to 650 °C is shown in SFig. 6a (ESI†). The bare CNF structure on the Ni-f shows a sharp decline in the mass percentage beyond 450 °C, which is mainly due to the decomposition of the CNF. This behavior is consistent with the literature where CNF were prepared using different techniques.28–30 Thermal decomposition of hydrous RuCl3 can be represented by eqn (1). Interestingly the TGA curve for RuO2–CNF has an initial gradual slope due to the loss of physically adsorbed water at lower temperatures, followed by the loss of water in the crystal.31 This is followed by the early onset of carbon combustion at ca. 300 °C. Even though it is observed that RuO2 shows no weight loss until 1025 °C,32 the weight loss for the RuO2–CNF exclusively due to the loss of water is difficult to estimate. This is because the carbon oxidation onset point for RuO2–CNF will be lowered in comparison to that of pure CNF due to the catalytic effect of the RuO2 present on the CNF surface.33,34 A TGA of just hydrous ruthenium chloride is shown in SFig. 6b (ESI†). For the CNF and the RuO2–CNF samples, the weight increases above ca. 550 °C are due to the formation of oxides from the underlying nickel foam substrate.
| RuCl3·xH2O + O2 → RuO2·xH2O + 1.5Cl2 | (1) |
3.2. Electrochemical analysis
| RuOx(OH)y + zH2O + ze− → RuOx−z(OH)y+z + zOH− | (2) |
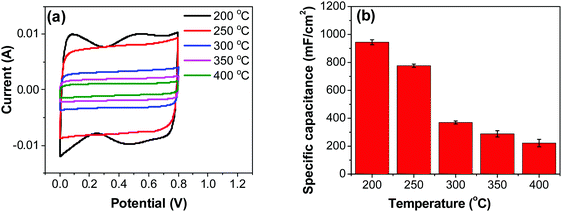 | ||
| Fig. 6 (a) CV measurements of RuO2–CNF electrodes prepared at different temperatures, recorded in a two-electrode setup at 20 mV s−1. (b) Specific capacitances determined from CV curves. | ||
Variation of CV curves and the dependence of the peak currents with the scan rate for the electrodes prepared at 200 °C is shown in SFig. 7 (ESI†). As the peak currents are linearly proportional to the scan rates, it can be inferred that the reaction is surface area limited rather than being diffusion controlled. This hints additional pseudo capacitance which is mostly contributed by the fast-redox reaction in the voids and pores which can be expected in samples prepared at 200 °C where more hydrous content is preserved. Subsequently, the peaks also become subdued at higher scan rates further indicating the role of additional hydrous pores and voids which would be harder for the electrolyte ions to access at higher scan rates. Electrodes prepared at higher temperatures shows no appearance peaks, due to the manner in which the redox peaks overlap (Fig. 6a). As mentioned earlier, there are multiple redox reaction happening even though, the CV appears to be rectangle similar to EDLC behavior.
The capacitance of the material was calculated from the CVs in Fig. 6a using eqn (3), where a factor of 2 is used to calculate the capacitance of only one electrode.6,38
 | (3) |
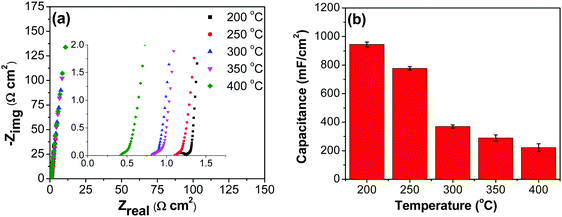
![[double bond, length as m-dash]](https://www.rsc.org/images/entities/char_e001.gif) C) is the average cathodic and anodic charge, and ΔV (V) is the voltage window. Samples of RuO2–CNF prepared at 200 °C showed the highest capacitance, 944 ± 17 mF cm−2, and the capacitance is shown to decrease with the increase in the electrode preparation temperature (Fig. 6b). The presence of water in the lattice of the RuO2 is the plausible reason for the increased capacitance at lower temperatures due to enhanced protonic and electronic conduction.39 At higher temperatures (>300 °C), RuO2 is known to become more crystalline and loses water content (SFig. 6a, ESI†), which leads to proton (or hydroxyl ion) diffusion limitation causing reduced capacitance.17,40–42 Additionally, the decreased capacitance could be associated with the reduced electrolyte accessible surface area due to the loss of water in the inter-particle (both carbon fibers and metal-oxide) voids, and increased particle aggregation at higher oxide forming temperatures.
C) is the average cathodic and anodic charge, and ΔV (V) is the voltage window. Samples of RuO2–CNF prepared at 200 °C showed the highest capacitance, 944 ± 17 mF cm−2, and the capacitance is shown to decrease with the increase in the electrode preparation temperature (Fig. 6b). The presence of water in the lattice of the RuO2 is the plausible reason for the increased capacitance at lower temperatures due to enhanced protonic and electronic conduction.39 At higher temperatures (>300 °C), RuO2 is known to become more crystalline and loses water content (SFig. 6a, ESI†), which leads to proton (or hydroxyl ion) diffusion limitation causing reduced capacitance.17,40–42 Additionally, the decreased capacitance could be associated with the reduced electrolyte accessible surface area due to the loss of water in the inter-particle (both carbon fibers and metal-oxide) voids, and increased particle aggregation at higher oxide forming temperatures.
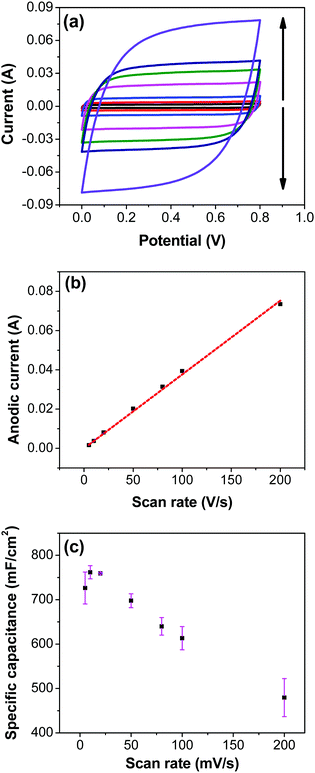
Fig. 7a shows CV recorded at different scan rates for the electrodes prepared at 250 °C. The shape of the CV remains semi-rectangular even at higher scan rates, signifying the easy access of ions into the porous structure of the electrode to rapidly form a double layer along with lower series resistance. The linear dependence of the anodic current recorded at 0.5 V with varying scan rates (Fig. 7b) suggests a surface-controlled behavior rather than a diffusion-controlled behavior. This is due to the easy accessibility of the ions into the pores followed by the occurrence of the pseudo capacitance due to redox reaction (eqn (2)), along with the electrostatic double-layer charging, as previously mentioned. The variation of capacitance with scan rate is shown in Fig. 7c. It can be observed that the capacitance at the scan rate of 5 mV s−1 is lower than the capacitance at 10 and 20 mV s−1, and the same was recorded in GCD measurements (Fig. 9); this appears counter-intuitive when compared to literature data for most of electrodes. This anomality could have resulted due to the structural collapsing of the carbon fibers in the electrode at very low scan rates, which results in decreased access to the electrode surface area resulting in lower capacitance. Similar trend has been reported with uncoated carbon nano fibers in the past.43,44
Capacitance was calculated from the discharge curve using the following equation:
 | (4) |
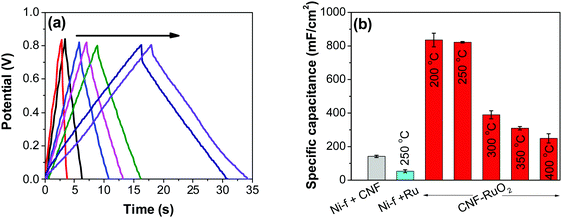
As control electrodes, CNF on Ni-f and RuO2 deposited directly on the Ni-f, are shown. The CNF electrode gave a capacitance of 142 ± 07 mF cm−2, which is in agreement with previous studies.44 When RuO2 was deposited on the Ni-f, the resulting capacitance decreased to 53 ± 08 mF cm−2. This shows that, despite the fact that RuO2 is an excellent pseudo-capacitor material whose capacitance is based on the occurrence of fast reversible redox reactions in the solid phase (eqn (2)), applying it directly on the Ni-f current collector is not desirable. However, when the two configurations are combined, the resulting capacitance increased tremendously, which is due to the combination of the high surface area template provided by the CNF and the pseudo-capacitive behavior of RuO2. The capacitance reached a maximum value for the electrodes produced at 200 °C and 250 °C (835 ± 40 mF cm−2 and 822 ± 04 mF cm−2, respectively). These values are significantly higher than those recorded on RuO2–CNT and RuO2–CNF based electrodes,46–51 RuO2 graphene-based52 and other ruthenium-based electrodes.53–56 Some of the recent results reported in the literature are shown in Table 1.
| Electrode | Specific capacitance (mF cm−2) | Scan rate (mV s−1) | Electrolyte | Ref. |
|---|---|---|---|---|
| RuO2 electrodes deposited on to TiO2 nanofibers | ca. 275 | 10 | 0.5 M H2SO4 | 57 |
| RuO2 deposited on the surface-roughened Ti plate | 4.4 | 10 | 0.5 M H2SO4 | 57 |
| RuO2 deposited on TiO2 nanorods | 74.8 | 10 | 0.5 M H2SO4 | 57 |
| RuO2/CNT films | 272 | 5 | 0.1 M Na2SO4 | 47 |
| Ruthenium oxide nano string clusters anchored graphene oxide | ca. 584 (859 F g−1) | 5 | 1 M H2SO4 | 58 |
| Ruthenium oxide–carbon nanotube composites | 208.5 | 10 | 0.1 M Na2SO4 | 59 |
| Pt nanotubes and ruthenium dioxide composite | 320 | 2 | 0.5 M H2SO4 | 60 |
| Tubular ruthenium oxide on silicon 3D microstructures | 99.3 | 5 | 0.1 M Na2SO4 | 61 |
| Graphene nano wall–ruthenium oxides | 113 | 2 | 0.1 M Na2SO4 | 62 |
| RuO2 thin films | 53.82 | 5 | H2SO4–PVA | 63 |
| RuO2 on CNT forest | 37.7 | 100 | 0.5 M H2SO4 | 64 |
| Ru nanoparticle with reduced graphene oxide | 238.5 | 5 | 1 M NaNO3 | 52 |
| RuO2 on CNF | 777 ± 11 (822 ± 04) | 20 (20 mA cm−2) | 6 M KOH | Present work |
Fig. 8b shows decreasing capacitance values with increasing electrode preparation temperature. This trend in capacitance behavior shows higher capacitance at lower oxide preparation temperatures when compared to previously studied RuO2 electrodes.39,46,65–68 The method of preparation employed in this work along with the underlying evenly distributed CNF has enabled higher capacitance values. Studies have reported that the protonic and electronic conduction pathways in the RuO2·xH2O varies with the water content within the rutile structure.69–71 In this study, the underlying CNF forest, which acts like a large surface area template, influences the availability of the electrochemically active surface area along with its influence on some physical properties due to nanostructured effects.
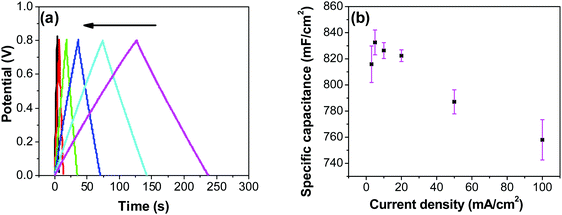
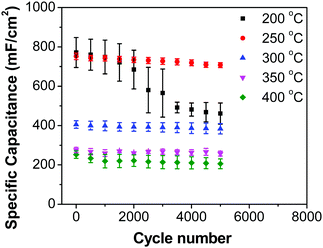
In order to investigate the influence of current density on the charging/discharging rate and the resulting capacitance, GCD curves for the electrode prepared at 250 °C were recorded (Fig. 9a), and the variation of capacitance with current density is shown in Fig. 9b. It is to be noted that, electrodes prepared at 250 °C were chosen for this analysis despite their lower capacitances compared to electrodes prepared at 200 °C, considering their much better cycling stability, which is discussed later in this article. As it can be seen from Fig. 9a, the shape of the GCD curves is not dependent on the current density; all the curves show symmetrical/triangular behavior. With an increase in current density, the charging/discharging rate increases, as evidenced by the increase in the corresponding slopes of the curves. To evaluate if this is at the expense of a decreased capacitance, the corresponding values were calculated; as it can be seen in Fig. 9b, the capacitance shows a general decrease with the increase in current density, which is to be expected. Capacitance values change from roughly 830 mF cm−2 at 3 mA cm−2 to 760 mF cm−2 at 100 mA cm−2. It is noticed that the capacitance remained slightly lower at 3 mA cm−2 than at 5 mA cm−2, which was already discussed previously in relation to CV data (Fig. 7).
Most ruthenium-based capacitors have the disadvantage of lower capacitance (and thus also lower energy density) at higher charge/discharge currents.31,52,72,73 However, for the RuO2–CNF electrodes (Fig. 9b), only a 10% decrease in the capacitance is observed at a high current density of 100 mA cm−2 when compared to the capacitance at 5 mA cm−2. This is because the high surface area and the well-connected CNF support provide a template for the distribution of the RuO2 leading to faster proton diffusion, less series resistance and the larger double layer area formation at the electrode surface, leading to these enhanced supercapacitor qualities.
All electrodes show a vertical trend in the lower frequency region, almost parallel to the imaginary impedance axis, indicating good capacitive behavior. Therefore, a series RC-model was adapted to interpret the data and the capacitances at a low frequency (0.01 Hz) were calculated for various samples using eqn (5).75,76
 | (5) |
 | (6) |
 | (7) |
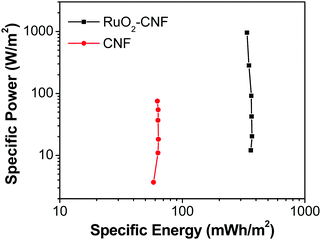 | ||
| Fig. 11 Ragone plot comparing the performance of RuO2–CNF electrode prepared at 250 °C (present work) to the uncoated-CNF electrode.6 | ||
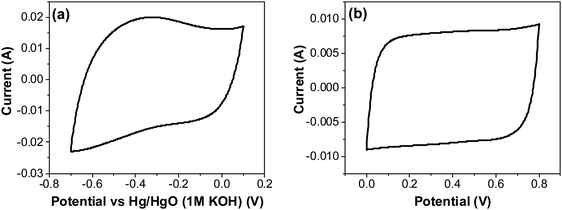 | ||
| Fig. 12 CV of RuO2–CNF electrodes prepared at 250 °C, in 6 M KOH electrolyte recorded at 20 mV s−1 (a) using a three-electrode cell, and (b) using a two-electrode cell. | ||
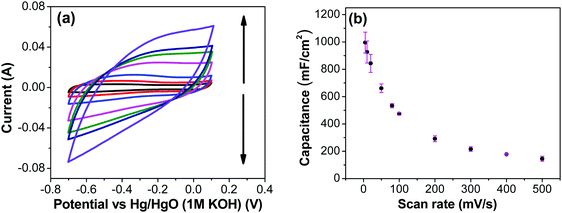
The CV curves with varying scan rates are shown in Fig. 13a. These curves tend to slant at higher scan rates, suggesting higher series resistance. A comparison with EIS confirms higher series resistance in the three-electrode supporting this trend (SFig. 9, ESI†). This effect diminishes in the two-electrode cell, as the electrodes are pressed against each other tightly, which then compresses the CNF and form a conducive network for better conductivity. Capacitance values at scan rates varying from 5 to 500 mV s−1 were calculated from the CVs in Fig. 13a using the average cathodic and anodic charge, and are presented in Fig. 13b. It is to be noted that the capacitance values continuously increased as the scan rate decreased, unlike the trend found using the two-electrode system where the electrodes were pressed tightly against each other, where the first point shows a lower capacitance than the second point (Fig. 7c). This result reinforces the possibility of structural collapsing of the carbon fibers and the requirement of certain current density (scan rate) to provide more electrochemical active surface area. In three electrode measurements, the electrode was simply exposed to the bulk electrolyte solution with no separator and the other half-cell electrode pressing against the working electrode. Thus, surface area available for the redox reaction and double layer formation increased with the decrease in the scan rate.
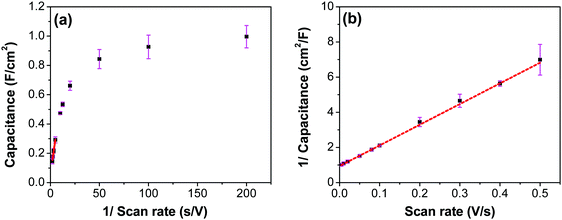
To evaluate the contribution of the inner and outer layer of the electrode to the capacitance, Trisatti's method was used (Fig. 14) using the results from the three-electrode measurements.65 At an infinitely high scan rate it is assumed that only the easily-accessible outer surface area of the electrode participates in the formation of the capacitance (Couter), while at an infinitely low scan rate, a maximum (total) possible capacitance (CT) is achieved. The intercept of the linear portion of the trend in Fig. 14a with the ordinate yields a value of 60 mF cm−2, which represents the contribution of an outer surface area of the electrode (Couter) to the total capacitance. On the other hand, the intercept of the linear trend in Fig. 14b yields a value of 1062 mF cm−2, which includes both inner and outer surface contribution to the maximum/total capacitance (CT). The contribution of the inner surface capacitance (Cinner) to the total capacitance can then be calculated by subtracting Couter from CT, which yields a value of 1002 mF cm−2.
4. Conclusion
In this article, RuO2 was coated directly on CNF forests grown on Ni-f. The influence of different preparation conditions on the electrochemical performance for supercapacitor applications was studied. The deposition of RuO2 shows to significantly increase the specific capacitance when compared to CNF only or RuO2 only electrodes. This increase is due to the pseudo capacitance offered by RuO2 along with the surface area of the CNF template, and the preparation conditions of the electrode. RuO2 coated at 250 °C showed 94% capacitance retention after 5000 cycles, and maximum specific energy and maximum specific power of 362 mW h m−2 and 957 W m−2. High specific capacitance, cycling stability and the facileness of the electrode preparation that easily enables scaled up, make this a promising material in applications where the charge per area is essential. This methodology can be used to prepare other metal oxide and conductive polymer coats for similar applications.Conflicts of interest
There is no conflicts to declare.Acknowledgements
This research was supported by the National Science and Engineering Research Council of Canada (NSERC). Additionally, DS thanks Vanier-CGS and McGill University through the McGill Engineering Doctoral Award (MEDA) program for awarding scholarships. We thank Dr Boris Nijikovsky at the Facility for Electron Microscopy Research of McGill University for the help with TEM imaging and our colleague Ms Elmira Pajootan for helping us with SEM imaging facility.References
- P. Thounthong, V. Chunkag, P. Sethakul, S. Sikkabut, S. Pierfederici and B. Davat, J. Power Sources, 2011, 196, 313–324 CrossRef CAS.
- L. Dong, C. Xu, Y. Li, Z. H. Huang, F. Kang, Q. H. Yang and X. Zhao, J. Mater. Chem. A, 2016, 4, 4659–4685 RSC.
- F. Ran, X. Yang and L. Shao, Adv. Compos. Hybrid Mater., 2018, 1, 32–55 CrossRef CAS.
- Poonam, K. Sharma, A. Arora and S. K. Tripathi, J. Energy Storage, 2019, 21, 801–825 CrossRef.
- E. Frackowiak and F. Béguin, Carbon N. Y., 2001, 39, 937–950 CrossRef CAS.
- D. Sridhar, J. L. Meunier and S. Omanovic, Mater. Chem. Phys., 2019, 223, 434–440 CrossRef CAS.
- D. Sridhar, K. Balakrishnan, T. J. Gnanaprakasa, S. Raghavan and K. Muralidharan, RSC Adv., 2015, 5, 63834–63838 RSC.
- X. Li and B. Wei, Nano Energy, 2013, 2, 159–173 CrossRef CAS.
- C. F. Liu, Y. C. Liu, T. Y. Yi and C. C. Hu, Carbon N. Y., 2019, 145, 529–548 CrossRef CAS.
- Z. Zhu, S. Tang, J. Yuan, X. Qin, Y. Deng, R. Qu and G. M. Haarberg, Int. J. Electrochem. Sci., 2016, 11, 8270–8279 CrossRef CAS.
- Q. Abbas, D. Pajak, E. Fr
![[a with combining cedilla]](https://www.rsc.org/images/entities/char_0061_0327.gif) ckowiak and F. Béguin, Electrochim. Acta, 2014, 140, 132–138 CrossRef CAS.
ckowiak and F. Béguin, Electrochim. Acta, 2014, 140, 132–138 CrossRef CAS. - C. Qi Yi, J. Peng Zou, H. Zhi Yang and X. Leng, Trans. Nonferrous Met. Soc. China, 2018, 28, 1980–2001 CrossRef.
- A. Afif, S. M. Rahman, A. Tasfiah Azad, J. Zaini, M. A. Islan and A. K. Azad, J. Energy Storage, 2019, 25, 100852 CrossRef.
- S. Najib and E. Erdem, Nanoscale Adv., 2019, 1, 2817–2827 RSC.
- V. Augustyn, P. Simon and B. Dunn, Energy Environ. Sci., 2014, 7, 1597–1614 RSC.
- B. E. Conway, Electrochemical supercapacitors: scientific fundamentals and technological applications, Springer Science & Business Media, 2013 Search PubMed.
- G. Wang, L. Zhang and J. Zhang, Chem. Soc. Rev., 2012, 41, 797–828 RSC.
- Y. Zhang, H. Feng, X. Wu, L. Wang, A. Zhang, T. Xia, H. Dong, X. Li and L. Zhang, Int. J. Hydrogen Energy, 2009, 34, 4889–4899 CrossRef CAS.
- Q. Li, S. Zheng, Y. Xu, H. Xue and H. Pang, Chem. Eng. J., 2018, 333, 505–518 CrossRef CAS.
- M. Zhi, C. Xiang, J. Li, M. Li and N. Wu, Nanoscale, 2012, 72–88 Search PubMed.
- P. Mallet-Ladeira, P. Puech, C. Toulouse, M. Cazayous, N. Ratel-Ramond, P. Weisbecker, G. L. Vignoles and M. Monthioux, Carbon N. Y., 2014, 80, 629–639 CrossRef CAS.
- I. Childres, L. A. Jauregui, W. Park, H. Cao and Y. P. Chen, New Dev. Photon Mater. Res., 2013, 1, 1–20 CrossRef.
- D. Sridhar, S. Omanovic and J.-L. Meunier, Diamond Relat. Mater., 2018, 81, 70–76 CrossRef CAS.
- A. V. Korotcov, Y. Huang, K. Tiong and D. Tsai, J. Raman Spectrosc., 2007, 38, 737–749 CrossRef CAS.
- M. S. Dresselhaus, A. Jorio, A. G. Souza Filho and R. Saito, Philos. Trans. R. Soc., A, 2010, 368, 5355–5377 CrossRef CAS PubMed.
- A. V. Naumkin, A. Kraut-Vass, S. W. Gaarenstroom and C. J. Powell, NIST X-ray Photoelectron Spectroscopy (XPS) Database, Version 4.1, https://srdata.nist.gov/xps/, accessed 17 June 2019.
- D. Briggs and G. Beamson, Anal. Chem., 1993, 65, 1517–1523 CrossRef CAS.
- P. V. Adhyapak, T. Maddanimath, S. Pethkar, A. J. Chandwadkar, Y. S. Negi and K. Vijayamohanan, J. Power Sources, 2002, 109, 105–110 CrossRef CAS.
- Y. Zhai, Y. Dou, X. Liu, S. S. Park, C. S. Ha and D. Zhao, Carbon N. Y., 2011, 49, 545–555 CrossRef CAS.
- S. Yasuda, T. Hiraoka, D. N. Futaba, T. Yamada, M. Yumura and K. Hata, Nano Lett., 2009, 9, 769–773 CrossRef CAS PubMed.
- N. Lin, J. Tian, Z. Shan, K. Chen and W. Liao, Electrochim. Acta, 2013, 99, 219–224 CrossRef CAS.
- P. F. Campbell, M. H. Ortner and C. J. Anderson, Anal. Chem., 1961, 33, 58–61 CrossRef CAS.
- J. M. Sieben, E. Morallón and D. Cazorla-Amorós, Energy, 2013, 58, 519–526 CrossRef CAS.
- J. H. Jang, S. Han, T. Hyeon and S. M. Oh, J. Power Sources, 2003, 123(1), 79–85 CrossRef CAS.
- S. Trasatti, Electrochim. Acta, 1991, 36, 225–241 CrossRef CAS.
- S. Trasatti and G. Buzzanca, J. Electroanal. Chem., 1971, 29, 4–8 CrossRef.
- B. E. Conway, Electrochemical supercapacitors: scientific fundamentals and technological applications, Springer Science & Business Media, 2013 Search PubMed.
- S. Zhang and N. Pan, Adv. Energy Mater., 2015, 5, 1401401 CrossRef.
- K. H. Chang, C. C. Hu and C. Y. Chou, Chem. Mater., 2007, 19, 2112–2119 CrossRef CAS.
- G. Arabale, D. Wagh, M. Kulkarni, I. S. Mulla, S. P. Vernekar, K. Vijayamohanan and A. M. Rao, Chem. Phys. Lett., 2003, 376, 207–213 CrossRef CAS.
- I. H. Kim and K. B. Kim, J. Electrochem. Soc., 2006, 153(2), A383–A389 CrossRef CAS.
- S. Chalupczok, P. Kurzweil, H. Hartmann and C. Schell, Int. J. Electrochem., 2018, 2018, 1–15 Search PubMed.
- D. Sridhar, S. Omanovic and J.-L. Meunier, ECS Meeting Abstracts, 2017, vol. MA2017-01, p. 604 Search PubMed.
- D. Sridhar, J. L. Meunier and S. Omanovic, Mater. Chem. Phys., 2019, 223, 434–440 CrossRef CAS.
- Q. Li, S. Zheng, Y. Xu, H. Xue and H. Pang, Chem. Eng. J., 2018, 333, 505–518 CrossRef CAS.
- I.-H. Kim, J.-H. Kim, Y.-H. Lee and K.-B. Kim, J. Electrochem. Soc., 2005, 152, A2170–A2178 CrossRef.
- X. Wang, Y. Yin, C. Hao and Z. You, Carbon N. Y., 2015, 82, 436–445 CrossRef CAS.
- K. S. Yang, C. H. Kim and B. H. Kim, Electrochim. Acta, 2015, 174, 290–296 CrossRef CAS.
- A. L. M. Reddy and S. Ramaprabhu, J. Phys. Chem. C, 2007, 111, 7727–7734 CrossRef CAS.
- S. Yan, H. Wang, P. Qu, Y. Zhang and Z. Xiao, Synth. Met., 2009, 159, 158–161 CrossRef CAS.
- Y. W. Ju, G. R. Choi, H. R. Jung, C. Kim, K. S. Yang and W. J. Lee, J. Electrochem. Soc., 2007, 154, 192–197 CrossRef.
- H. K. Hassan, N. F. Atta, M. M. Hamed, A. Galal and T. Jacob, RSC Adv., 2017, 7, 11286–11296 RSC.
- C. C. Hu, H. Y. Guo, K. H. Chang and C. C. Huang, Electrochem. Commun., 2009, 11, 1631–1634 CrossRef CAS.
- N. Kang, T. Yu, G. H. Lim, T. Koh and B. Lim, Chem. Phys. Lett., 2014, 592, 192–195 CrossRef CAS.
- V. D. Patake and C. D. Lokhande, Appl. Surf. Sci., 2008, 254, 2820–2824 CrossRef CAS.
- Y. Guo, W. Zhang, Y. Sun and M. Dai, MethodsX, 2018, 5, 795–796 CrossRef PubMed.
- Y. R. Ahn, M. Y. Song, S. M. Jo, C. R. Park and D. Y. Kim, Nanotechnology, 2006, 17, 2865–2869 CrossRef CAS.
- K. Y. Kumar, S. Archana, R. Namitha, B. P. Prasanna, S. C. Sharma and M. S. Raghu, Mater. Res. Bull., 2018, 107, 347–354 CrossRef CAS.
- Y. Yin, X. Wang and Z. You, Int. J. Electrochem. Sci., 2017, 12, 3883–3906 CrossRef CAS.
- A. Ponrouch, S. Garbarino, E. Bertin and D. Guay, J. Power Sources, 2013, 221, 228–231 CrossRef CAS.
- X. Wang, Y. Yin, X. Li and Z. You, J. Power Sources, 2014, 252, 64–72 CrossRef CAS.
- J. Li, M. Zhu, Z. An, Z. Wang, M. Toda and T. Ono, J. Power Sources, 2018, 401, 204–212 CrossRef CAS.
- D. P. Dubal, G. S. Gund, R. Holze, H. S. Jadhav, C. D. Lokhande and C. J. Park, Electrochim. Acta, 2013, 103, 103–109 CrossRef CAS.
- R. Warren, F. Sammoura, F. Tounsi, M. Sanghadasa and L. Lin, J. Mater. Chem. A, 2015, 3, 15568–15575 RSC.
- S. Ardizzone, G. Fregonara and S. Trasatti, Electrochim. Acta, 1990, 35, 263–267 CrossRef CAS.
- M. Ramani, B. S. Haran, R. E. White and B. N. Popov, J. Electrochem. Soc., 2002, 148, A374 CrossRef.
- X. Hao, J. Zhao and Q. Zhang, Ceram. Int., 2016, 42, 9170–9177 CrossRef CAS.
- W. Sugimoto, in Encyclopedia of Applied Electrochemistry, ed. G. Kreysa, K. Ota and R. F. Savinell, Springer New York, New York, NY, 2014, pp. 1813–1821 Search PubMed.
- I.-H. Kim and K.-B. Kim, J. Electrochem. Soc., 2006, 153, A383 CrossRef CAS.
- W. Dmowski, T. Egami, K. E. Swider-Lyons, C. T. Love and D. R. Rolison, J. Phys. Chem. B, 2002, 106, 12677–12683 CrossRef CAS.
- C. C. Hu, W. C. Chen and K. H. Chang, J. Electrochem. Soc., 2004, 151(2), A281–A290 CrossRef CAS.
- V. K. A. Muniraj, C. K. Kamaja and M. V. Shelke, ACS Sustainable Chem. Eng., 2016, 4, 2528–2534 CrossRef CAS.
- K. Krishnamoorthy, P. Pazhamalai and S. J. Kim, Electrochim. Acta, 2017, 227, 85–94 CrossRef CAS.
- D. Saha, Y. Li, Z. Bi, J. Chen, J. K. Keum, D. K. Hensley, H. A. Grappe, H. M. Meyer, S. Dai, M. P. Paranthaman and A. K. Naskar, Langmuir, 2014, 30(3), 900–910 CrossRef CAS PubMed.
- Q. L. Chen, K. H. Xue, W. Shen, F. F. Tao, S. Y. Yin and W. Xu, Electrochim. Acta, 2004, 49(24), 4157–4161 CrossRef CAS.
- J. R. Miller, R. A. Outlaw and B. C. Holloway, Science, 2010, 329, 1637–1639 CrossRef CAS PubMed.
- D. Majumdar, T. Maiyalagan and Z. Jiang, ChemElectroChem, 2019, 6, 4343–4372 CrossRef CAS.
- L. L. Zhang and X. S. Zhao, Chem. Soc. Rev., 2009, 38, 2520–2531 RSC.
- G. Yu, X. Xie, L. Pan, Z. Bao and Y. Cui, Nano Energy, 2013, 2, 213–234 CrossRef CAS.
- Y. Meng, L. Wang, H. Xiao, Y. Ma, L. Chao and Q. Xie, RSC Adv., 2016, 6, 33666–33675 RSC.
- D. Zhao, X. Guo, Y. Gao and F. Gao, ACS Appl. Mater. Interfaces, 2012, 4, 5583–5589 CrossRef CAS PubMed.
- P. R. Deshmukh, S. V. Patil, R. N. Bulakhe, S. D. Sartale and C. D. Lokhande, Chem. Eng. J., 2014, 257, 82–89 CrossRef CAS.
- P. Wang, H. Liu, Y. Xu, Y. Chen, J. Yang and Q. Tan, Electrochim. Acta, 2016, 194, 211–218 CrossRef CAS.
- R. C. Ambare, S. R. Bharadwaj and B. J. Lokhande, Appl. Surf. Sci., 2015, 349, 887–896 CrossRef CAS.
Footnote |
| † Electronic supplementary information (ESI) available. See DOI: 10.1039/d0ma00023j |
| This journal is © The Royal Society of Chemistry 2020 |


