
 Open Access Article
 This Open Access Article is licensed under a Creative Commons Attribution-Non Commercial 3.0 Unported Licence
3D nanoplasmonic biosensor for detection of filopodia in cells†
Shuyan
Zhu
 ab,
Mohammed A.
Eldeeb
ab and
Stella W.
Pang
*ab
ab,
Mohammed A.
Eldeeb
ab and
Stella W.
Pang
*ab
aDepartment of Electrical Engineering, City University of Hong Kong, Kowloon, Hong Kong. E-mail: pang@cityu.edu.hk
bCentre for Biosystems, Neuroscience, and Nanotechnology, City University of Hong Kong, Kowloon, Hong Kong
First published on 18th May 2020
Abstract
Filopodia are thin finger-like protrusions from cells and they are hard to detect using electrical, mechanical, or optical sensors because of their nanometer scale features. Besides, the signals from filopodia and the cell membrane are often mixed together which makes the detection of filopodia challenging. Here, a 3D nanoplasmonic biosensor with microposts is proposed to overcome these limitations. By using suitable chemical coating and physical dimensions, the signals from filopodia and the cell membrane were separated by having the microposts keep the cell membrane from making contact with the nanoplasmonic biosensor. The filopodia were detected by the 3D asymmetrical nanopillars with sharp Fano resonance. The sensitivity and figure of merit of the nanoplasmonic biosensor were 650 nm per refractive index unit and 28.3, respectively. A large peak shift of 6 nm was observed for the detection of MC3T3 osteoblastic cell filopodia at a concentration of 1300 cells per mm2. To the best of our knowledge, this is the first demonstration of filopodia detection using nanoplasmonic biosensors, where microposts were used to separate the cell membrane from filopodia and the 3D nanoplasmonic biosensors were used to monitor filopodia on the nanometer scale. These combined 3D micro- and nano-structures allow filopodia to be detected using different sensors without interference from the cell membrane.
1. Introduction
Filopodia are thin, finger-like cellular protrusions that extend out from the cell membrane and serve as sensing probes to recognize the surrounding extracellular matrix.1 The extension of filopodia and transportation of receptors to the tips of filopodia play important roles in cell adhesion, migration, and cell-to-cell communication.2,3 Furthermore, filopodia induced proteins such as fascin and myosin-X can regulate the survival, proliferation, and migration of disseminated cancer cells. Often, an increased density of filopodia is observed in cancer cells.4 Therefore, the detection of filopodia is important in cancer diagnostics. In spite of their importance, filopodia are rarely studied because of their nanometer scale dimensions (200 to 400 nm wide and 5 to 35 μm long), which make them difficult to view by conventional optical microscopy. Until now, the detection of filopodia is only achieved by super resolution microscopy techniques such as total internal reflection fluorescence microscopy, scanning near field optical microscopy and all-dielectric metasurface imaging with laser scanning.5–7 The information on filopodia density and dimensions is then extracted using different computational algorithms such as FiloQuant,8 FiloDetect,9 and CellGeo.10 Nevertheless, the accuracy of these computational algorithms is poor at high concentration of cells, and the complex cell morphology increases the difficulty for filopodia detection. Furthermore, these computational image analysis methods are highly dependent on the microscope resolution, and the setup is usually expensive, difficult to be integrated with compact devices, and time consuming to capture high-resolution images. To overcome these issues, a 3D nanoplasmonic biosensor with microposts is proposed to detect filopodia with high sensitivity. To the best of our knowledge, this is the first study of filopodia detection using a nanoplasmonic biosensor.Nanoplasmonic biosensors can provide highly sensitive detection of small sized biological species.11,12 Nanoplasmonic sensors are based on light-induced oscillation of electrons in noble metal nanostructures to generate localized surface plasmons (LSPs). The resonance condition of surface plasmons is established when the frequency of the incident light matches the surface electrons oscillating against the restoring force of the positive nuclei. The binding of analytes on the surface plasmons will change the permittivity of the adjacent dielectric, resulting in the reduction of the restoring force for plasmonic oscillations and thus changing the plasmon resonance frequency. The high sensitivity of nanoplasmonic sensors is attributed to the induced LSPs which are tightly confined and enhanced at the surface of nanostructures, and thus highly sensitive to the change of the effective refractive index (RI) in the surrounding area.13,14 The shifts of the LSP resonance (LSPR) peak corresponding to the changes of the effective RI result from the biological samples in contact with the plasmonic sensors.15 LSPR biosensors using arrays of plasmonic gold (Au) nanodots,16 nanoholes,17 or nanogratings18 have been used for cell detection. However, it is much more difficult to detect filopodia as they are typically 200 to 400 nm wide, which are 50 times smaller than cells. It is expected that plasmon resonance peak shift due to filopodia will be much lower than that with cells, due to the nanometer scale of filopodia. Therefore, plasmonic biosensors with high refractive index sensitivity (RIS) and a large figure of merit (FOM) are needed to enhance the sensitivity of filopodia detection. The FOM value is defined as the ratio between the RIS and spectral linewidth. A high FOM represents high sensitivity and a distinguishable resonance peak.
Typically, the RIS and FOM of LSPR biosensors are limited to 400 nm per refractive index unit (RIU) and 4, respectively, because LSPR is a superradiant plasmon mode with a broad spectral linewidth. To increase the RIS and FOM of nanoplasmonic biosensors, quasi-3D and 3D asymmetrical nanostructures were investigated to generate additional Fabry–Perot resonance, plasmonic photonic crystal (PPC), and Fano resonance modes. For a sensor with Fabry–Perot resonance, the RIS and FOM of quasi-3D and 3D multilayer plasmonic nanostructures were increased to 465 nm per RIU and 9.2, respectively.19,20 A higher RIS and FOM of 1376 nm RIU−1 and 11.6, respectively, were achieved by a 3D PPC biosensor.21 Compared to those with Fabry–Perot resonance and PPC modes, a nanoplasmonic biosensor with Fano resonance demonstrated the highest FOM due to the coupling between the superradiant and subradiant plasmon modes, which narrowed the spectral linewidth by suppressing the radiation loss.22 To generate Fano resonance, symmetry breaking of plasmonic nanostructures is required.23 Split-ring24 and disk in ring25 structures had been fabricated by electron beam lithography (EBL) to generate Fano resonances with a FOM of 5.8 and 17, respectively. In addition, 3D nanoholes with vertical U-shaped split ring resonators (SRRs) patterned by focused ion beam lithography (FIBL) to introduce the subradiant plasmon mode were shown to have Fano resonance and a high FOM of 35.26 However, both EBL and FIBL are low throughput and high cost technologies for fabricating asymmetrical nanostructures over a large area. Instead, nanoimprint lithography (NIL) takes only a few minutes to fabricate the 3D asymmetrical nanostructures over a large area and is more suitable for producing nanoplasmonic biosensors for filopodia detection. Therefore, NIL has the advantage of providing low cost and high throughput technology for fabricating portable detection microsystems with nanoplasmonic biosensors.27–30 In this work, 3D symmetrical and asymmetrical nanopillars were developed and fabricated by NIL. 3D asymmetrical nanopillars with sloped sidewall structures were formed and Fano resonance was observed. Such a nanoplasmonic biosensor had a high sensitivity and FOM of 680 nm per RIU and 28.3, respectively.
To detect filopodia around cells, 3D nanoplasmonic biosensors with microposts were investigated to separate filopodia from the cell membrane, allowing filopodia that could reach the nanoplasmonic sensor to be detected. Typical plasmonic sensors are not applicable for detecting filopodia from cells because the signals from the cell membrane and filopodia are mixed together. When cells adhered to the plasmonic biosensors, the change of effective RI detected by the plasmonic biosensors is attributed to both the cell membrane and the filopodia because filopodia are protrusions from the cell membrane. This is also the reason why conventional electrical, mechanical, or optical biosensors cannot be utilized to detect filopodia. In this work, the mixed signals from the cell membrane and filopodia were isolated by the proposed 3D nanoplasmonic biosensors where the cell membrane was kept away from the plasmonic sensor by the microposts. The effects of the physical dimensions and chemical coatings of the microposts and nanoplasmonic sensors on the MC3T3 cell morphology and filopodia extension were studied. The detection of MC3T3 osteoblastic cell filopodia is important. For example, osteoblasts could promote breast cancer growth and migration into the bones.31,32 Although different types of cells have different dimensions and reactions in micro- and nano-structures, the proposed 3D nanoplasmonic biosensor with microposts could separate and detect filopodia from MC3T3 cell bodies. This paves the way for detection of filopodia for other cell types as well. In this study, the 3D nanoplasmonic biosensor with microposts was used to detect the filopodia of MC3T3 cells at a concentration of 1300 cells per mm2. The nanoplasmonic biosensor was able to detect filopodia with a large peak shift of 6 nm, resulting from a filopodium surface area of 13 μm2 mm−2 and 9 filopodia per mm2.
2. Experiments and methods
2.1 Fabrication of nanopillars with vertical sidewalls
SU-8 nanopillars with vertical sidewalls were fabricated on a silicon (Si) substrate using NIL with simultaneous thermal and ultraviolet (UV) photon (STU) exposure. A flexible intermediate polymer stamp (IPS) with 280 nm wide and 500 nm deep nanoholes with a 535 nm pitch were used for NIL. The fabrication details of the IPS were described in our previous paper.33 After the IPS was prepared, Si substrates (12 × 15 mm2) were rinsed with acetone, isopropanol, and deionized (DI) water for 20 min each to remove organic residues from the Si surface, and dehydrated at 150 °C for 3 min. Subsequently, the samples were treated with an O2 plasma with 20 sccm O2, at 10 mTorr, and 100 W radio frequency (RF) power to make the Si surface hydrophilic, followed by 300 nm thick SU-8 photoresist coating. The SU-8 photoresist was baked at 65 °C and 95 °C for 2 min each, and imprinted using the IPS stamp at 90 °C and 30 bar, under 365 nm UV exposure with a power intensity of 40 mW cm−2 for 60 s. The SU-8 nanopillars with a 280 nm width, 535 nm pitch, and 500 nm depth, and vertical sidewalls were formed after demolding the IPS at 20 °C, followed by hard baking at 150 °C for 10 min. Finally, 2 nm chromium (Cr) and 50 nm Au films were thermally evaporated on the top, bottom, and sidewalls of the SU-8 nanopillars with vertical sidewalls at a pressure of 10−5 Torr to generate the 3D nanoplasmonic biosensor. The evaporation pressure was a little bit higher than normal so that the metal films also deposited onto the nanopillar sidewalls.2.2 Fabrication of nanopillars with sloped sidewalls
To fabricate nanopillars with sloped sidewalls, the demolding process of NIL needed to be adjusted compared to that for fabricating nanopillars with vertical sidewalls. The IPS with 280 nm wide and 500 nm deep nanoholes with a 535 nm pitch was used as a stamp to imprint SU-8 photoresist on Si. After imprinting SU-8 at 90 °C and 30 bar, under 365 nm UV exposure with a power intensity of 40 mW cm−2 for 60 s, the IPS was demolded at an angle off the vertical direction at a higher temperature of 80 °C. Typically, imprint technology involves demolding the stamp vertically from the polymer after it is crosslinked at 20 °C. However, in order to generate nanopillars titled at an angle with sloped sidewalls, the demolding temperature was increased to 80 °C and the stamp was separated from the polymer with an angle off the normal incidence. This demolding angle determined the slope of the sidewalls, while the higher demolding temperature made it easier to form the sloped nanopillars. After cooling to 20 °C, SU-8 nanopillars with sloped sidewalls were generated on Si, as shown in Fig. S1.† Subsequently, the SU-8 nanopillars with sloped sidewalls were hard baked at 150 °C for 10 min. The residue layer was removed by using a reactive ion etching (RIE) system with 50/2 sccm O2/SF6, at 10 mTorr, and 100 W RF power for 15 s. The SU-8 nanopillars with sloped sidewalls were then used as an etch mask to etch the Si substrate using a deep RIE system with 37/70 sccm SF6/C4F8, at 10 mTorr, 600 W coil power, and 10 W platen power for 90 s. After removing the SU-8 etch mask using an O2 plasma with 20 sccm O2, at 10 mTorr, and 100 W RF power for 5 min, a Si stamp with nanopillars and sloped sidewalls was generated.This Si stamp had unique features of nanopillars with sloped sidewalls, and dimensions of 200 nm on the top and 280 nm on the bottom of the nanopillars to form a slope of 64°, 535 nm pitch, and 360 nm depth. The Si stamp was then treated with trichloro(1H,1H,2H,2H-perfluorooctyl)silane to reduce its surface energy to 25 mN m−1, followed by thermal NIL at 150 °C and 40 bar for 120 s to replicate the Si master stamp into a working IPS. This replicated IPS was used to produce SU-8 nanopillars with sloped sidewalls using STU exposure. Finally, 2 nm Cr and 50 nm Au films were thermally evaporated on the top, bottom, and sidewalls of the sloped SU-8 nanopillars at a pressure of 10−5 Torr to generate a 3D nanoplasmonic biosensor with sloped sidewalls.
2.3 Integrating microposts with the nanoplasmonic biosensors
Microposts were integrated with the nanoplasmonic biosensors in 3D micro- and nano-structures by hybrid NIL and photolithography. After the nanoplasmonic biosensors with vertical or sloped sidewalls were fabricated by NIL as described above, they were treated with an O2 plasma with 20 sccm O2, at 10 mTorr, and 100 W RF power for 35 s. Subsequently, 5 μm thick SU-8 2005 photoresist was coated on top of the nanoplasmonic biosensor and prebaked at 65 °C and 95 °C for 2 and 3 min, respectively. SU-8 microposts with different dimensions were then patterned by optical lithography with 365 nm UV photons for 7 s, followed by post baking at 95 °C for 5 min. The samples were then developed in the SU-8 developer for 40 s and soaked in isopropanol for 10 s to generate SU-8 microposts. After hard baking at 150 °C for 10 min, 3D microposts on top of the nanoplasmonic biosensors were formed. Fig. S2† shows the micrographs of the 3D microposts above the nanoplasmonic biosensors with vertical and sloped sidewalls.2.4 Measurements of refractive index sensitivity
The RIS of the 3D nanoplasmonic biosensors with microposts was measured using a UV-visible-near infrared spectrophotometer (SolidSpec-3700). A 45° incident light source with a wavelength of 400–2400 nm was used to illuminate the 3D nanoplasmonic biosensors, and reflection spectra were collected by using a photomultiplier tube as well as lead sulphide and indium gallium arsenide photodetectors. The RIS of the nanoplasmonic biosensors was measured by immersing the sensors in the following media: air (n = 1.00) and certified RI liquids with values of 1.30, 1.31, 1.32, and 1.33. The resonance peak shifts due to filopodia at different cell concentrations were calculated by comparing the reflection spectra with and without cells. The detection area of the 3D nanoplasmonic biosensor was 50 mm2.2.5 Fibronectin coating process
In some cases, before cell seeding, the 3D microposts and the nanoplasmonic biosensors were coated with fibronectin (FN) to modify the surface properties. To prepare for the inking of FN on the sensors, a 3 mm thick, flat polydimethylsiloxane (PDMS) soft pad was first treated with an O2 plasma with 10 sccm O2, at 80 mTorr, and 30 W RF power for 10 s, followed by incubating with FN (50 μg ml−1 in DI water) in a 4 °C refrigerator for 3 h. The PDMS soft pad with FN was rinsed in DI water and dried with N2. The sensor platforms with the micro- and nano-structures were also treated with an O2 plasma with 10 sccm O2, at 80 mTorr, and 80 W RF power for 30 s, followed by inking using the FN coated PDMS soft pad on top of the microposts. The entire sensor platform was then immersed in 70% ethanol and rinsed in phosphate-buffered saline (PBS) twice to wash away the excess FN, leaving only a FN coating on top of the microposts. The coating of FN on top of the nanopillars was performed using similar technology. To coat FN all over the microposts, the microposts were immersed in FN (50 μg ml−1 in DI water) for 3 h.342.6 Cell culture and seeding
MC3T3 osteoblastic cells were obtained from the American Type Culture Collection (ATCC number CRL-2594) and maintained in Dulbecco's modified Eagle's medium (DMEM) with 10% fetal bovine serum (Gibco, MD, U.S.A.) at 37 °C and 5% CO2. The DMEM culture medium was changed every 3 days. Before seeding MC3T3 cells on the sensor platforms, they were trypsinized for detachment with 0.05% weight/volume (w/v) trypsin for 8 min. MC3T3 cells at different concentrations were loaded onto the surface of the sensor platforms and maintained in DMEM at 37 °C and 5% CO2. After 6 h, the DMEM culture medium was removed and the attached MC3T3 cells were rinsed with PBS twice, followed by adding 4% w/v paraformaldehyde (PFA, Sigma-Aldrich, WI, USA) for 15 min to fix the cells at room temperature for scanning electron microscopy.2.7 Cell imaging using scanning electron microscopy
To observe the cell morphology and filopodia extension on the 3D microposts and nanoplasmonic biosensors, a field emission scanning electron microscope (SEM) (SU5000 FE-SEM, Hitachi, Japan) was used to capture high resolution images of the fixed MC3T3 cells on different sensor platforms. After the cells were fixed, the platforms were washed with PBS three times and then the PBS was replaced by a graded series of ethanol (30%, 50%, 70%, 80%, 90%, 95%, and 100%). A critical point dryer (EM CPB3000, Leica, Germany) was used to supercritically dry the cells and reduce the artifacts created by surface tension. A thin layer of Au was coated on the samples using a thin film coater (Q150 coater, Quorum Technologies Ltd., UK) to avoid charging. ImageJ software was used to compute the surface area and number of filopodia on the nanoplasmonic biosensors.3. Results and discussion
3.1 MC3T3 cell morphology and filopodia extension on the microposts and nanoplasmonic sensors
The key difficulties of detecting the thin finger-like filopodia of MC3T3 cells include the fact that: 1) filopodia are part of the cell membrane and hard to be detected separately and 2) filopodia are thin protrusions that are 200–400 nm wide and 5–30 μm long. The small size and surface area make it hard to detect filopodia using low sensitivity sensors. To solve these issues, 3D microposts and nanoplasmonic biosensors are proposed as shown in Fig. 1. The supporting microposts were engineered to keep the cell body and its membrane on top of the microposts, and only the thin filopodia could extend through the gaps between the microposts to the detection area of the nanoplasmonic biosensor below the microposts. The function of the microposts was to separate the cell membrane from the filopodia. Since the detection length of the plasmonic biosensor was limited to ∼100 nm, only the extended filopodia of MC3T3 cells that could make contact with the nanoplasmonic biosensor would be detected.35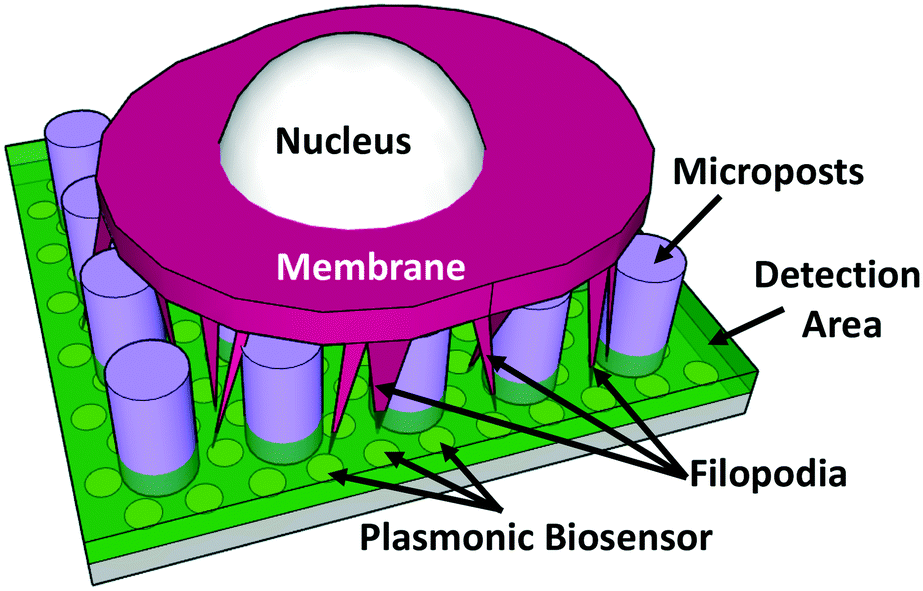 | ||
| Fig. 1 Schematic of the 3D nanoplasmonic biosensor with microposts for the detection of filopodia. | ||
The effects of the dimensions of the nanoplasmonic pillars on filopodium outgrowth and contact with the sensor were investigated, as shown in Fig. 2. Fig. 2(a) shows the schematic of a cell membrane on top of the nanopillars with the filopodia reaching down through the nanopillars to the bottom of the plasmonic biosensor. MC3T3 cell morphology and filopodium extension on a flat SU-8/Si surface is shown in Fig. 2(b). The surface of SU-8 was treated with an O2 plasma with 10 sccm O2, at 80 mTorr, and 80 W RF power for 30 s to make the surface hydrophilic, followed by coating with FN to further enhance cell adhesion. As shown in Fig. 2(e and f), the MC3T3 cells spread on the flat surface of SU-8 had 13 filopodia per cell and a length of 3 μm, respectively. For the cells on the SU-8 nanopillars that were 280 nm wide and 500 nm deep with a 255 nm gap, as shown in Fig. 2(c), the number of filopodia per cell and length became 26 and 11.5 μm, respectively. These results showed that nanopillars could promote filopodium generation and outgrowth. However, nanopillars with a 255 nm gap did not allow filopodia to reach down to the bottom surface between the nanopillars. All the filopodia extended and suspended on top of the nanopillars, even though the gap of 255 nm was slightly larger than the width of the filopodia.
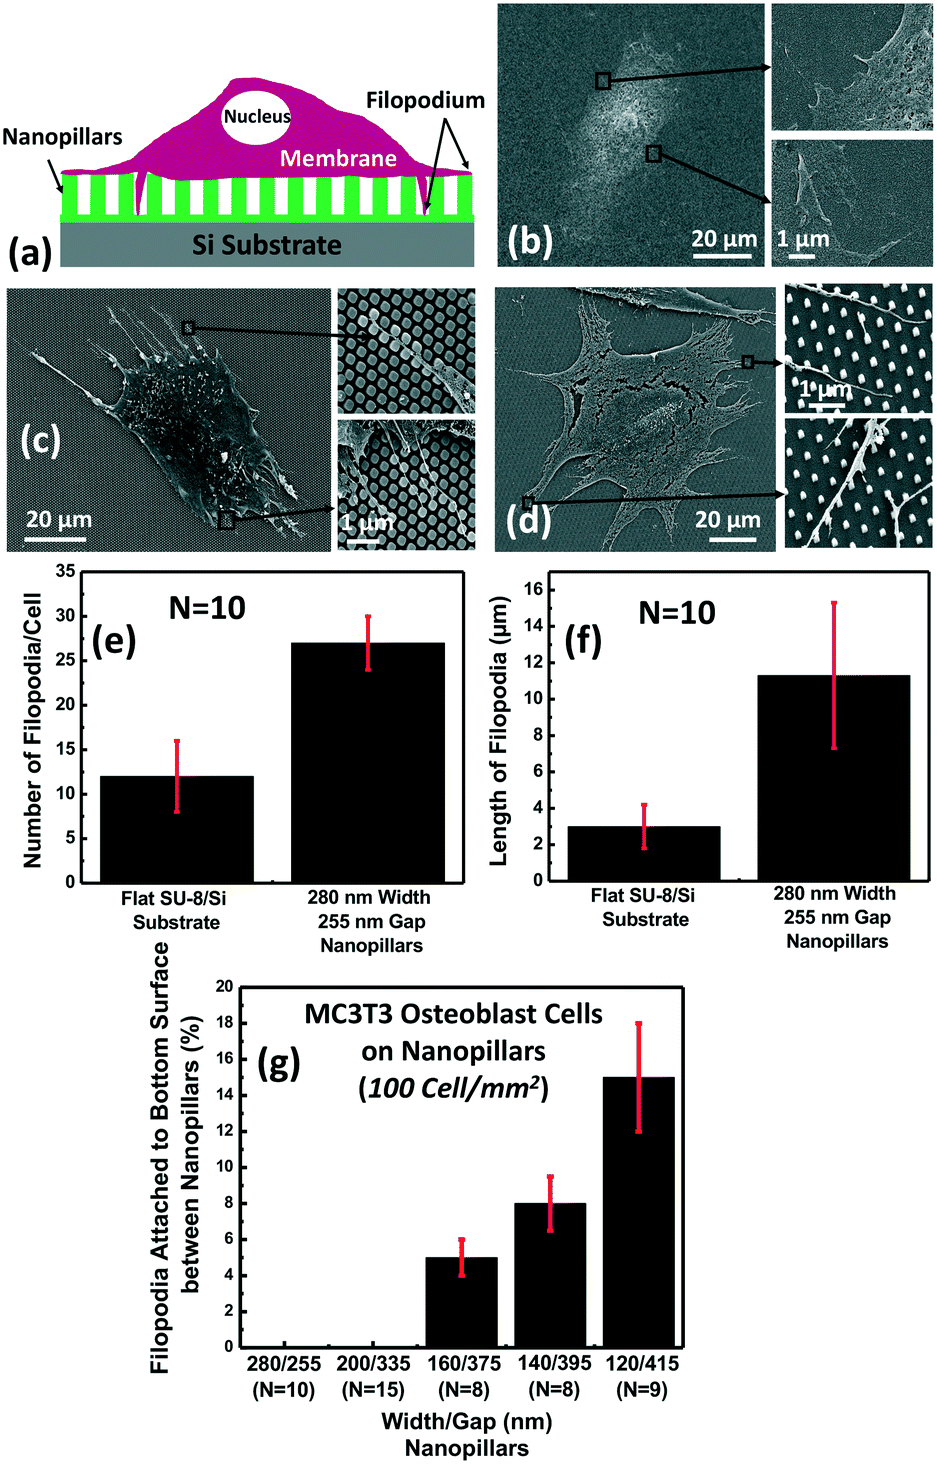 | ||
| Fig. 2 (a) Schematic of the cell morphology and filopodium extension on nanopillars. Micrographs of MC3T3 cells on a (b) flat SU-8/Si substrate, (c) SU-8 nanopillars with a 280 nm width, 535 nm pitch, and 500 nm depth, and (d) SU-8 nanopillars with a 120 nm width, 535 nm pitch, and 350 nm depth. (e) Number of filopodia per cell and (f) length of filopodia on the flat substrate and SU-8 nanopillars with a 280 nm width, 535 nm pitch, and 500 nm depth. (g) Percentage of filopodia attached to the bottom surface between nanopillars with different gaps. | ||
In order to promote the extension of filopodia to the bottom surface between the nanopillars, the gaps between the nanopillars were increased to 415 nm. As shown in Fig. 2(d), while the cell membrane spread on top of the nanopillars, some of the filopodia attached to the bottom surface between the nanopillars. However, most of the filopodia still attached to the top of the nanopillars and extended over the top surface of the nanopillars. With increasing nanopillar gap size from 255 to 415 nm, the percentage of filopodia attached to the bottom surface between the nanopillars increased from 0% to 15% as shown in Fig. 2(g). These results showed that the nanopillars with a 415 nm gap allowed 15% of the filopodia to extend to the bottom surface between the nanopillars.
To separate filopodia from the cell membrane, microposts were fabricated on top of the nanopillars, and different surface coatings were applied to study their effectiveness to separate the cell membrane from the extended filopodia. As shown in Fig. 3(a), using microposts with a 3.1 μm diameter (dia.), 4 μm gap, and 5 μm depth as the supporting structures, more than 88% of the micropost sidewalls were covered by the cell membrane when the microposts were not coated, as indicated in Fig. 3(d). In this situation, the cell membrane and the filopodia could not be separated by the microposts because the cell membrane could still spread to the bottom surface between the nanopillars. This was not desirable since the nanoplasmonic biosensor signal would be influenced by both the cell membrane and the filopodia. Fig. 3(b) shows the cell morphology on similar microposts but with FN coated all over the platform. Compared to no FN coating, having FN coated all over the platform reduced the cell membrane coverage on the sidewalls of the microposts. The cell membrane covered 52% of the micropost sidewalls up to 2.5 μm below the top of the microposts as shown in Fig. 3(d). Now, the cell membrane and the filopodia were partially separated by the microposts. Since the detection length of the plasmonic biosensor was around 100 nm, the nanopillars below the microposts would detect mainly the extended filopodia and not the cell membrane. To further reduce the cell membrane coverage on the micropost sidewalls, FN was coated only on top of the microposts as shown in Fig. 3(c). The coverage of the micropost sidewalls was further reduced to 30% as indicated in Fig. 3(d). In this case, only filopodia could reach the bottom surface between the nanopillars. Since microposts coated with FN on the top surfaces had the lowest sidewall coverage by the cell membrane, all the filopodia detection measurements were carried out by coating FN only on top of the microposts.
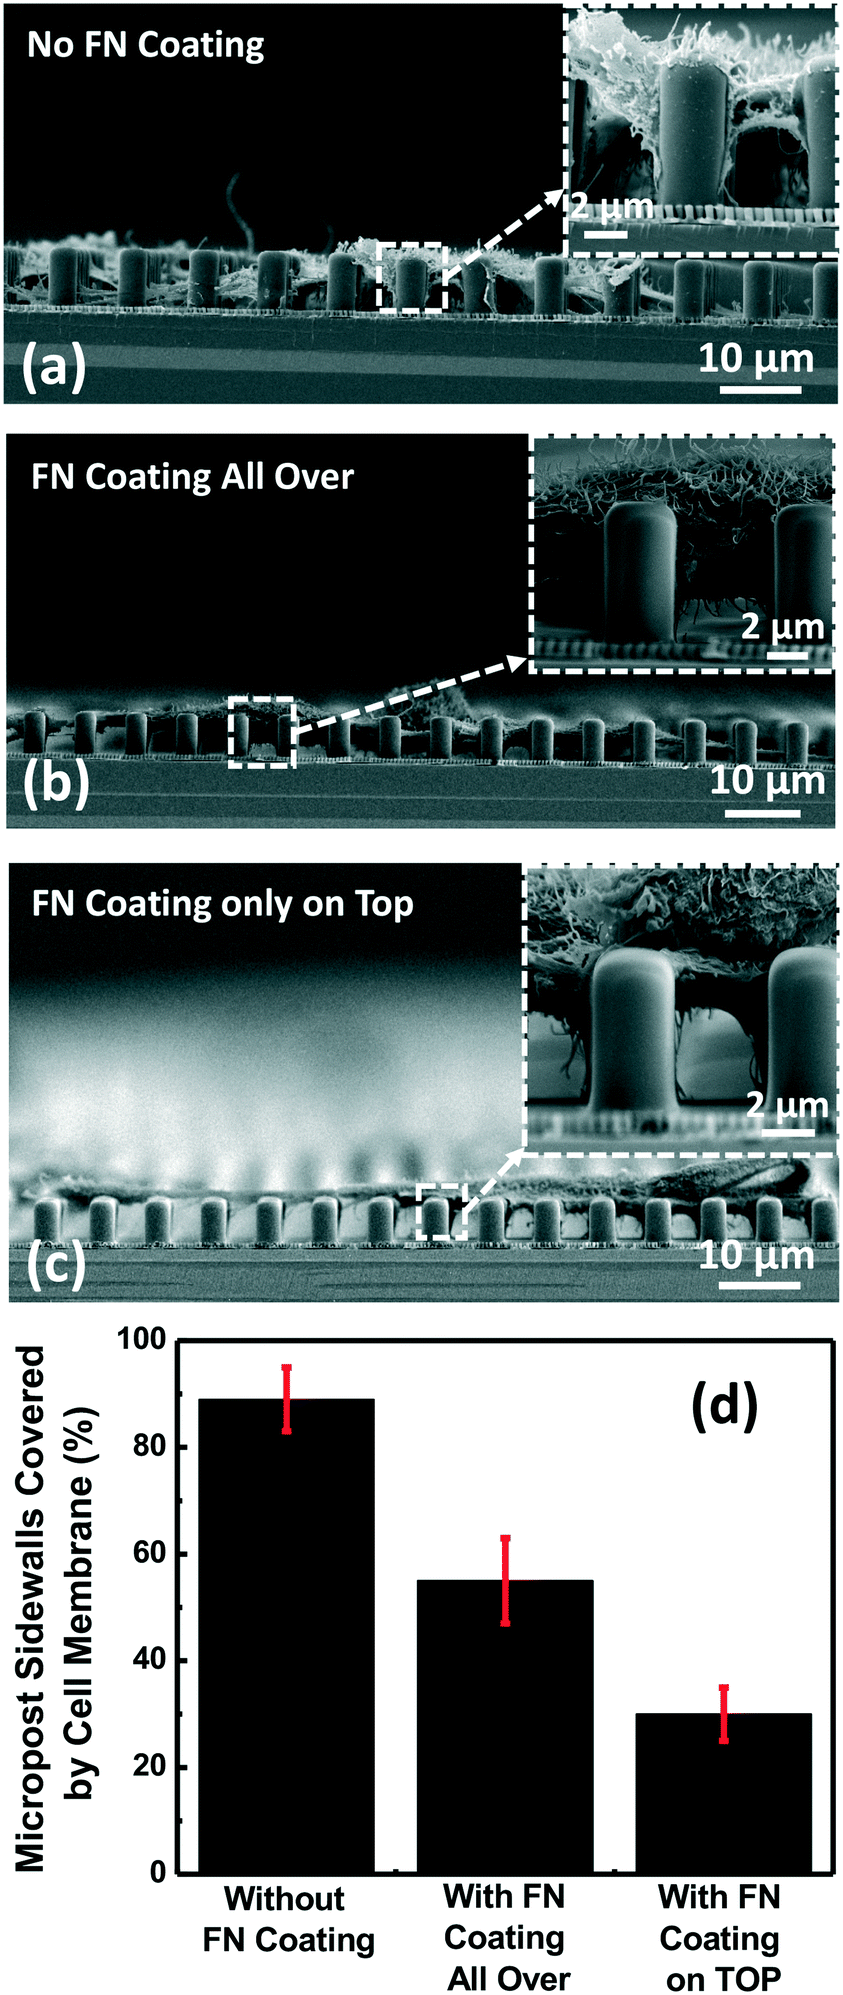 | ||
| Fig. 3 Micrographs of microposts with a 3.1 μm dia., 4 μm gap, and 5 μm depth on nanopillars with a 280 nm width, 535 nm pitch and 500 nm depth covered by MC3T3 cells with (a) no FN coating, (b) FN coating all over, and (c) FN coating only on top of the microposts. (d) Percentage of micropost sidewalls covered by MC3T3 cell membrane under the different coating conditions. | ||
Besides the surface coating effect, the dimensions of microposts were also investigated for their influence on filopodia generation and extension. As shown in Fig. 4(a–c), MC3T3 cell spreading and filopodia outgrowth were different on microposts with different dimensions. Fig. 4(d and e) show that for microposts with a 3.2 μm dia. and 4.7 μm gap, the number of filopodia per cell and length were 12 and 15 μm, respectively. When the density of the microposts was increased to 2.2 μm dia. and 3.2 μm gap, more filopodia were formed but the length of filopodia decreased with the smaller gap size. As the density of microposts was increased further to 2 μm dia. and 2 μm gap, the number of filopodia decreased to 19 and the length of filopodia decreased to 8 μm because there was limited space in between the microposts for filopodia extension. For microposts with a 2.2 μm dia. and 3.2 μm gap, the highest number of filopodia (23) was observed while the length of filopodia was 11 μm. Therefore, the optimal dimensions of the microposts were 2.2 μm dia. and 3.2 μm gap on nanopillars with FN coating only on top of the microposts. Under this configuration, they provided efficient separation of cell membrane from filopodia, while still allowing the highest number of filopodium outgrowths with a reasonable length for MC3T3 cells.
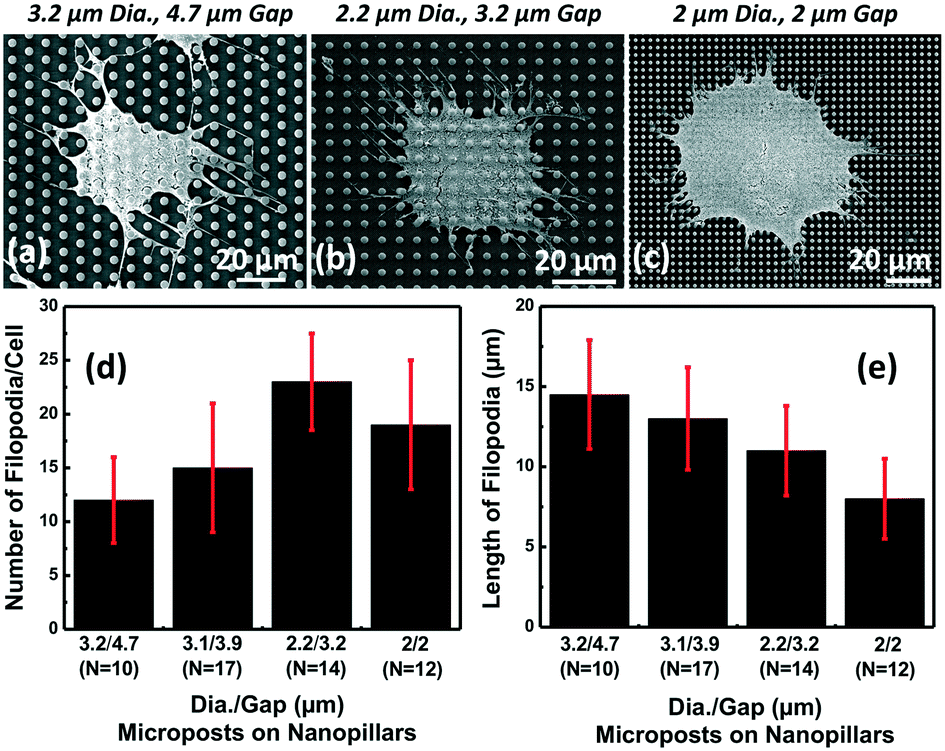 | ||
| Fig. 4 Micrographs of MC3T3 cells on 5 μm deep microposts with a (a) 3.2 μm dia. and 4.7 μm gap, (b) 2.2 μm dia. and 3.2 μm gap, and (c) 2 μm dia. and 2 μm gap on nanopillars with a 280 nm width, 535 nm pitch and 500 nm depth. (d) Number of filopodia per cell and (e) length of filopodia on micro- and nano-structures with different dimensions. | ||
3.2 3D plasmonic nanopillars with vertical and sloped sidewalls
Fig. 5(a and b) show the micrographs of the top and side views of 3D plasmonic nanopillars with vertical sidewalls. The vertical sidewall nanopillars were 280 nm wide and 500 nm deep with a 535 nm pitch. As we have shown in Fig. 2(c), the filopodia of MC3T3 cells spread on top of the nanopillars with a 255 nm gap. However, when the MC3T3 cells were supported by the microposts on nanopillars, their filopodia could extend to the sidewalls and bottom surface of the nanopillars with a 255 nm gap, as shown in Fig. S3.† To allow detection of filopodia by the entire surface area of the plasmonic nanopillars, 2/50 nm Cr/Au films were deposited on top, the bottom, and a part of the vertical sidewalls of the nanopillars, as shown in Fig. 5(a and b). With the additional Au nanoparticles on the sidewalls of the nanopillars, four resonance peaks at 495, 550, 710, and 991 nm were observed in the reflection spectra of the plasmonic nanopillars with vertical sidewalls, as shown in Fig. 5(c). Fig. 5(d) shows the peak shift of the resonance peak at 991 nm as the RI in the surrounding area varied from 1.30 to 1.33. The measured sensitivity of the resonance peaks at 495, 550, 710, and 991 nm were 45, 130, 260, and 360 nm per RIU, respectively. The full width at half maximum of the resonance peak at 991 nm was 327 nm and its FOM was calculated to be 1.1. This result showed that the 3D symmetrical nanopillars with vertical sidewalls generated LSPR superradiant mode and Fabry–Perot mode with a low FOM of 1.1.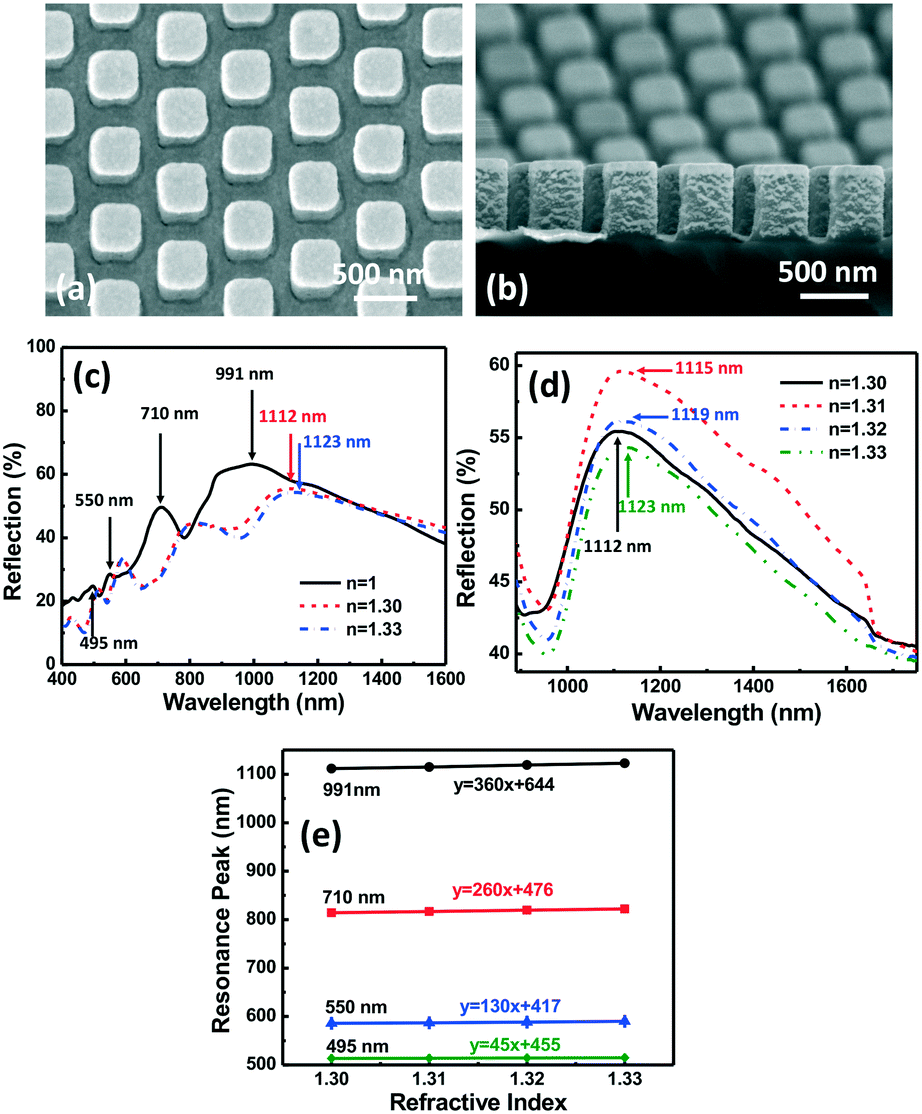 | ||
| Fig. 5 Micrographs of the (a) top and (b) side views of the 3D nanopillars (280 nm width, 535 nm pitch, and 500 nm depth) with vertical sidewalls. (c and d) Reflection spectra of the nanopillars with vertical sidewalls in different refractive index surroundings. (e) Resonance peak position as a function of refractive index for the nanopillars with vertical sidewalls. | ||
To further enhance the sensitivity and FOM of the nanoplasmonic biosensor, 3D asymmetrical nanopillars with sloped sidewalls were used to break the symmetry to generate Fano resonance, as shown in Fig. 6. An IPS with 280 nm wide and 500 nm deep nanoholes with a 535 nm pitch was imprinted into SU-8 on Si and demolded at an angle off the vertical direction to generate the sloped SU-8 nanopillars as described earlier. After removing the residual layer, the sloped SU-8 nanopillars were used as an etch mask to etch the Si substrate which resulted in a Si stamp with sloped nanopillars. The Si stamp was transferred to an IPS. Using the IPS, asymmetrical plasmonic nanopillars with sloped sidewalls were patterned in SU-8, followed by coating with 2/50 Cr/Au films as shown in Fig. 7(a and b). For the nanopillars with vertical sidewalls, the Au nanostructures on top, the bottom and the sidewalls could generate LSPR and Fabry–Perot modes.33 In comparison, the Au nanostructures on top and the bottom of the 3D asymmetrical nanopillars generated the LSPR superradiant plasmon mode, and the Au nanostructures along the sloped sidewalls induced the subradiant plasmon mode due to out of plane excitation.36 The coupling between the superradiant and subradiant plasmon modes in the 3D asymmetrical nanopillars with sloped sidewalls generated the Fano resonance mode to increase the sensitivity and FOM of the sensor. Fig. 7(c–e) show the reflection spectra and sensitivity of the asymmetrical plasmonic nanopillars with sloped sidewalls. Two resonance peaks at 581 and 905 nm and a valley at 764 nm were observed with a sensitivity of 260, 540, and 650 nm per RIU, respectively. The sharp resonance valley at 764 nm with an asymmetrical line profile was a Fano resonance and resulted in a high FOM of 28.3. Compared to the FOM of the nanopillars with vertical sidewalls, an improvement of 25 times was achieved by the nanopillars with sloped sidewalls due to the asymmetrical Au nanostructures formed by the sloped sidewalls of the nanopillars. Therefore, the 3D nanoplasmonic biosensor with a sharp Fano resonance valley at 764 nm was useful for filopodia detection with high sensitivity.
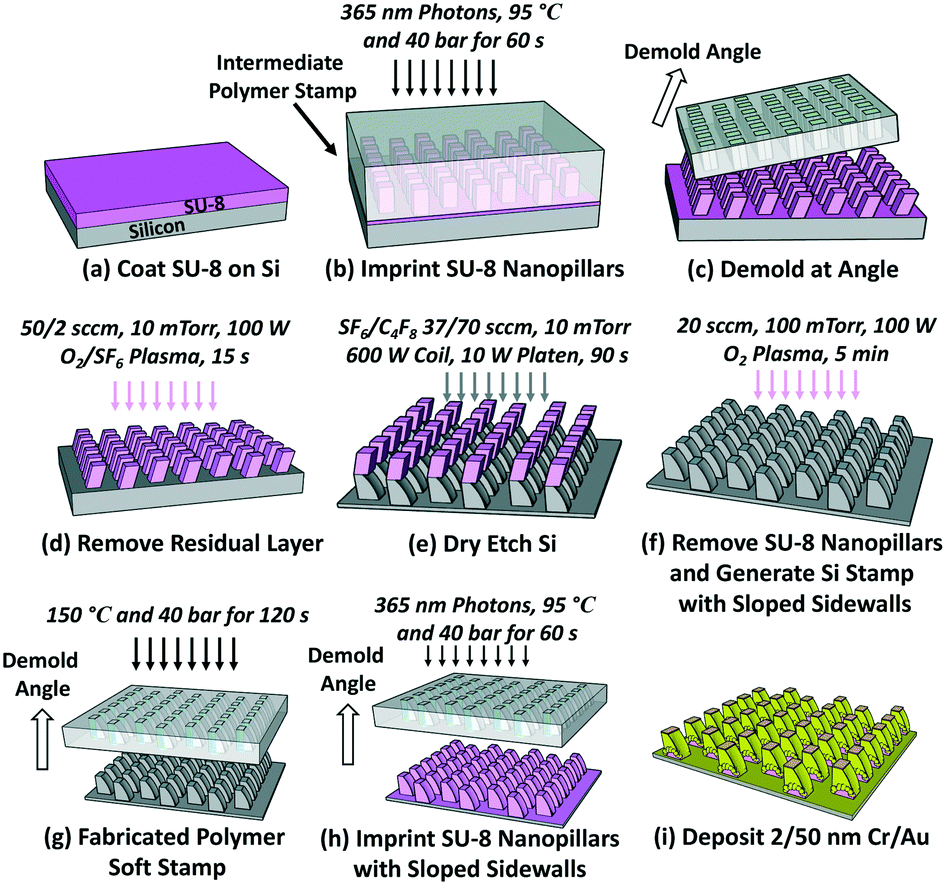 | ||
| Fig. 6 Fabrication technology for the 3D asymmetrical nanopillars (200 nm on top, 280 nm on the bottom, 64° slope, 535 nm pitch, and 360 nm depth) with sloped sidewalls. | ||
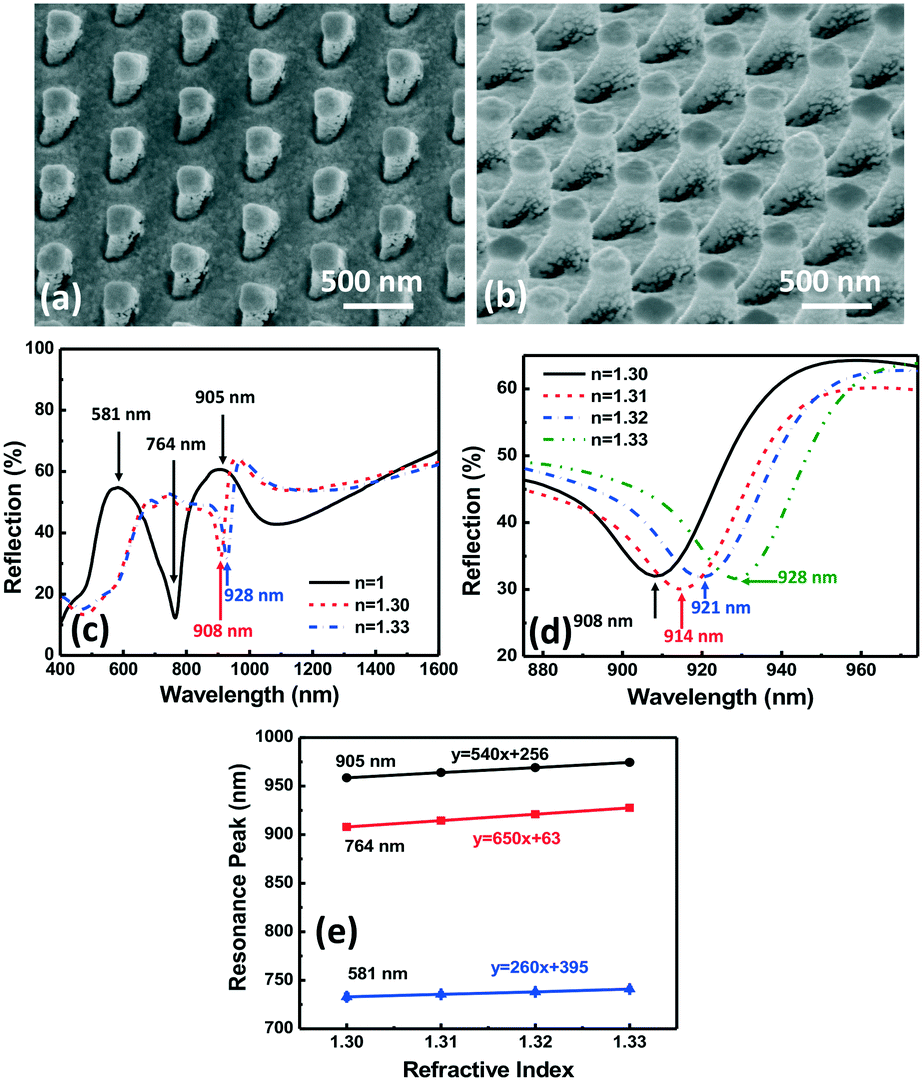 | ||
| Fig. 7 Micrographs of the (a) top and (b) side views of the 3D asymmetrical nanopillars with sloped sidewalls. (c and d) Reflection spectra of the 3D asymmetrical nanopillars with sloped sidewalls in different refractive index surroundings. (e) Resonance peak position as a function of refractive index for the 3D asymmetrical nanopillars with sloped sidewalls. | ||
3.3 Detection of filopodia using the 3D nanoplasmonic biosensor with microposts
Filopodia from MC3T3 cells were detected by the 3D nanopillars with sloped sidewalls with micropost support to separate the cell membrane from the filopodia. The 3D nanopillars were 200 nm on top and 280 nm on the bottom, with a 64° slope, 535 nm pitch, and 360 nm depth, and the microposts had a 2.2 μm dia., 3.2 μm gap, and 5 μm depth. As described earlier, since the MC3T3 cell membrane spread on top of the microposts, only the filopodia could extend to the nanopillars below for them to be detected by the 3D plasmonic biosensor. As shown in Fig. 8(a–c), MC3T3 cells at cell concentrations of 50, 586, and 1423 cells per mm2 were seeded on top of the microposts with the nanoplasmonic biosensor below. Fig. 8(d–f) show the side view of MC3T3 cells at similar concentrations, indicating some filopodia reaching down the nanopillars. The high resolution micrographs in Fig. 8(a–f) also show that mainly filopodia were attached on the surface of the 3D nanoplasmonic biosensor.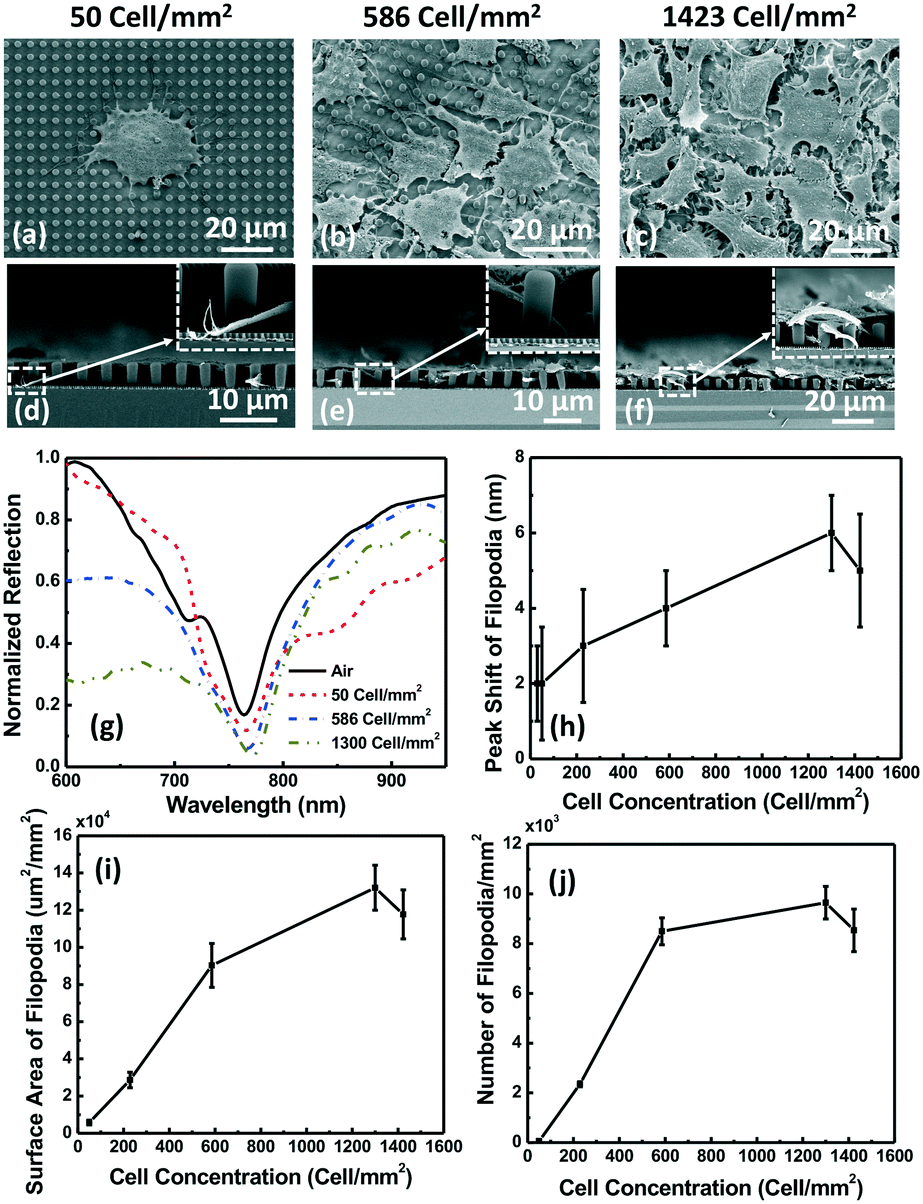 | ||
| Fig. 8 Micrographs of MC3T3 cells at (a) 50, (b) 586, and (c) 1423 cells per mm2 on 3D microposts (2.2 μm dia., 3.2 μm gap, 5 μm depth) and nanoplasmonic biosensors (200 nm on top, 280 nm on the bottom, 64° slope, 535 nm pitch, 360 nm depth). Their side views are shown in (d–f). (g) Normalized reflection spectra from 3D nanoplasmonic sensors with microposts at different cell concentrations. (h) Resonance peak shift due to filopodia extensions at different cell concentrations. (i) Surface area and (j) number of filopodia on 3D nanoplasmonic biosensors with microposts at different cell concentrations. | ||
Fig. 8(g) shows that the resonance peak shifts due to the filopodia outgrowth at cell concentrations of 50, 586, and 1300 cells per mm2 were 2, 4, and 6 nm, respectively. Fig. 8(h) shows the peak shift of filopodia as a function of MC3T3 cell concentration. As shown in Fig. 8(h), the highest peak shift of 6 nm was observed for filopodia at a cell concentration of 1300 cells per mm2. When the cell concentration was increased further to 1423 cells per mm2, the MC3T3 cells achieved 100% confluency on the microposts and the filopodia outgrowth was partially limited. Fig. 8(i and j) show the surface area of filopodia and the number of filopodia at different cell concentrations. The results show that the largest surface area and number of filopodia were 13 μm2 mm−2 and 9 mm−2, respectively, for a cell concentration of 1300 cells per mm2.
4. Conclusions
A 3D nanoplasmonic biosensor with microposts was proposed to separate filopodia from the MC3T3 cell membrane so that the filopodia alone could be detected by the highly sensitive nanoplasmonic sensor. The effects of the chemical coating and physical dimensions on the cell spreading and filopodia outgrowth of MC3T3 cells were studied. The results showed that microposts with FN coated only on the top surfaces could support the spreading of the cell membrane on top of the microposts and allow only the filopodia to grow towards the nanoplasmonic biosensor below. When the density of the microposts was increased from 3.2 μm dia. and 4.7 μm gap to 2 μm dia. and 2 μm gap, the length of filopodia was decreased from 15 μm to 8 μm because the higher micropost density limited the space for filopodia outgrowth. The microposts with a 2.2 μm dia. and 3.2 μm gap showed the highest number of filopodia, 23, and they were chosen for filopodia separation from the cell membrane. 3D nanopillars with vertical and sloped sidewalls were fabricated by nanoimprint technology. Nanopillars with sloped sidewalls demonstrated Fano resonance with a high sensitivity and FOM of 650 nm per RIU and 28.3, respectively. The filopodia of MC3T3 cells at cell concentrations of 50, 586, and 1300 cells per mm2 resulted in resonance peak shifts of 2, 4, and 6 nm, respectively. For the highest peak shift of 6 nm at a cell concentration of 1300 cells per mm2, the surface area and number of filopodia were 13 μm2 mm−2 and 9 mm−2, respectively. These results will be helpful for understanding filopodium formation and this could be related to cell behaviors.9,31Author contributions
SZ and SWP conceived the project and designed the study. SWP provided the resources. SZ performed most of the experiments and analysed the data. MAE did some of the experiment. SZ did the investigation, validation, visualization, and wrote the original draft. SWP provided supervision, and reviewed and edited the manuscript.Conflicts of interest
There are no conflicts to declare.Acknowledgements
We gratefully acknowledge Miss Po-Yi Lam for culturing and seeding the MC3T3 osteoblastic cells. This work was supported by the Center for Biosystems, Neuroscience, and Nanotechnology (CBNN) of the City University of Hong Kong (9360148, 9380062), and the University Grants Council of Hong Kong (GRF Projects: 11247716, 11218017, 11213018, 11212519, and CRF project: C1013-15). We gratefully acknowledge all the members of the CBNN and the university cleanroom facilities for their help.References
- P. K. Mattila and P. Lappalainen, Nat. Rev. Mol. Cell Biol., 2008, 9, 446–454 CrossRef CAS PubMed.
- S. L. Gupton and F. B. Gertler, Sci. STKE, 2007, 2007, re5–re13 Search PubMed.
- G. Jacquemet, H. Hamidi and J. Ivaska, Curr. Opin. Cell Biol., 2015, 36, 23–31 CrossRef CAS PubMed.
- A. Arjonen, R. Kaukonen and J. Ivaska, Cell Adhes. Migr., 2011, 5, 421–430 CrossRef PubMed.
- V. Urbancic, R. Butler, B. Richier, M. Peter, J. Mason, F. J. Livesey, C. E. Holt and J. L. Gallop, J. Cell Biol., 2017, 216, 3405–3422 CrossRef PubMed.
- K. A. Walker, C. Morgan, S. H. Doak and P. R. Dunstan, PLoS One, 2012, 7, e31592–e31600 CrossRef CAS PubMed.
- D. Lee, M. Kim, J. Kim, H. Hong, T. Badloe, D. Sung Kim and J. Rho, Opt. Mater. Express, 2019, 9, 3248–3259 CrossRef CAS.
- G. Jacquemet, I. Paatero, A. F. Carisey, A. Padzik, J. S. Orange, H. Hamidi and J. Ivaska, J. Cell Biol., 2017, 216, 3387–3403 CrossRef CAS PubMed.
- S. Nilufar, A. A. Morrow, J. M. Lee and T. J. Perkins, BMC Syst. Biol., 2013, 7, 66–78 CrossRef PubMed.
- D. Tsygankov, C. G. Bilancia, E. A. Vitriol, K. M. Hahn, M. Peifer and T. C. Elston, J. Cell Biol., 2014, 204, 443–460 CrossRef CAS PubMed.
- M. I. Stockman, Science, 2015, 348, 287–288 CrossRef CAS PubMed.
- F. Yesilkoy, R. A. Terborg, J. Pello, A. A. Belushkin, Y. Jahani, V. Pruneri and H. Altug, Light: Sci. Appl., 2018, 7, 17152–17161 CrossRef PubMed.
- V. Amendola, R. Pilot, M. Frasconi, O. M. Marago and M. A. Iati, J. Phys.: Condens. Matter, 2017, 29, 203002–203050 CrossRef PubMed.
- J. N. Anker, W. P. Hall, O. Lyandres, N. C. Shah, J. Zhao and R. P. Van Duyne, Nat. Mater., 2008, 7, 442–453 CrossRef CAS PubMed.
- T. Xue, W. Liang, Y. Li, Y. Sun, Y. Xiang, Y. Zhang, Z. Dai, Y. Duo, L. Wu, K. Qi, B. N. Shivananju, L. Zhang, X. Cui, H. Zhang and Q. Bao, Nat. Commun., 2019, 10, 07949–07955 Search PubMed.
- S.-W. Lee, K.-S. Lee, J. Ahn, J.-J. Lee, M.-G. Kim and Y.-B. Shin, ACS Nano, 2011, 5, 897–904 CrossRef CAS PubMed.
- J. A. Jackman, E. Linardy, D. Yoo, J. Seo, W. B. Ng, D. J. Klemme, N. J. Wittenberg, S. H. Oh and N. J. Cho, Small, 2016, 12, 1159–1166 CrossRef CAS PubMed.
- J. S. Wi, S. Lee, S. H. Lee, D. K. Oh, K. T. Lee, I. Park, M. K. Kwak and J. G. Ok, Nanoscale, 2017, 9, 1398–1402 RSC.
- S. Zhu, H. Li, M. Yang and S. W. Pang, Nanotechnology, 2018, 29, 365503–365516 CrossRef PubMed.
- W. Li, X. Jiang, J. Xue, Z. Zhou and J. Zhou, Biosens. Bioelectron., 2015, 68, 468–474 CrossRef CAS PubMed.
- S. Zhu, H. Li, M. Yang and S. W. Pang, Nanoscale, 2018, 10, 19927–19936 RSC.
- W. Zhou and T. W. Odom, Nat. Nanotechnol., 2011, 6, 423–427 CrossRef CAS PubMed.
- S. Kasani, K. Curtin and N. Wu, Nanophotonics, 2019, 8, 2065–2089 CAS.
- Y. K. Srivastava, M. Manjappa, H. N. S. Krishnamoorthy and R. Singh, Adv. Opt. Mater., 2016, 4, 1875–1881 CrossRef CAS.
- Y. H. Fu, J. B. Zhang, Y. F. Yu and B. Luk'yanchuk, ACS Nano, 2012, 6, 5130–5137 CrossRef CAS PubMed.
- A. Cui, Z. Liu, J. Li, T. H. Shen, X. Xia, Z. Li, Z. Gong, H. Li, B. Wang, J. Li, H. Yang, W. Li and C. Gu, Light: Sci. Appl., 2015, 4, e308–e314 CrossRef CAS.
- L. R. Bao, X. Cheng, X. D. Huang, L. J. Guo, S. W. Pang and A. F. Yee, J. Vac. Sci. Technol., B: Microelectron. Nanometer Struct.--Process., Meas., Phenom., 2002, 20, 2881–2886 CrossRef CAS.
- C. Peng, B. L. Cardozo and S. W. Pang, J. Vac. Sci. Technol., B: Microelectron. Nanometer Struct.--Process., Meas., Phenom., 2008, 26, 632–635 CrossRef CAS.
- S. W. Lee, K. S. Lee, J. Ahn, J. J. Lee, M. G. Kim and Y. B. Shin, ACS Nano, 2011, 5, 897–904 CrossRef CAS PubMed.
- J. Zhou, F. Tao, J. Zhu, S. Lin, Z. Wang, X. Wang, J.-Y. Ou, Y. Li and Q. H. Liu, Nanophotonics, 2019, 8, 307–316 CAS.
- T. M. Bodenstine, B. H. Beck, X. Cao, L. M. Cook, A. Ismail, J. K. Powers, A. M. Mastro and D. R. Welch, Chin. J. Cancer, 2011, 30, 189–196 CrossRef PubMed.
- A. D. Kolb, A. B. Shupp, D. Mukhopadhyay, F. C. Marini and K. M. Bussard, Breast Cancer Res., 2019, 21, 1–31 CrossRef PubMed.
- S. Zhu, H. Li, M. Yang and S. W. Pang, Nanotechnology, 2016, 27, 295101–295113 CrossRef PubMed.
- J. Hui and S. W. Pang, Biosci. Rep., 2019, 39, 1–18 Search PubMed.
- P. K. Jain, W. Huang and M. A. El-Sayed, Nano Lett., 2007, 7, 2080–2088 CrossRef CAS.
- C. Dreser, D. A. Gollmer, G. Bautista, X. Zang, D. P. Kern, M. Kauranen and M. Fleischer, Nanoscale, 2019, 11, 5429–5440 RSC.
Footnote |
| † Electronic supplementary information (ESI) available. See DOI: 10.1039/d0lc00173b |
| This journal is © The Royal Society of Chemistry 2020 |