 Open Access Article
An optofluidic “tweeze-and-drag” cell stretcher in a microfluidic channel†
Zhanshi
Yao
 ,
Ching Chi
Kwan
 and
Andrew W.
Poon
 *
*
Photonic Device Laboratory, Department of Electronic and Computer Engineering, The Hong Kong University of Science and Technology, Clear Water Bay, Hong Kong SAR, China. E-mail: eeawpoon@ust.hk
First published on 24th December 2019
Abstract
The mechanical properties of biological cells are utilized as an inherent, label-free biomarker to indicate physiological and pathological changes of cells. Although various optical and microfluidic techniques have been developed for cell mechanical characterization, there is still a strong demand for non-contact and continuous methods. Here, by combining optical and microfluidic techniques in a single desktop platform, we demonstrate an optofluidic cell stretcher based on a “tweeze-and-drag” mechanism using a periodically chopped, tightly focused laser beam as an optical tweezer to trap a cell temporarily and a flow-induced drag force to stretch the cell in a microfluidic channel transverse to the tweezer. Our method leverages the advantages of non-contact optical forces and a microfluidic flow for both cell stretching and continuous cell delivery. We demonstrate the stretcher for mechanical characterization of rabbit red blood cells (RBCs), with a throughput of ∼1 cell per s at a flow rate of 2.5 μl h−1 at a continuous-wave laser power of ∼25 mW at a wavelength of 1064 nm (chopped at 2 Hz). We estimate the spring constant of RBCs to be ∼14.9 μN m−1. Using the stretcher, we distinguish healthy RBCs and RBCs treated with glutaraldehyde at concentrations of 5 × 10⁻⁴% to 2.5 × 10⁻³%, with a strain-to-concentration sensitivity of ∼−1529. By increasing the optical power to ∼45 mW, we demonstrate cell-stretching under a higher flow rate of 4 μl h−1, with a higher throughput of ∼1.5 cells per s and a higher sensitivity of ∼−2457. Our technique shows promise for applications in the fields of healthcare monitoring and biomechanical studies.
Introduction
The mechanical properties of biological cells are utilized as an inherent, label-free biomarker to indicate physiological and pathological changes of cells.1 Variations of cell deformability (elasticity) are linked with changes of the underlying cellular cytoskeleton,2 which has been associated with a broad range of functional changes of cells including differentiation,3 apoptosis,4 disease transformation5 and drug response.6 There is growing evidence that the reduction of deformability of human red blood cells (RBCs) is a symptom of various diseases, such as malaria infection,7 diabetes8 and sickle cell anemia.9 For the case of Plasmodium falciparum malaria, recent experiments have shown that the membrane stiffness of parasitized RBCs can increase by up to 10-fold.10 These findings suggest that characterization techniques for cell deformability could be a useful tool to distinguish between healthy and unhealthy cells for certain pre-diagnosis screening.Because of the pathophysiological importance, the mechanical properties of cells have long been attracting intensive research interest over the past decades. Various techniques have been developed to assess the deformability of cells. Conventional characterization techniques include micropipette aspiration,11 atomic force microscopy12 and using optical tweezers with high-refractive-index microbeads (e.g., silica or polystyrene microbeads) attached to two opposite ends of the cell for mechanical loading.13
However, all the aforementioned techniques involve direct physical contact between solid surfaces and the cells under test, which could modify the natural behaviours of the cells or even damage the cells during the measurements.14 Another practical issue is that these techniques impose static test conditions, which implicates a low characterization throughput (e.g., 10 cells per hour (ref. 15)). Tests with a relatively high throughput are often preferred in order to obtain statistically relevant results in light of the inherent heterogeneity of biological cells.16
Applying optical tweezers directly on cells without microbead attachments is a desirable method to enable non-contact, optically induced cell deformations. Standard optical tweezers comprise a tightly focused laser beam, which can exert pico-Newton-scale forces to micro-sized transparent dielectric objects for trapping and manipulation.17 The force of optical tweezers can be decomposed into two components, namely the gradient force component that attracts high-refractive-index objects towards the beam waist centre where the optical field has the highest intensity and the scattering force component that pushes the objects along the beam propagation direction.18 With a tightly focused beam, the gradient force in the longitudinal direction can balance the scattering force, resulting in a single laser-beam optical tweezer.
Single-beam optical tweezers have been used for RBC elongation via dragging cells through a fluid in a fluidic chamber.19,20 Dual optical tweezers have been adopted for deforming cells by directly applying two parallel propagating focused laser beams at two opposite ends of a RBC to stretch the cell along the separation direction of the beams.21,22 Optical cell stretchers comprising two counter-propagating divergent beams emanating from two optical fibres have been developed to trap and stretch cells along the longitudinal direction of the beams.23 However, conventional optical-force-based cell stretchers rely on static fluid conditions to avoid the effects of fluidic forces on cell trapping and deformation. In order to improve the characterization throughput, optical cell stretchers have been integrated with microfluidic channels for cell sample delivery at a relatively slow characterization throughput of ∼100 cells per hour,24,25 where the flow, however, needs to be paused during the cell stretching.
Microfluidic technology has gained increasing research interest as an attractive tool for the study of cell mechanical properties. A key merit of microfluidic devices for biological cell analysis is generally a high characterization throughput enabled by continuous cell sample delivery using a fluidic flow. Microfluidic devices have been developed for studying cell deformation using flow-induced hydrodynamic forces. One typical implementation is based on fast extensional flows where cells are deformed hydrodynamically at the stagnation point in a cross-shaped microfluidic channel.26,27 This technique could not only significantly deform cells, but could also induce cell damage upon exerting an estimated fluidic force on the cells exceeding 1 nN.28 Other implementations are to deform the cells when they flow through at a high speed in narrow microfluidic channels, with cross-sectional dimensions close to or smaller than the cell size.29–32 Specifically, in the real-time deformability cytometry (RT-DC) technique, the characterization throughput reaches 102–103 cells per s.30
However, the extracted cell stiffness in the RT-DC technique is only valid for cell deformations over a short time scale of ∼1 ms,33 which is not comparable (around an order of magnitude higher) with the static cell stiffness measured using the conventional static testing. The reason why the cell stiffness measured over a short time scale is different from the static ones can be attributed to that a high deformation rate can lead to fluidization of actin networks and thus significantly affect the mechanical response of the cell.34,35 As commented by the authors of the RT-DC technique,30 when probing the intrinsic slow response of cells is of primary interest, other methods applicable for longer time scales may be recommendable.34 Besides, the RT-DC technique imposes relatively high requirements on the imaging system, with an exposure time of 1 μs and a frame rate of 4000 fps.
In this work, we report an optofluidic approach for non-contact, continuous stretching of biological cells as a viable option for extracting static cell stiffness with a throughput of ∼1 cell per s using a common digital imaging system. Our approach uses a periodically chopped optical tweezer to trap momentarily a cell while stretching it with a fluidic flow transverse to the beam in a microfluidic channel. We term this the “tweeze-and-drag” mechanism.36,37 Our approach leverages the advantages of the tweezer for non-contact trapping and the microfluidic flow for both cell stretching and continuous cell delivery. Our approach deforms cells in a timescale of ∼0.1 s, which is within the typical response time of RBCs38 and requires only a common digital imaging system, with an exposure time of 1 ms and a frame rate of 80 fps.
Here, we choose RBCs for the proof-of-concept demonstration, which is partially motivated by the pragmatic fact that (rabbit) RBCs are readily accessible by our laboratory (through the University's Animal and Plant Care Facility (APCF)). Besides, as the mechanical properties of RBCs have long been considered relevant to many diseases related to RBCs, RBCs (though with a biconcave disk shape) are a reasonable choice for our demonstration. In this work, we demonstrate the stretcher for mechanical characterization of rabbit RBCs in their natural biconcave disk shape with a throughput of ∼1 cell per s at a flow rate of 2.5 μl h−1 using a continuous-wave (cw) laser optical power of ∼25 mW at a wavelength of 1064 nm (chopped at 2 Hz). We estimate the spring constant of the RBCs to be ∼14.9 μN m−1. Using the stretcher, we distinguish healthy RBCs (untreated) and RBCs treated with glutaraldehyde at concentrations varying from 5 × 10⁻⁴% to 2.5 × 10⁻³%, with a strain-to-concentration sensitivity of ∼−1529. We show that by increasing the optical power to ∼45 mW, we attain cell-stretching at a higher flow rate of 4 μl h−1, with a higher characterization throughput of ∼1.5 cells per s and a higher sensitivity of ∼−2457.
Principle
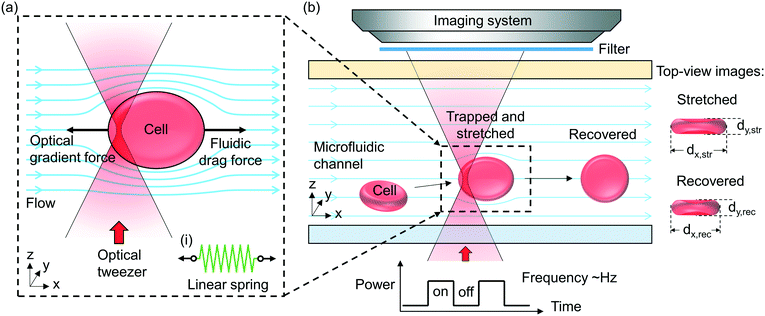
Fig. 1(a) illustrates schematically the principle of the “tweeze-and-drag” mechanism. We use a periodically chopped optical tweezer to trap a cell temporarily near the tightly focused laser beam waist and a continuous microfluidic flow to stretch the trapped cell in the flow direction (the x direction) transverse to the beam propagation direction (the z direction). At a dynamic equilibrium, the stretched cell experiences balanced optical gradient and fluidic drag forces in the x direction. The cell elongation under stretching depends on the cell stiffness (or elasticity). Under the same stretching force, a stiffer cell exhibits smaller shape deformation than a more elastic cell. Therefore, through monitoring the cell shape deformation under the same stretching conditions, we are able to distinguish between healthy (elastic) and diseased (less elastic) cells when the mechanical properties are affected by the cell's health condition.Inset (i) shows schematically a linear mass-on-a-spring model for describing the mechanical response of a cell under a stretching force. We assume a linear relationship between the stretching force (F) and the cell elongation in the x direction (Δdx): F = kΔdx, where k is the spring constant (in units of N m−1) representing the overall elasticity of the cell. Essentially the same equivalent mechanical model (a linear spring model) has been adopted by a number of existing literature studies studying the cell mechanical response.19,20,39–42
Fig. 1(b) illustrates schematically the working principle of our stretcher. We form an optical tweezer in a microfluidic channel using a tightly focused laser beam. Cells are continuously delivered towards the tweezer by the microfluidic flow. We maintain the RBCs in nearly their natural condition. When an RBC is optically trapped, the cell in a biconcave disk shape is re-oriented, with the disk surface normal transverse to the beam propagation direction to reach a stable equilibrium (see ESI† S1 for the numerical analysis based on a finite-element method simulation).43,44 The trapped cell is then stretched by the flow. In order to avoid physical contact between the cells under test and the microfluidic channel walls including the substrate, we focus the tweezer sufficiently above the substrate and far away from the microfluidic channel walls. We periodically chop the laser beam (at a ∼2 Hz frequency) to allow the stretched cells to subsequently escape from the tweezer along with the flow when the beam is momentarily blocked. The released cell recovers its shape after travelling a short distance. When the beam is momentarily on again, another cell can be trapped. In this way, we enable non-contact, continuous characterization. The microfluidic channel in our technique is instrumental. It enables a controllable microfluidic flow to generate an appropriate fluidic drag force for cell stretching and continuous cell delivery into the optical tweezer region for testing. Without using a microfluidic channel, we cannot readily apply such a fluidic drag force or continuously deliver cells to the tweezer to implement the tweeze-and-drag method.
In order to quantify the cell shape deformation, we image the cells from the top-view through the microfluidic channel top surface. We measure the cell dimensions in the x and y directions during cell stretching (dx,str and dy,str) and after the cell has recovered from stretching (dx,rec and dy,rec). The cell elongation along the x direction is Δdx = dx,str − dx,rec.
Experiments
Microfluidic channel fabrication
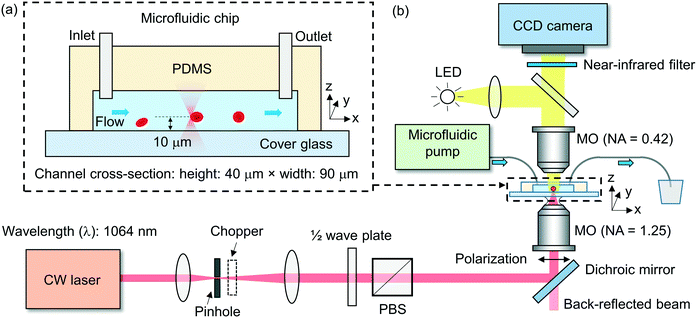
We fabricate the microfluidic channel using a soft-lithography technique (ESI† S2). The polydimethylsiloxane (PDMS) layer has a thickness of ∼3 mm, with an inlet and an outlet at the two ends of the channel, each with a diameter of ∼1 mm. We form the channel by bonding the patterned PDMS layer to a thin cover glass slide with a thickness of 0.17 mm. Fig. 2(a) shows schematically the cross-sectional view of a fabricated microfluidic chip. In the experiment, we use a channel with a width of ∼90 μm and a height of ∼40 μm.Experimental setup
Fig. 2(b) shows schematically the experimental setup. We adopt a 1064 nm-wavelength cw fibre laser as the light source. The wavelength is compatible with biological applications, with minimal photodamage to cells (cells are transparent to the 1064 nm wavelength) and minimal absorption in water (α = 0.61 cm−1)45 to minimize the heat in the fluidic medium. We control the linearly polarized laser power using a rotatable half-wave plate and a fixed polarizing beam splitter (PBS).We use an oil-immersion microscope objective lens with a high numerical aperture (NA) of ∼1.25 in air to focus the laser beam into the microfluidic channel. We estimate the focused beam waist diameter inside the fluidic medium to be ∼0.8 μm and the depth of focus to be ∼1.2 μm. We locate the beam waist position relative to the channel substrate based on characterizing the back-reflected beam divergence from the glass–fluid interface. We position the tweezer above the substrate at a distance of ∼10 μm to avoid the trapped cell (with a typical diameter of 6–8 μm) from making contact with the substrate, as shown schematically in Fig. 2(a).
We use a mechanical chopper to periodically block the laser to allow the stretched cell to escape from the tweezer for the continuous characterization of incoming cells. We adopt the chopping frequency of ∼2 Hz (corresponding to a laser exposure time of ∼0.25 s) to allow a sufficiently long time for the cell trapping, re-orientation and stretching (see ESI† S3 for a discussion on the chopping frequency).
We image the cells from the top view using a long-working-distance microscope objective lens with an NA of 0.42 on a digital charge-coupled-device (CCD) camera. The camera has a frame rate of ∼80 fps with a field-of-view of ∼35 μm × ∼35 μm. We use a near-infrared filter to block the laser light in front of the camera.
We connect the inlet of the microfluidic channel with a syringe pump using tubing. We control the flow speed (∼μl h−1) in the channel by controlling the pumping rate. We use another tubing to connect the outlet of the channel to a plastic tumbler for waste collection.
Cell sample preparation
All animal procedures here are performed in accordance with the Guidelines for Care and Use of Laboratory Animals of The Hong Kong University of Science and Technology (HKUST) and approved by the Animal Ethics Committee of the HKUST. We obtain a rabbit blood sample of ∼5 ml from the APCF at the HKUST. ∼10% heparin is added to the sample for anti-coagulation. We dilute the sample in a 1× phosphate-buffered saline buffer solution, with an estimated cell concentration of ∼5 × 10⁷ cells per ml. This cell concentration is chosen to avoid frequent overlaps of cells during trapping. The RBCs are incubated in the buffer solution for ∼10 minutes before the experiments. For the chemical treatments of cells, the cells are treated in a 1× buffer solution with a glutaraldehyde v/v concentration of ∼5 × 10⁻⁴% to ∼2.5 × 10⁻³%. In order to avoid cell adhesion and the glass effect,46 the channel and the tubing are incubated with 3% (w/v) bovine serum albumin (BSA) in a 1× buffer solution for 30 min before the experiments. The cells maintain a disk shape after being injected into the channel.Image processing
We process all the images from the video clips recorded by the camera using the Image Processing Toolbox and the Computer Vision System Toolbox in Matlab. The image processing mainly comprises three steps namely (i) edge detection, (ii) object segmentation and (iii) feature extraction (see ESI† S4). In the edge detection step, we create binary masks that contain the edge profile of the cell based on the intensity gradient. In the object segmentation step, we obtain the cell edge profiles from the binary masks and remove irrelevant edges. In the feature extraction step, we measure the centroid positions (x, y), and the major (dmaj) and minor axes (dmin) of the cells, assuming the cells follow an ellipsoidal shape. We obtain the lengths of the cells along the x and y directions (dx and dy) by calculating the lengths of the projection of the ellipse in the x and y directions. In order to filter-out infrequent events of overlapped RBCs and impurities, we reject objects detected with an abnormal size that is exceeding 80 μm2 or below 10 μm2.Using the extracted centroid positions of the cells in each frame, we track the cell trajectories and measure the speeds of the cells when the cells are incoming towards, near and after passing through the tweezer (see ESI† S4).
Results and discussion
Optical trapping of cells in a microfluidic flow
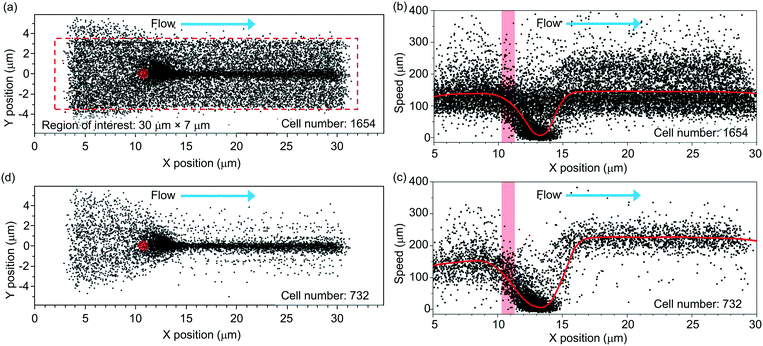
Fig. 3 shows the scatter plot of the centroid positions of the RBCs that have an average y position within a region of interest (indicated using the red-dashed-line box). We define the region of interest with dimensions of 30 μm (x) × 7 μm (y). In this region, most incoming cells spatially overlap with the tweezer positioned at x = ∼11 μm and y = ∼0 μm (labeled using a red spot). The tweezer optical power is ∼25 mW. The flow rate is ∼2.5 μl h−1.We record a total number of N = 1654 cells passing through the region of interest during a period of ∼12 min. This number includes the cells that are optically trapped and the cells that are not trapped (when the laser is off). The trapped cells are centered at a position slightly after the tweezer (x = ∼13 μm). They are released by the flow when the laser is off.
Fig. 3(b) shows the extracted cell speeds with the x position of the cell centroid. We label the position of the tweezer using a red bar. The red curve shows the average cell speed value.
In the analysis, we apply a speed threshold of 20 μm s−1 near the trapping region (x = 10–15 μm) to remove events of un-trapped cells that are traveling with the minimal speed exceeding the threshold (see ESI† S5 for the discussion on the speed threshold). Fig. 3(c) shows the extracted speeds of the trapped cells with a reduced cell number of 732. At the trapped cell position of x = ∼13 μm, the average cell speed drops to nearly zero.
For x > ∼15 μm, the released cells' speeds rise from nearly zero to a steady-state speed of ∼230 μm s−1. We note that the average steady-state speed exceeds the incoming cell speed of ∼140 μm s−1. We attribute this increment in speed to the fact that the tweezer is positioned ∼10 μm above the substrate and the incoming cells tend to be streamed near the substrate due to their weight. Thus, the trapped cells tend to be slightly levitated from their incoming plane. When the cells are released, they experience a higher flow speed than that close to the substrate in a laminar flow distribution (with the maximum flow speed near the channel centre).
Fig. 3(d) shows the trajectories of the trapped and released cells. In the following analysis, we only focus on these cells.
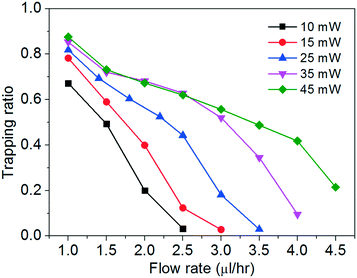
We study the trapping of cells at different flow rates with optical powers spanning from ∼10 mW to ∼45 mW. We define a trapping ratio as the ratio between the number of trapped cells and the total number of cells that pass through the region of interest. Fig. 4 shows the trapping ratio with the flow rate at different optical powers.
The trapping ratio at a fixed chopping frequency of the tweezer depends on both the optical gradient force and the fluidic drag force on the cells. We obtain the maximum trapping ratios of about 0.7–0.9 at a flow rate of 1 μl h−1 at the different optical powers. At a fixed optical power, the trapping ratio drops nearly monotonically when the flow rate increases. At a fixed flow rate, a higher optical power generally enables a larger trapping ratio, until about 35 mW when the flow rate is at or below 2.5 μl h−1. We remark that a higher optical power imposes higher risks to induce cell photodamage (including deforming the cells, to be shown below) and to heat up the water medium. In the following discussion, we will focus on the cell stretching with two optical power levels of ∼25 mW and ∼45 mW at different flow rates.
Stretching of the optically trapped cells in a microfluidic flow
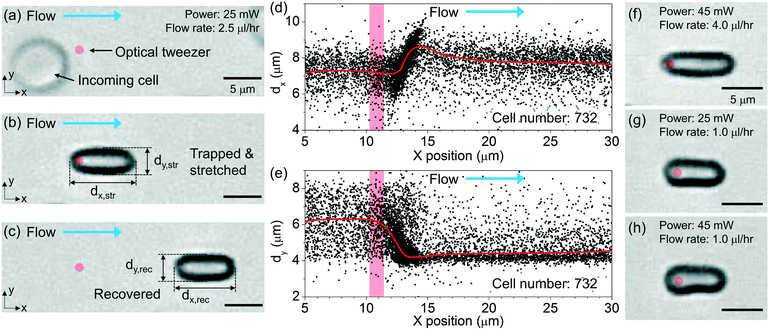
Fig. 5(a)–(c) show the optical micrographs of a RBC passing through the tweezer with an optical power of ∼25 mW and a flow rate of ∼2.5 μl h−1. Before trapping, the cell exhibits a nominal disk shape, as shown from the top-view image in Fig. 5(a). We indicate the position of the tweezer by a red spot. At the moment the cell is trapped, the cell is re-oriented with the disk surface normal transverse to the beam propagation direction. Then, the trapped cell is stretched along the flow direction, as shown in Fig. 5(b). We indicate in Fig. 5(b) the lengths of the stretched cell along the flow direction (dx,str) and transverse to the flow direction (dy,str). After the cell is released, the cell recovers to nearly its original shape while maintaining the same orientation as it is streamed along the flow, as shown in Fig. 5(c). We label in Fig. 5(c) the lengths of the recovered cell dx,rec and dy,rec.We extract the lengths of all the trapped cells from the recorded video clips. Fig. 5(d) and (e) show the scatter plots of the extracted dx and dy values with the x positions of the cells at an optical power of ∼25 mW and a flow rate of ∼2.5 μl h−1. The red curves show the average values of the cell lengths. The red column indicates the position of the tweezer.
Before the incoming cells reach the tweezer at x ≈ 11 μm, the cells exhibit a random orientation. The average dx and dy values of the cells are ∼7.3 μm and ∼6.3 μm, respectively, as shown in Fig. 5(d) and (e), respectively. When the cells are trapped at x ≈ 13 μm, the average dx value increases whereas the average dy value decreases. We consider the changes of the measured dx and dy values before and after trapping as an overall result of both the cell re-orientation and the cell deformation. At x ≈ 14 μm, dx reaches the maximum of ∼8.6 μm and dy reaches the minimum of ∼4.2 μm. After the cells are released and have reached steady state, the average dx value recovers to ∼7.7 μm while the average dy value recovers to ∼4.6 μm.
Fig. 5(f) shows the optical micrograph of a stretched RBC at a higher optical power of ∼45 mW and a higher flow rate of ∼4 μl h−1. Due to a larger stretching force, the cell exhibits larger elongation compared with that shown in Fig. 5(b). We note that when the cells are trapped at a relatively high optical power of ∼45 mW, the optical forces induce deformation of the cells when the flow rate is low. Fig. 5(g) and (h) show the microscopy images of the cells that are trapped with optical powers of ∼25 mW and ∼45 mW, respectively, at a flow rate of ∼1 μl h−1. The cell that is trapped with a high optical power of ∼45 mW exhibits an asymmetric shape, as shown in Fig. 5(h).
Cell stretching at different flow speeds
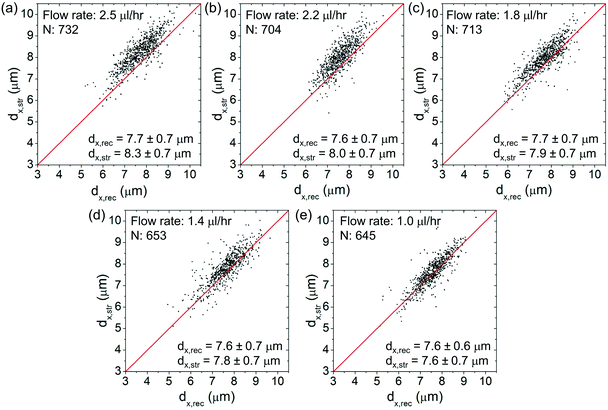
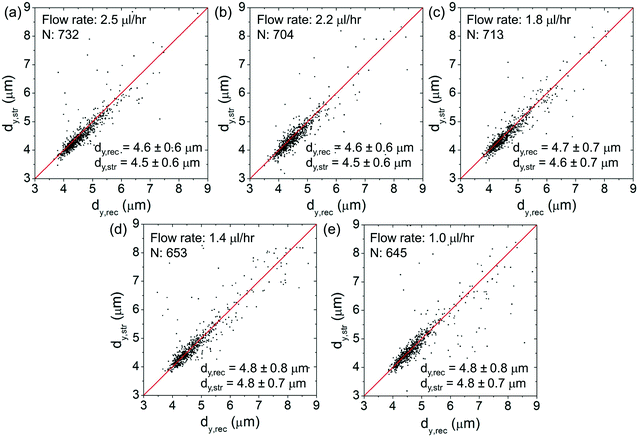
Fig. 6(a)–(e) show the scatter plots of dx,strversus dx,rec at an optical power of ∼25 mW at different flow rates spanning from ∼2.5 μl h−1 to ∼1 μl h−1. For each plot, we indicate the cell number and the average values of dx,rec and dx,str. The red lines as a visual aid indicate the condition dx,str = dx,rec (no stretching). At lower flow rates, the (dx,str, dx,rec) data cluster around the red lines. At higher flow rates, the data cluster above the red lines, indicating clear cell elongations.Fig. 7(a)–(e) show the corresponding scatter plots of dy,strversus dy,rec. At all the flow rates, the (dy,str, dy,rec) data cluster around the red lines, indicating only minimal cell squeezing in the transverse direction.
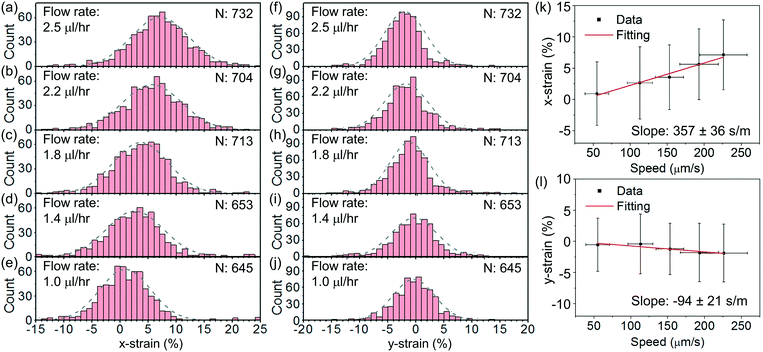
Fig. 8(a)–(e) show the histograms of the strain in the x direction, defined as x-strain ≡ (dx,str − dx,rec)/dx,rec × 100%, at an optical power of ∼25 mW at different flow rates varying from ∼2.5 μl h−1 to ∼1 μl h−1. Fig. 8(f)–(j) show the corresponding histograms of the strain in the y direction, defined as y-strain ≡ (dy,str − dy,rec)/dy,rec × 100%. We apply Gaussian fits to the histograms for the analysis. We find the maximum x-strain of ∼7% at ∼2.5 μl h−1 and the corresponding maximum y-strain of ∼−2%.
Fig. 8(k) and (l) show the average values of the x- and y-strains with the cell escape speed, respectively. We extract the escape speeds by processing the images of the released cells at steady state. The speeds are directly correlated with the flow rates. We apply linear fits and obtain the slopes of the x-strain with the speed to be 357 ± 36 s m−1 and the y-strain with the speed to be −94 ± 21 s m−1. The larger slope indicates a higher sensitivity of the x-strain to the flow than that of the y-strain to the flow. We remark that the fluidic stress normal to the disk surface is a constant pressure regardless of the flow speed when the disk surface normal is transverse to the flow direction.47
We estimate the fluidic drag force exerted on the trapped cells using a model based on Stokes' law on a thin circular disk shape:47,48
 | (1) |
We remark that our technique is not limited to stretching disk-shaped RBCs only. We have previously applied our technique for stretching osmotically swollen RBCs that are more spherical36,37 (see ESI† S8). We therefore believe that our technique is applicable to stretch other types of cells that are more spherical when in suspension.
Assuming a linear spring model, we relate the fluidic stretching force and the cell elongation according to F = kΔdx, where k is the spring constant for quantifying the overall elasticity of the cells. Using dx,rec as the original disk diameter, we obtain:
 | (2) |
Based on the fitted slope in Fig. 8(k), we estimate the spring constant to be k = 16η/(3 slope) ≈ 14.9 ± 1.5 μN m−1. This value is within the range of 4–20 μN m−1 reported in the literature based on dual optical tweezers.39–41,51
During the stretching process, the cell is deformed from a circular disk to an elliptical disk. In our experiment, the maximum change of the cell lengths is only ∼10%. We consider the shape change as a weak perturbation to the circular disk model. Based on the linear relationship between F and d in eqn (1), this leads to a maximum ΔF of ∼10%. Therefore, we consider the error of the estimated drag force and the associated error of the extracted spring constant due to the cell shape change during stretching to be less than 10%, which is within the statistical uncertainty of our data.
We estimate the cell-stretching throughput to be ∼1 cell per s, which is higher than that of other cell stretchers using conventional optical techniques under static conditions or in microfluidic channels requiring the flow to stop while stretching.13–15,19–25
We have also included the analysis of cell deformation at a higher optical power of ∼45 mW at different flow rates varying from ∼4 μl h−1 to ∼1 μl h−1 (see ESI† S9). We obtain the slopes of the x-strain with the speed and the y-strain with the speed to be 322 ± 21 s m−1 and −101 ± 10 s m−1, respectively, which are close to the results at an optical power of ∼25 mW. For cell stretching at a flow rate of ∼4 μl h−1, we detected 1043 cells that are trapped and stretched in a test duration of ∼12 min. We estimate the cell-stretching throughput to be ∼1.5 cells per s, which is higher than that with an optical power of ∼25 mW due to a higher flow rate.
Distinguishing untreated and chemically treated cells
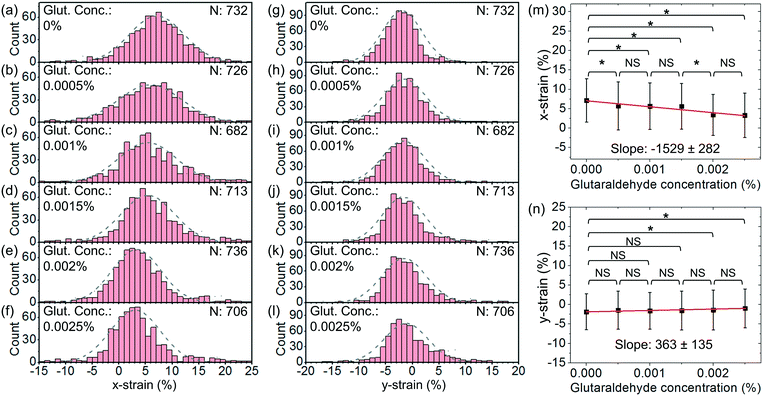
In order to further demonstrate the functionality of our cell stretcher, we test RBCs with chemical treatments for cell stiffness modification. For the chemical treatments of the cells, we treat RBCs using glutaraldehyde with different v/v concentrations varying from 5 × 10⁻⁴% to 2.5 × 10⁻³%. Glutaraldehyde has been known to be able to cross-link cellular proteins and thus increase the cell stiffness.52,53 The stiffness of RBCs before and after treatment of glutaraldehyde with a relatively low concentration (0–0.01%) can have moderate differences.53–55 It is known that the stiffness of treated RBCs exhibits a gradual increase with glutaraldehyde concentration.53–55 Therefore, glutaraldehyde treatment with low concentrations is often used to increase the stiffness of RBCs to mimic the change in the cell mechanical properties under physiological conditions and to evaluate the effectiveness of cell mechanical characterization techniques upon the resulting stiffening.Fig. 9(a)–(f) show the histograms of x-strain at an optical power of ∼25 mW and a flow rate of ∼2.5 μl h−1 with different glutaraldehyde concentrations varying from 0% to 2.5 × 10⁻³%. Fig. 9(g)–(l) show the corresponding histograms of y-strain at different glutaraldehyde concentrations. For each histogram, we indicate the cell numbers.
Fig. 9(m) and (n) show the average x-strain and y-strain with glutaraldehyde concentrations, respectively. We find that the chemically treated cells generally exhibit smaller deformation than the untreated cells. This is consistent with the cell stiffening due to the chemical treatment. At a higher chemical concentration, the cells exhibit smaller deformation, suggesting a stronger cell stiffening effect. Based on eqn (2), we estimate the average spring constant values of the chemical-treated cells to be ∼20.0 μN m−1, ∼20.7 μN m−1, ∼21.7 μN m−1, ∼35.3 μN m−1 and ∼38.1 μN m−1 for chemical concentrations of 5 × 10⁻⁴%, 1 × 10⁻³%, 1.5 × 10⁻³%, 2 × 10⁻³% and 2.5 × 10⁻³%, respectively.
The extracted cell stiffness of treated cells is increased by ∼1.3- to 2.5-fold with the glutaraldehyde concentration varying from ∼5 × 10⁻⁴% to ∼2.5 × 10⁻³%. This is comparable with the stiffness of aged RBCs stored for 4–6 weeks.56 However, for RBCs that have diseases, such as in the case of Plasmodium falciparum malaria infection, the membrane stiffness of parasitized RBCs can increase by up to 10-fold.10 Rather than increasing the glutaraldehyde concentration further to stiffen the cells to compare with specific disease conditions, our primary interests are to demonstrate a proof of concept for the method and to examine the sensitivity of revealing a small change in the cell stiffness as a potential general diagnosis of early-stage changes in the cell's health status.
We apply linear fits and obtain the slopes of x-strain with concentration and y-strain with concentration to be −1529 ± 282 and 363 ± 135, respectively. The slope of x-strain with concentration is larger than that of y-strain with concentration, indicating that the x-strain of cells responds more sensitively to the stiffening compared with the y-strain under the same test conditions.
We apply unpaired two-sample t-test between different test groups. Based on the x-strain, we are able to distinguish between the cells without treatment and the cells treated with chemical concentrations of 5 × 10⁻⁴%–2.5 × 10⁻³% (P < 0.1). Based on the y-strain, we are able to distinguish between the cells without treatment and the cells treated with chemical concentrations of 2 × 10⁻³%–2.5 × 10⁻³% (P < 0.1) while there is no significant difference between the cells without treatment and the cells treated with chemical concentrations of 5 × 10⁻⁴%–1.5 × 10⁻³% (P > 0.1).
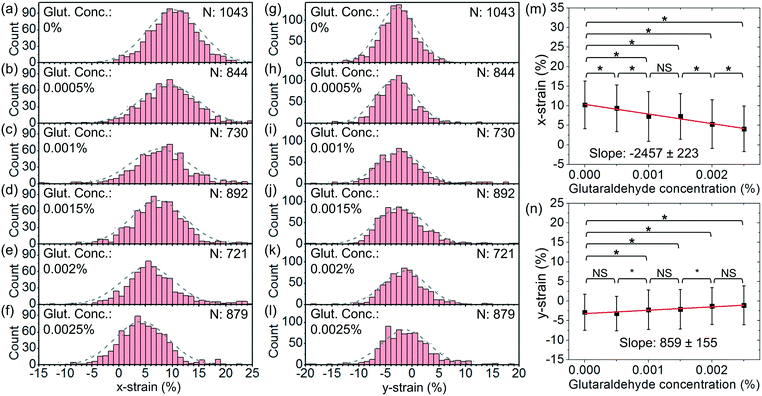
We have also performed tests with a higher optical power and a higher flow rate. Fig. 10(a)–(f) show the histograms of x-strain at an optical power of ∼45 mW and a flow rate of ∼4 μl h−1 at different glutaraldehyde concentrations varying from 0 to 2.5 × 10⁻³%. Fig. 10(g)–(l) show the corresponding histograms of y-strain at different glutaraldehyde concentrations. Fig. 10(m) and (n) show the average x-strain and y-strain with glutaraldehyde concentrations, respectively.
We apply linear fits and obtain the slopes of x-strain with concentration and y-strain with concentration to be −2457 ± 223 and 859 ± 155, respectively. Both slopes are larger than those with an optical power of ∼25 mW and a flow rate of 2.5 μl h−1. This indicates that stretching at a higher optical power and a higher flow rate enables a better strain-to-concentration sensitivity to distinguish different cell groups.
Based on the x-strain, we are able to distinguish between the cells without treatment and the cells treated with chemical concentrations of 5 × 10⁻⁴%–2.5 × 10⁻³% (P < 0.1). Based on the y-strain, we are able to distinguish between the cells without treatment and the cells treated with chemical concentrations of 1 × 10⁻³%–2.5 × 10⁻³% (P < 0.1) while there is no significant difference between the cells without treatment and the cells treated with a chemical concentration of 5 × 10⁻⁴% (P > 0.1).
Conclusions
In summary, we demonstrated an optofluidic cell stretcher based on the “tweeze-and-drag” mechanism using a periodically blocked optical tweezer and a fluidic flow in a microfluidic channel. Our method leverages the advantages of non-contact optical forces and a microfluidic flow for both cell stretching and continuous cell delivery. We demonstrated the stretcher for mechanical characterization of rabbit RBCs with a throughput of ∼1 cell per s at a flow rate of 2.5 μl h−1 and a cw optical power of ∼25 mW at a wavelength of 1064 nm. We estimated the spring constant of the RBCs to be ∼14.9 μN m−1. Using the stretcher, we distinguished between healthy RBCs (untreated) and RBCs treated with glutaraldehyde at concentrations varying from 5 × 10⁻⁴% to 2.5 × 10⁻³%, with a strain-to-concentration sensitivity of ∼−1529. We showed that by increasing the optical power to ∼45 mW, we attained cell-stretching at a higher flow rate of 4 μl h−1 with a higher characterization throughput of ∼1.5 cells per s and better sensitivity of ∼−2457. Our technique shows promise for applications in the fields of healthcare monitoring and biomechanical studies.Author contributions
Conceptualization: A. W. P. and Z. Y.; formal analysis: Z. Y.; funding acquisition: A. W. P.; investigation: Z. Y., C. C. K and A. W. P.; methodology: Z. Y. and A. W. P.; project administration: A. W. P.; resources: A. W. P.; software: Z. Y.; supervision: A. W. P.; visualization: Z. Y., C. C. K. and A. W. P.; writing – original draft: Z. Y., C. C. K. and A. W. P.; writing – review & editing: Z. Y., C. C. K. and A. W. P.Conflicts of interest
There are no conflicts to declare.Acknowledgements
This study was supported by grants from the Research Grants Council of The Hong Kong Special Administrative Region, China (617913 and 16211616). We thank the Nanosystem Fabrication Facility (NFF) and Biomedical Microdevice Lab at the HKUST for the microfluidic device fabrication. We thank the Animal and Plant Care Facility (APCF) and Biomedical Microdevice Lab at the HKUST for the cell sample preparation.References
- G. Bao and S. Suresh, Cell and molecular mechanics of biological materials, Nat. Mater., 2003, 2, 715–725 CrossRef CAS PubMed.
- D. A. Fletcher and R. D. Mullins, Cell mechanics and the cytoskeleton, Nature, 2010, 463, 485–492 CrossRef CAS PubMed.
- F. Chowdhury, S. Na, D. Li, Y. C. Poh, T. S. Tanaka, F. Wang and N. Wang, Material properties of the cell dictate stress-induced spreading and differentiation in embryonic stem cells, Nat. Mater., 2010, 9, 82–88 CrossRef CAS PubMed.
- A. E. Pelling, F. S. Veraitch, C. P. K. Chu, C. Mason and M. A. Horton, Mechanical dynamics of single cells during early apoptosis, Cytoskeleton, 2009, 66, 409–422 CrossRef CAS PubMed.
- S. E. Cross, Y. S. Jin, J. Rao and J. K. Gimzewski, Nanomechanical analysis of cells from cancer patients, Nat. Nanotechnol., 2007, 2, 780–783 CrossRef CAS PubMed.
- W. A. Lam, M. J. Rosenbluth and D. A. Fletcher, Chemotherapy exposure increases leukaemia cell stiffness, Blood, 2007, 109, 3505–3508 CrossRef CAS PubMed.
- S. M. Hosseini and J. J. Feng, How malaria parasites reduce the deformability of infected red blood cells, Biophys. J., 2012, 103, 1–10 CrossRef CAS PubMed.
- C. D. Brown, H. S. Ghali, Z. Zhao, L. L. Thomas and E. A. Friedman, Association of reduced red blood cell deformability and diabetic nephropathy, Kidney Int., 2005, 67, 295–300 CrossRef PubMed.
- J. L. Maciaszek and G. Lykotrafitis, Sickle cell trait human erythrocytes are significantly stiffer than normal, J. Biomech., 2011, 44, 657–661 CrossRef PubMed.
- S. Suresh, J. Spatz, J. P. Mills, A. Micoulet, M. Dao, C. T. Lim, M. Beil and T. Seufferlein, Connections between single-cell biomechanics and human disease states: gastrointestinal cancer and malaria, Acta Biomater., 2005, 1, 15–30 CrossRef CAS PubMed.
- A. Sinha, T. T. Chu, M. Dao and R. Chandramohanadas, Single-cell evaluation of red blood cell bio-mechanical and nano-structural alterations upon chemically induced oxidative stress, Sci. Rep., 2015, 5, 9768 CrossRef CAS PubMed.
- G. Ciasca, M. Papi, S. Di Claudio, M. Chiarpotto, V. Palmieri, G. Maulucci, G. Nocca, C. Rossi and M. De Spirito, Mapping viscoelastic properties of healthy and pathological red blood cells at the nanoscale level, Nanoscale, 2015, 7, 17030–17037 RSC.
- C. T. Lim, M. Dao, S. Suresh, C. H. Sow and K. T. Chew, Large deformation of living cells using laser traps, Acta Mater., 2004, 52, 1837–1845 CrossRef CAS.
- T. Yang, F. Bragheri and P. Minzioni, A comprehensive review of optical stretcher for cell mechanical characterization at single-cell level, Micromachines, 2016, 7, 90 CrossRef PubMed.
- P. Minzioni, R. Osellame and C. Sada, et al., Roadmap for optofluidics, J. Opt., 2017, 19, 093003 CrossRef.
- D. Di Carlo and L. P. Lee, Dynamic single-cell analysis for quantitative biology, Anal. Chem., 2006, 78, 7918–7925 CrossRef CAS PubMed.
- A. Ashkin, Optical trapping and manipulation of neutral particles using lasers, Proc. Natl. Acad. Sci. U. S. A., 1997, 94, 4853–4860 CrossRef CAS PubMed.
- P. Polimeno, A. Magazzu, M. A. Lati, F. Patti, R. Saija, C. D. E. Boschi, M. G. Donato, P. G. Gucciardi, P. H. Jones, G. Volpe and O. M. Marago, Optical tweezers and their applications, J. Quant. Spectrosc. Radiat. Transfer, 2018, 218, 131–150 CrossRef CAS.
- C. A. Silva, C. A. Azevedo Filho, G. Pereira, D. C. Silva, M. C. Castro, A. F. Almeida, S. C. Lucena, B. S. Santos, M. L. Barjas-Castro and A. Fontes, Vitamin E nanoemulsion activity on stored red blood cells, Transfus. Med., 2017, 27, 213–217 CrossRef CAS PubMed.
- D. S. Moura, D. C. Silva, A. J. Williams, M. A. Bezerra, A. Fontes and R. E. de Araujo, Automatic real time evaluation of red blood cell elasticity by optical tweezers, Rev. Sci. Instrum., 2015, 86, 053702 CrossRef PubMed.
- R. Agrawal, T. Smart, J. Nobre-Cardoso, C. Richards, R. Bhatnagar, A. Tufail, D. Shima, P. H. Jones and C. Pavesio, Assessment of red blood cell deformability in type 2 diabetes mellitus and diabetic retinopathy by dual optical tweezers stretching technique, Sci. Rep., 2016, 6, 15873 CrossRef CAS PubMed.
- S. Rancourt-Grenier, M. T. Wei, J. J. Bai, A. Chiou, P. P. Bareil, P. L. Duval and Y. Sheng, Dynamic deformation of red blood cell in dual-trap optical tweezers, Opt. Express, 2010, 18, 10462–10472 CrossRef CAS PubMed.
- J. Guck, R. Ananthakrishnan, H. Mahmood, T. J. Moon, C. C. Cunningham and J. Käs, The optical stretcher: a novel laser tool to micromanipulate cells, Biophys. J., 2001, 81, 767–784 CrossRef CAS PubMed.
- C. Faigle, F. Lautenschläger, G. Whyte, P. Homewood, E. Martín-Badosa and J. Guck, A monolithic glass chip for active single-cell sorting based on mechanical phenotyping, Lab Chip, 2015, 15, 1267–1275 RSC.
- G. Trotta, R. Martínez Vázquez, A. Volpe, F. Modica, A. Ancona, I. Fassi and R. Osellame, Disposable optical stretcher fabricated by microinjection moulding, Micromachines, 2018, 9, 388 CrossRef PubMed.
- D. R. Gossett, T. K. Henry, S. A. Lee, Y. Ying, A. G. Lindgren, O. O. Yang, J. Rao, A. T. Clark and D. Di Carlo, Hydrodynamic stretching of single cells for large population mechanical phenotyping, Proc. Natl. Acad. Sci. U. S. A., 2012, 109, 7630–7635 CrossRef CAS PubMed.
- M. Masaeli, D. Gupta, S. O'Byrne, T. K. Henry, D. R. Gossett, P. Tseng, A. S. Utada, H. J. Jung, S. Young, A. T. Clark and D. Di Carlo, Multiparameter mechanical and morphometric screening of cells, Sci. Rep., 2016, 6, 37863 CrossRef CAS PubMed.
- K. B. Roth, K. B. Neeves, J. Squier and D. W. Marr, High-throughput linear optical stretcher for mechanical characterization of blood cells, Cytometry, Part A, 2016, 89, 391–397 CrossRef CAS PubMed.
- Q. Guo, S. Park and H. Ma, Microfluidic micropipette aspiration for measuring the deformability of single cells, Lab Chip, 2012, 12, 2687–2695 RSC.
- O. Otto, P. Rosendahl and A. Mietke, et al., Real-time deformability cytometry: on-the-fly cell mechanical phenotyping, Nat. Methods, 2015, 12, 199 CrossRef CAS PubMed.
- B. Fregin, F. Czerwinski, D. Biedenweg, S. Girardo, S. Gross, K. Aurich and O. Otto, High-throughput single-cell rheology in complex samples by dynamic real-time deformability cytometry, Nat. Commun., 2019, 10, 415 CrossRef PubMed.
- D. Bento, R. Rodrigues, V. Faustino, D. Pinho, C. Fernandes, A. Pereira, V. Garcia, J. Miranda and R. Lima, Deformation of red blood cells, air bubbles, and droplets in microfluidic devices: Flow visualizations and measurements, Micromachines, 2018, 9, 151 CrossRef PubMed.
- A. Mietke, O. Otto, S. Girardo, P. Rosendahl, A. Taubenberger, S. Golfier, E. Ulbricht, S. Aland, J. Guck and E. Fischer-Friedrich, Extracting cell stiffness from real-time deformability cytometry: theory and experiment, Biophys. J., 2015, 109, 2023–2036 CrossRef CAS PubMed.
- M. Urbanska, P. Rosendahl, M. Kraeter and J. Guck, High-throughput single-cell mechanical phenotyping with real-time deformability cytometry, Methods Cell Biol., 2018, 147, 175–198 Search PubMed , Academic Press.
- B. Fabry, G. N. Maksym, J. P. Butler, M. Glogauer, D. Navajas and J. J. Fredberg, Scaling the microrheology of living cells, Phys. Rev. Lett., 2001, 87, 1–4 CrossRef PubMed.
- Z. Yao, C. C. Kwan and A. W. Poon, An Optofluidic Tweeze-and-Drag Cell Stretcher in a Microfluidic Channel. In CLEO: Science and Innovations, STu3H-1, Optical Society of America, 2019 Search PubMed.
- Z. Yao, C. C. Kwan and A. W. Poon, US provisional patent, No. 62/918,234, filed on Jan. 2019 Search PubMed.
- H. Ito, R. Murakami, S. Sakuma, C. H. D. Tsai, T. Gutsmann, K. Brandenburg, J. M. Pöschl, F. Arai, M. Kaneko and M. Tanaka, Mechanical diagnosis of human erythrocytes by ultra-high speed manipulation unraveled critical time window for global cytoskeletal remodeling, Sci. Rep., 2017, 7, 43134 CrossRef CAS PubMed.
- Y. Z. Yoon, J. Kotar, G. Yoon and P. Cicuta, The nonlinear mechanical response of the red blood cell, Phys. Biol., 2008, 5, 036007 CrossRef PubMed.
- Y. Z. Yoon, J. Kotar, A. T. Brown and P. Cicuta, Red blood cell dynamics: from spontaneous fluctuations to non-linear response, Soft Matter, 2011, 7, 2042–2051 RSC.
- S. Raj, M. Wojdyla and D. Petrov, Studying single red blood cells under a tunable external force by combining passive microrheology with Raman spectroscopy, Cell Biochem. Biophys., 2013, 65, 347–361 CrossRef CAS PubMed.
- M. M. Brandao, A. Fontes, M. L. Barjas-Castro, L. C. Barbosa, F. F. Costa, C. L. Cesar and S. T. O. Saad, Optical tweezers for measuring red blood cell elasticity: application to the study of drug response in sickle cell disease, Eur. J. Haematol., 2003, 70, 207–211 CrossRef CAS PubMed.
- K. S. Mohanty, S. K. Mohanty, S. Monajembashi and K. O. Greulich, Orientation of erythrocytes in optical trap revealed by confocal fluorescence microscopy, J. Biomed. Opt., 2007, 12, 060506 CrossRef PubMed.
- S. C. Grover, R. C. Gauthier and A. G. Skirtach, Analysis of the behaviour of erythrocytes in an optical trapping system, Opt. Express, 2000, 7, 533–539 CrossRef CAS PubMed.
- G. M. Hale and M. R. Querry, Optical constants of water in the 200-nm to 200-μm wavelength region, Appl. Opt., 1973, 12, 555–563 CrossRef CAS PubMed.
- L. G. Eriksson, On the shape of human red blood cells interacting with flat artificial surfaces - the ‘glass effect’, Biochim. Biophys. Acta, Gen. Subj., 1990, 1036, 193–201 CrossRef CAS.
- M. Ray, Application of Bessel functions to the solution of problem of motion of a circular disk in viscous liquid, Philos. Mag., 1936, 21, 546–564 Search PubMed.
- B. Lautrup, Physics of continuous matter: exotic and everyday phenomena in the macroscopic world, CRC press, 2011 Search PubMed.
- Y. Jun Kang, E. Yeom and S. J. Lee, A microfluidic device for simultaneous measurement of viscosity and flow rate of blood in a complex fluidic network, Biomicrofluidics, 2013, 7, 054111 CrossRef PubMed.
- S. Henon, G. Lenormand, A. Richert and F. Gallet, A new determination of the shear modulus of the human erythrocyte membrane using optical tweezers, Biophys. J., 1999, 76, 1145–1151 CrossRef CAS PubMed.
- V. Sheikh-Hasani, M. Babaei, A. Azadbakht, H. Pazoki-Toroudi, A. Mashaghi, A. A. Moosavi-Movahedi and S. N. S. Reihani, Atorvastatin treatment softens human red blood cells: an optical tweezers study, Biomed. Opt. Express, 2018, 9, 1256–1261 CrossRef CAS PubMed.
- I. Migneault, C. Dartiguenave, M. J. Bertrand and K. C. Waldron, Glutaraldehyde: behavior in aqueous solution, reaction with proteins, and application to enzyme crosslinking, BioTechniques, 2004, 37, 790–802 CrossRef CAS PubMed.
- A. Abay, G. Simionato and R. Chachanidze, et al., Glutaraldehyde–a subtle tool in the investigation of healthy and pathologic red blood cells, Front. Physiol., 2019, 10, 514 CrossRef PubMed.
- Q. Guo, S. P. Duffy, K. Matthews, A. T. Santoso, M. D. Scott and H. Ma, Microfluidic analysis of red blood cell deformability, J. Biomech., 2014, 47, 1767–1776 CrossRef PubMed.
- D. Holmes, G. Whyte, J. Bailey, N. Vergara-Irigaray, A. Ekpenyong, J. Guck and T. Duke, Separation of blood cells with differing deformability using deterministic lateral displacement, Interface focus, 2014, 4, 20140011 CrossRef PubMed.
- Z. Xu, Y. Zheng, X. Wang, N. Shehata, C. Wang and Y. Sun, Stiffness increase of red blood cells during storage, Microsyst. Nanoeng., 2018, 4, 17103 CrossRef CAS.
Footnote |
| † Electronic supplementary information (ESI) available. See DOI: 10.1039/c9lc01026b |
| This journal is © The Royal Society of Chemistry 2020 |

