
 Open Access Article
 This Open Access Article is licensed under a
 Creative Commons Attribution 3.0 Unported Licence
Deformability-induced lift force in spiral microchannels for cell separation†
Ewa Guzniczak *a,
Oliver Ottob,
Graeme Whytea,
Nicholas Willoughbya,
Melanie Jimenez‡c and
Helen Bridle‡a
*a,
Oliver Ottob,
Graeme Whytea,
Nicholas Willoughbya,
Melanie Jimenez‡c and
Helen Bridle‡a
aHeriot-Watt University, School of Engineering and Physical Science, Department of Biological Chemistry, Biophysics and Bioengineering Edinburgh Campus, Edinburgh, EH14 4AS, Scotland, UK. E-mail: eg100@hw.ac.uk
bCentre for Innovation Competence–Humoral Immune Reactions in Cardiovascular Diseases, University of Greifswald, Fleischmannstr. 42, 17489 Greifswald, Germany & Deutsches Zentrum für Herz-Kreislaufforschung, Partner Site Greifswald, Fleischmannstr. 42, 17489 Greifswald, Germany
cBiomedical Engineering Division, James Watt School of Engineering, University of Glasgow, G12 8LT UK
First published on 23rd December 2019
Abstract
Cell sorting and isolation from a heterogeneous mixture is a crucial task in many aspects of cell biology, biotechnology and medicine. Recently, there has been an interest in methods allowing cell separation upon their intrinsic properties such as cell size and deformability, without the need for use of biochemical labels. Inertial focusing in spiral microchannels has been recognised as an attractive approach for high-throughput cell sorting for myriad point of care and clinical diagnostics. Particles of different sizes interact to a different degree with the fluid flow pattern generated within the spiral microchannel and that leads to particles ordering and separation based on size. However, the deformable nature of cells adds complexity to their ordering within the spiral channels. Herein, an additional force, deformability-induced lift force (FD), involved in the cell focusing mechanism within spiral microchannels has been identified, investigated and reported for the first time, using a cellular deformability model (where the deformability of cells is gradually altered using chemical treatments). Using this model, we demonstrated that spiral microchannels are capable of separating cells of the same size but different deformability properties, extending the capability of the previous method. We have developed a unique label-free approach for deformability-based purification through coupling the effect of FD with inertial focusing in spiral microchannels. This microfluidic-based purification strategy, free of the modifying immuno-labels, allowing cell processing at a large scale (millions of cells per min and mls of medium per minute), up to high purities and separation efficiency and without compromising cell quality.
Introduction
Indigenous properties such as cell size and deformability (defined as the ability of a cell to change shape under applied load without cell lysis) have been recognised as promising label-free markers in cell separation and sorting in cell biology research, diagnostic and therapeutic methods.1 In many cases, alterations in cell mechanical properties are correlated with their molecular activity, such as cell cycle regulation,2 differentiation,3 immune-cell activation,4 malignant transformation5 and disease (e.g. osteoarthritis6 and malaria7). Cell sorting is often used to enrich or purify cell samples into well-defined populations. Traditional cell purification performed using fluorescent activated cell sorting (FACS) or magnetic activated cell sorting (MACS) generates purified (>95%) cell populations with a low number of unwanted cells in the final product. However, the requirement for cell-specific ligands hinders adaptation of these methods to industrial-scale processing due to the high cost of antibodies.8 Additionally, immuno-labelling is a laborious multi-step process consisting of numerous centrifugation, washing and incubation steps often resulting in a significant (reported up to 70%) cell loss8 and post-isolation cell quality impairment.9 Currently, only a limited number of fluorophore-conjugated antibody reagents are suitable for clinical processing10 and the adverse effects of introducing these probes into patients are unknown, but it is generally recognised that they could potentially trigger immune and toxic responses.11Separation of cells based on label-free biomarkers has been recognised as a viable alternative to conventional techniques such as FACS and MACS.12,13 Label-free biomarkers are cost-effective since there is no need to add costly antibodies to reveal cell identity markers and the number of processing steps (staining, washing) is reduced.14 Recently various microfluidic platforms such as acoustophoresis,15 magnetophoresis,16 dielectrophoresis17 and passive sorting (inertial focusing (IF),18 shear-induced diffusion,19 pinch flow fractionation,20 deterministic lateral displacement (DLD)21 and filtration22) have been used for continuous label-free separation. IF in spiral microchannels represents one of the passive techniques used to manipulate cells on the microscale without an externally applied force.23 In terms of processing throughput, techniques with the highest volumetric throughput include DLD and IF in the ml min−1 range, whereas in terms of cell concentration the shear-induced diffusion offers 106–107 cells per s (ref. 24) compared to typical concentration throughputs of around 106 cells per min for IF.12 Due to simplicity in operation, low manufacturing cost and proven scalability by parallelisation (millions of cells per minute), IF is considered as a very attractive approach for developing high-throughput industrially-viable processes for large-scale cell enrichment.25
Fluid flow in microscale confined channels has been associated with negligible inertia due to low Reynolds numbers, Re ≪ 1 (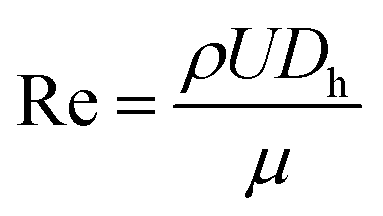 , where ρ – is medium density, U – medium velocity, μ – dynamic viscosity and Dh is hydraulic diameter).26,27 However previous work has shown useful physical phenomena at commonly neglected intermediate flow regimes (∼1 < Re < ∼100) in spiral microchannels, namely inertial migration and secondary flow.18,23,28–30 Both of these are determined by channel geometry, particle properties (e.g. size, shape) and applied flow rate. In 2007, Di Carlo et al. demonstrated the contribution of inertial effects to particles ordering at the micrometre scale.18 As shown in Fig. 1, particles flowing at intermediate Re experience a lift force FL from the Poiseuille flow profile, pushing the particles toward the channel walls, and a competing wall induced lift force FW repulsing particles back toward the centre of the channel. Adding curvature to the channel30–32 results in a centrifugal effect generating a secondary flow manifested in the form of counter-rotating Dean vortices perpendicular to the liquid main flow. Particles travelling through the spiral microchannel follow the direction of Dean vortices in addition to the main stream since they experience a supplementary Dean drag (FDD).33 The interplay between fluid flow and particles, if fine-tuned, leads to particles ordering, i.e. focusing into particular cross-sectional positions.34 Forces involved in particles gathering at their cross-sectional equilibrium positions are a function of particles' size
  ,35 where a is particle diameter, meaning that particles of different sizes can be aligned at different locations in the channel, thus allowing their sorting.
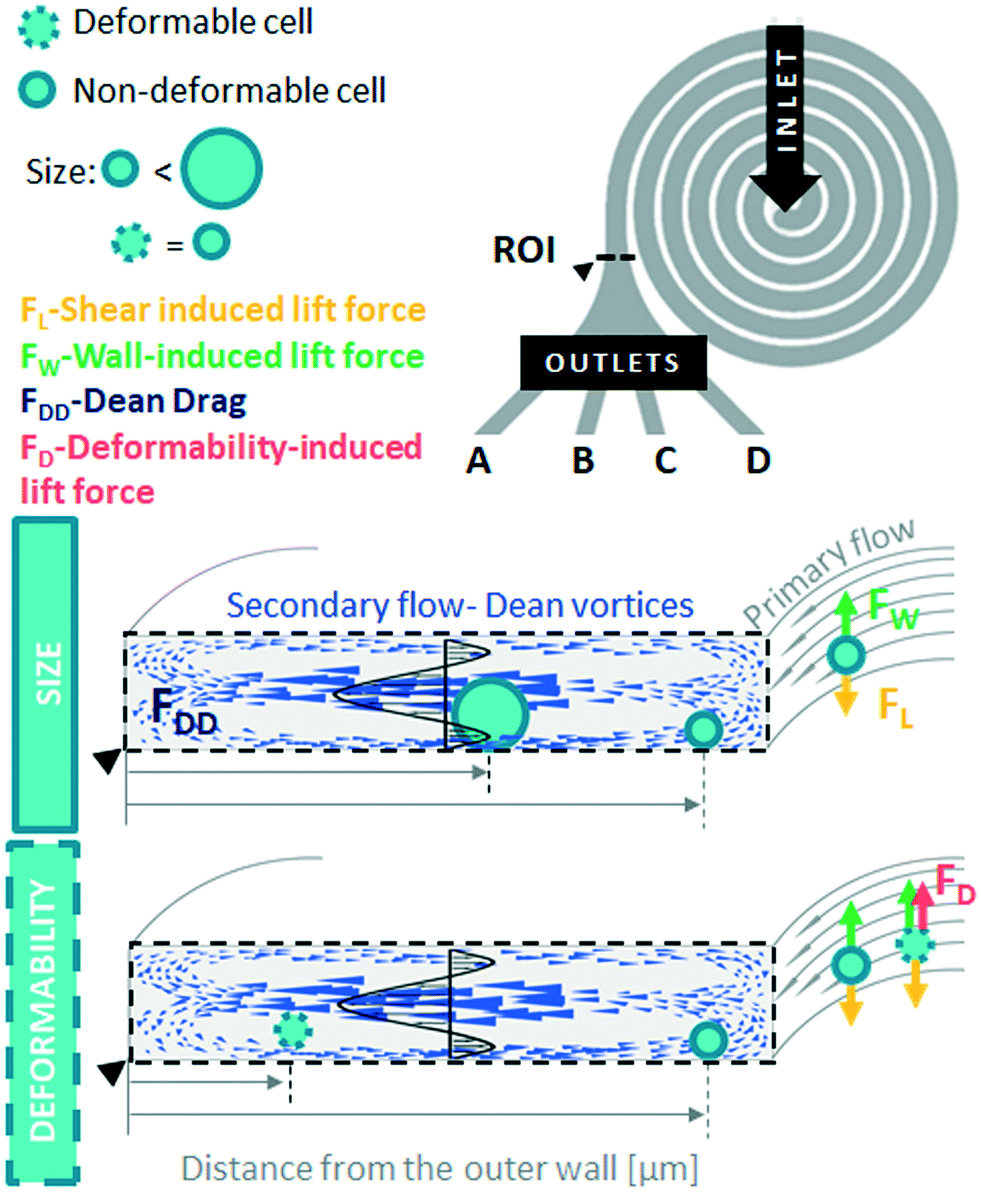 | ||
| Fig. 1 Deformability based particles ordering in a spiral microchannel. Spiral microchannel with six loops, one inlet and four outlets (A–D) for deformability-based separation. Hydrodynamic behaviour of cells of the same size but different deformability properties is assessed in the end of the spiral channel in the ROI and it is expressed as lateral position within the cross-section of the channel, measured as a distance from the outer wall of the channel [μm]. Size-based inertial focusing within spiral microchannels occurs due to balance of shear gradient lift force (FL), wall-induced lift force (FW) as well as Dean drag (FDD). Deformable cells experience additional deformability-induced lift force (FD), which in conjugation with FDD pushes them to a differential lateral equilibrium position closer to the outer wall of the channel, while non-deformable cells remain focused closer to the inner wall of the system. Cells of the same size but different deformability align in the spiral channel at distinct lateral equilibrium positions, that facilitates their separation and capture in one of the four outlets. | ||
Size-based sorting in spiral microchannels has been successfully translated for a wide range of applications in point-of-care and clinical diagnostics (Table S1†). However, the deformable nature of biological particles and its impact on cell focusing, while significant, tend to be excluded from discussions. It has been demonstrated for example that solid elastic particles flowing in a straight microchannel in Poiseuille flow, experience an additional deformability-induced lift force (FD) that pushes them away from the channel wall.36 Deformability-induced particle migration has been explored for droplets, bubbles, vesicles and viscous capsules in straight channels (for a comprehensive review see ref. 37). To the best of our knowledge, there is no literature describing this mechanism in conjugation with secondary Dean flow in spiral microchannels. In this study, for the first time, an investigation of the contribution of FD to the mechanism of inertial focusing in a large aspect ratio spiral microchannel with rectangular cross-section is presented.
In order to study the phenomena of deformability as a migration mechanism, a cellular model of deformability has been derived. Cells of the Jurkat cell line were chemically treated to gradually change their deformability without alterations in the cell size. Treated cells were analysed using a high-throughput phenotyping technique, namely real-time deformability cytometry (RT-DC), and that led to identification of five optimal conditions within the cellular deformability spectrum (from stiff to soft), which were used to research FD in the spiral microchannel. For the first time, it has been demonstrated that biological particles of the same size can be separated in spiral microchannels based on the difference in deformability only. This approach offers a viable alternative to FACS and MACS for sorting cells at large scale in a label-free manner at high purities and without compromising cell quality.
Materials and methods
Jurkat cell culture
Jurkat cells were cultured in Roswell Park Memorial Institute (RPMI) medium (ThermoFisher Scientific) supplemented with 10% (v/v) fetal bovine serum (FBS, Gibco) in a humidified incubator at 37 °C in 5% CO2. Cells from the same batch were collected when at their exponential growth phase (concentration 3–5 × 10⁵ cells per ml), split into fresh cell culture flask.Deriving the cellular deformability model
Cell samples for all experiments were collected at day 2 after seeding when they were in the exponential growth phase (cell concentration never exceeded 5 × 10⁵ cell per ml). To derive the cellular model for deformability, cells were treated with cytochalasin D (Sigma Aldrich) and glutaraldehyde (Sigma Aldrich). Cytochlasin D (Sigma Aldrich) was added directly to cell suspension of 1 × 10⁶ cells per ml in whole culture medium and incubated for 10 min, in a humidified incubator at 37 °C in 5% CO2. Prior to the RT-DC measurements as well as experiments in the spiral channels and flow cytometry cells were collected by centrifugation at 300g for 5 min and re-suspended in 0.5% methylcellulose or phosphate-buffered saline without calcium and magnesium (PBS−/−, ThermoFisher Scientific), respectively. Cytochlasin D in dimethyl sulfoxide (DMSO, Sigma Aldrich) concentration was adjusted to 0.01, 0.1, 1 and 10 μM. Final DMSO concentration in the cell sample was 0.25% (v/v) for 0.01, 0.1 and 1 μM cytochalasin D and 2.5% (v/v) for 10 μM cytochalasin D. Cytochalasin D desired concentrations were always maintained in cell buffers throughout the experiments due to the reversibility of the effect.Prior to treatment with glutaraldehyde (Sigma Aldrich) cells were washed twice in PBS−/− to remove any residual proteins. Next cells were re-suspended at 1 × 10⁶ cell per ml in PBS−/− supplemented with glutaraldehyde to the final concentrations of 0.0001, 0.001, 0.01 and 0.1% (v/v) and incubated at room temperature for 40 min. After the incubation time cells were washed once in PBS−/− and re-suspended either in 0.5% methylcellulose for RT-DC (and/or RT-FDC) measurements or PBS−/− for experiments in the spiral channels and flow cytometry.
Size of cells treated with cytochalasin D and glutaraldehyde were assessed by flow cytometric measurement of the forward light scatter (FSC-A) (BD LSR II, BD, Germany). Collected data was further analysed using FlowJo V10 CL. The receiver operating characteristic curves (ROC) were generated and the area under the curve (AUC) was calculated using GraphPad Prism 6.
In order to distinguish untreated soft cell from glutaraldehyde-treated stiff cells, for the purpose of separation efficiency quantification, Jurkat cells expressing green fluorescence protein (GFP) were obtained by transduction with a second-generation lentiviral system generated in house with pHR-SIN EGFP and VSV-G and delta 8.2 vectors. To ensure high GFP expression level (∼100%) within the population GFP-positive cells from the starting population were sorted by FACS (FACSAria IIu flow cytometer, Becton Dickinson Immunocytometry Systems (BD, UK) running BD FACSDiva v6 Software) and re-cultured for further experiments. The GFP-positive cells served as a control sample, which was mixed 1![[thin space (1/6-em)]](https://www.rsc.org/images/entities/char_2009.gif) :1 with GFP− negative cell treated with glutaraldehyde.
:1 with GFP− negative cell treated with glutaraldehyde.
Real-time fluorescence deformability cytometry
Please consult ESI† Materials and methods for the detailed description of the technique. Cell deformability was assessed using real-time fluorescence and deformability cytometry (RT-FDC), in order to distinguish between GFP+ and GFP− cells, when needed. Measurements were performed as per Nat. Methods 2018 (ref. 38) and ESI† Materials and methods. Prior to measurements, cells were harvested by centrifugation at 300g for 5 min and re-suspended in a 0.05% methylcellulose solution (CellCarrier, Zellmechanik Dresden, Germany) at 1–2 × 10⁶ cell per ml. Jurkat cells were assessed using a PDMS chip with a 30 × 30 μm cross-section channel. Cells were introduced into the channel at 0.16 μl min−1.Cell separation in a spiral microchannel
Throughout the course of this work, two configurations of an Archimedean spiral with six loops and rectangular cross-sections (I: with 360 × 60 μm2 cross-section and II: with 170 × 30 μm2 cross-section), one inlet and four outlets, were tested (SFig. 4†) at five different flow rates (please consult STable 2† to find tested flow rates and corresponding Reynolds and Dean numbers). Lateral positions within the channel were recorded for more than 10000 events on three independent occasions, for each researched condition, using a custom-written program ShapeIn and quantified using ShapeOut version 0.8.4 (available at http://www.zellmechanik.com).
A single inlet was located at the centre of each spiral channel. The radius of the curvature (measured as the distance from a centre of the channel to the inner wall of a loop) varies between design I: 0.515 mm (loop I)–3.805 mm (loop IV) and design II: 0.325 mm (loop I)–1.95 mm (loop VI). The microfluidic devices were fabricated by lithography in polymethyl methacrylate (PMMA, Epigem, UK). Cell suspensions at 1 × 10⁶ cells per ml, were introduced into the device with a mid-pressure syringe pump (neMESYS 1000N, Cetoni, Germany) through 1/16′′ PTFE tubing of 0.5 mm internal diameter (Thames Restek, UK). Hydrodynamic behaviour of cells was assessed in terms of lateral equilibrium position (measured as a distance from the particle centre to the outer wall [μm]) obtained at the end of the spiral channel by monitoring the ROI, by high-speed microscopic imaging. Images of cells inside the spiral channels were recorded at ×20 magnification using objective with 4.9 mm free working distance (421251-9911-000 LD A-Plan 20× Ph1, Zeiss) facilitating access to observe the channels through 2 mm thick PMMA layer. Images of cells were recorded by a high-speed CMOS camera (MC1362, Mikrotron, Germany), mounted on a microscope (Zeiss Axio Observer 3, Zeiss, Germany), at a speed of 2000 frames per second.
The sorting performance was assessed using the following three parameters:
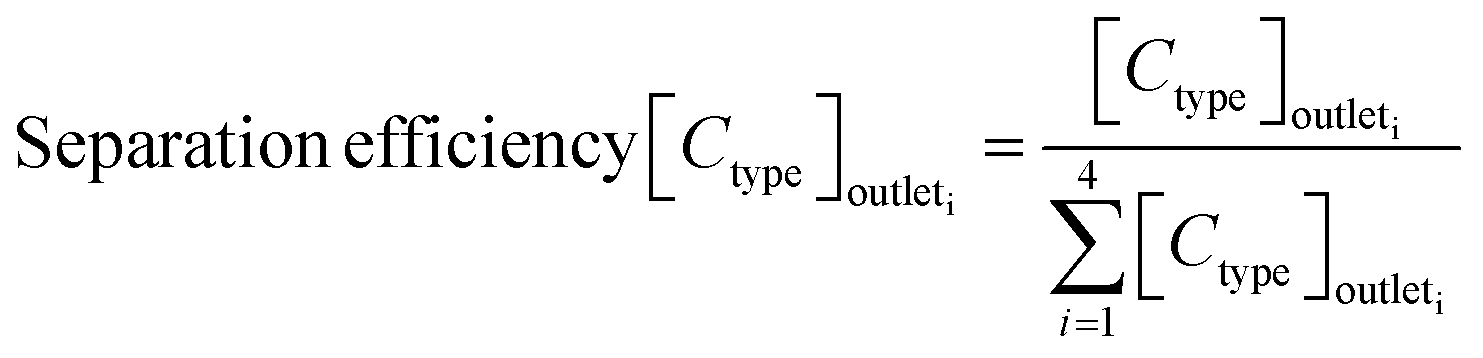 | (1) |
 | (2) |
Flow cytometric viability assay
Control cells were not passed through the device but were incubated on a bench outside of an incubator for the time of the treated (spiral) sample processing in the spiral microchannels. Both control and treated cells were re-cultured under normal conditions for 1 hour, prior to the flow cytometric viability assays. Cells viability was assessed using the Alexa Fluor® 488 Annexin V/Dead Cell Apoptosis kit (ThermoFisher Scientific). Control cells as well as treated were harvested by centrifugation at 200 g for 5 min and washed in cold PBS−/− and stained as per manufacturer's protocol. Briefly, after washing in PBS cells were re-suspended in annexin-binding buffer at around 106 cells per ml. 100 μl aliquot of each sample was transferred to a fresh centrifuge tube and 5 μL Alexa Fluor® 488 annexin V and 1 μL 100 μg mL−1 PI working solution was added to each 100 μL of cell suspensions. Cells were incubated in darkness at room temperature for 15 min. After incubation samples were further diluted by adding 400 μl annexin-binding buffer and analysed by flow cytometry (BD FACSCalibur), measuring the fluorescence emission at 530 nm (FL1) and >575 nm (FL3).Results
Cellular deformability model
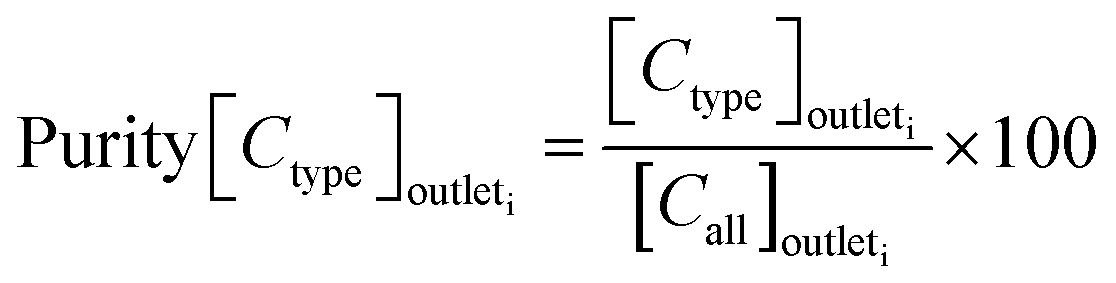
In order to study the impact of deformability on cell focusing within spiral microchannels, a cellular model of deformability has been derived. Cells of the Jurkat cell line were chemically treated to change their deformability without alterations in the cell size. Treated cells were analysed using a high-throughput phenotyping technique, real-time deformability cytometry (RT-DC).2 Deformability was measured by RT-DC and here it is reported as differential deformation (DD) as described in Materials & methods,39 where deformation in the measurement channel is independently measured from the initial cell shape. Therefore, any treatment-induced morphological changes to shape were neglected. In order to verify that the chemically-triggered changes of deformability were decoupled from size alteration, we used flow cytometry to quantify forward light scatter (FSC-A) – a measurement of the amount of a laser beam that passes around the cell – corresponding to a relative cell size. To quantify the degree of size overlap receiver operating curves (ROC) were generated and the corresponding area under the curve (AUC) was calculated.The cellular deformability model was derived with Jurkat cells (round cells, Ø13 ± 2 μm, mean ± SD, cultured in suspension), treated with either cytochalasin D (CytoD), known for softening cell properties by alteration of cytoskeletal protein F-actin, or glutaraldehyde (gluta), making cells stiffer by cross-linking proteins. Both compounds were tested at different concentrations (Fig. 2A) to generate dose–response graphs and by using a sigmoidal fit, identify concentrations corresponding to the half-maximum and maximum response to the treatment, manifested in changing cell differential deformability.
 | ||
| Fig. 2 Cellular deformability model (CDM) was derived, using Jurkat cells, by chemical treatment triggering gradual changes in cell stiffness (A) exemplary contour plots for Jurkat cells treated with cytochalasin D (CytoD) and glutaraldehyde showing the controlled change in deformability, measured in both the high-shear stress channel (green-CytoD and grey glutaraldehyde) as well as inlet reservoir section (cyan for both conditions) of real-time deformability cytometry (RT-DC) chip. All experiments were carried out at a flow rate of 0.16 μl s−1 in a 30 × 30 μm2 cross-section channel for around 10000 events for each replicate. (B and C) Both compounds were tested at different concentrations to generate dose–response graphs (mean deformation ± SEM measured with RT-DC). Sigmoidal fit to the data allowed identification of the half maximum (EC50) and maximum concentration for the effect of CytoD and glutaraldehyde on the deformability. p-Values relative to controls, were calculated using the linear mixed model (*p-value < 0.01, **p-value < 0.001). (D and E) The cell size of CytoD and glutaraldehyde-treated cells was assessed using forward light scatter parameter (FSC-A) measured using flow cytometer for 10000 events per condition. (F) Cellular deformability model, consisting of five degrees of differential deformability (DD): stiff max, stiff half-max, soft, soft half-max and soft-max. | ||
Fig. 2B summarises the effect of increasing concentrations of the cross-linking gluta on Jurkat cells (mean ± SEM), which affects cell-surface particles, stress fibres, actin cortex, and inner structures, stabilising the whole cell structure.40 At concentrations as low as 0.0001% (v/v) cells become 22% less deformable (DD = 0.024 ± 0.001, p-value < 0.01) than control cells. Cells' deformability decreases gradually with increasing gluta concentrations, tested up to 0.01% v/v (DD = 0.001 ± 0.002, p-value < 0.001, compared to control) when cells do not deform any further (maximal response) and corresponding to 97% drop in differential deformability. The half-maximal concentration (EC50) for the effect of gluta was identified at 0.0007% v/v, corresponding to DD = 0.014.
Fig. 2C displays mean ± SEM for Jurkat cells treated with CytoD in relation to untreated control cells (0 μM, DD = 0.031 ± 0.001). Exposure of cells to a concentration of 0.01 μM CytoD triggers a significant (p-value < 0.01) change to cell deformability, towards increased DD = 0.041 ± 0.001. DD increases gradually with increasing CytoD concentrations to reach a plateau (maximal response) at 1 μM (DD = 0.061 ± 0.007, p-value < 0.001), corresponding to a relative change in DD of 96% compared to control cells. The half-maximal concentration of 0.09 μM corresponds to DD = 0.046.
As demonstrated in Fig. 2, proposed chemical treatments altering cell deformability have little if any impact on cell size. Treatment with gluta (Fig. 2D) preserved cell size for all the tested concentrations (AUC = 0.53, 0.50, 0.54 and 0.53 for 0.1, 0.01, 0.001 and 0.0001% v/v, respectively). CytoD treatment (Fig. 2E) introduced a small (∼10%) shift in cell size distribution (AUC = 0.60, 0.60, 0.62 and 0.61 for 10, 1, 0.1 and 0.01 μM, respectively). It can be noted that the small changes observed in cell size after CytoD treatment (circa 1.5 μm on cells' diameter) would not cause significant differences in their focusing position if cells were behaving similarly to rigid particles; as presented in SFig. 1,† 10, 15 and 20 μm spherical polystyrene beads follow indeed similar focusing pattern for the tested range of Reynold numbers.
High-throughput investigation of CytoD and glutaraldehyde impact on cell mechanical properties allowed the establishment of the cellular deformability model, consisting of cells of five different degrees of deformability (see Fig. 2F): stiff max, stiff half-max, soft, soft half-max and soft-max, but remaining within the same size range. The model cells were used for further study of FD in spiral microchannels.
Lateral equilibrium position as a function of cell deformability
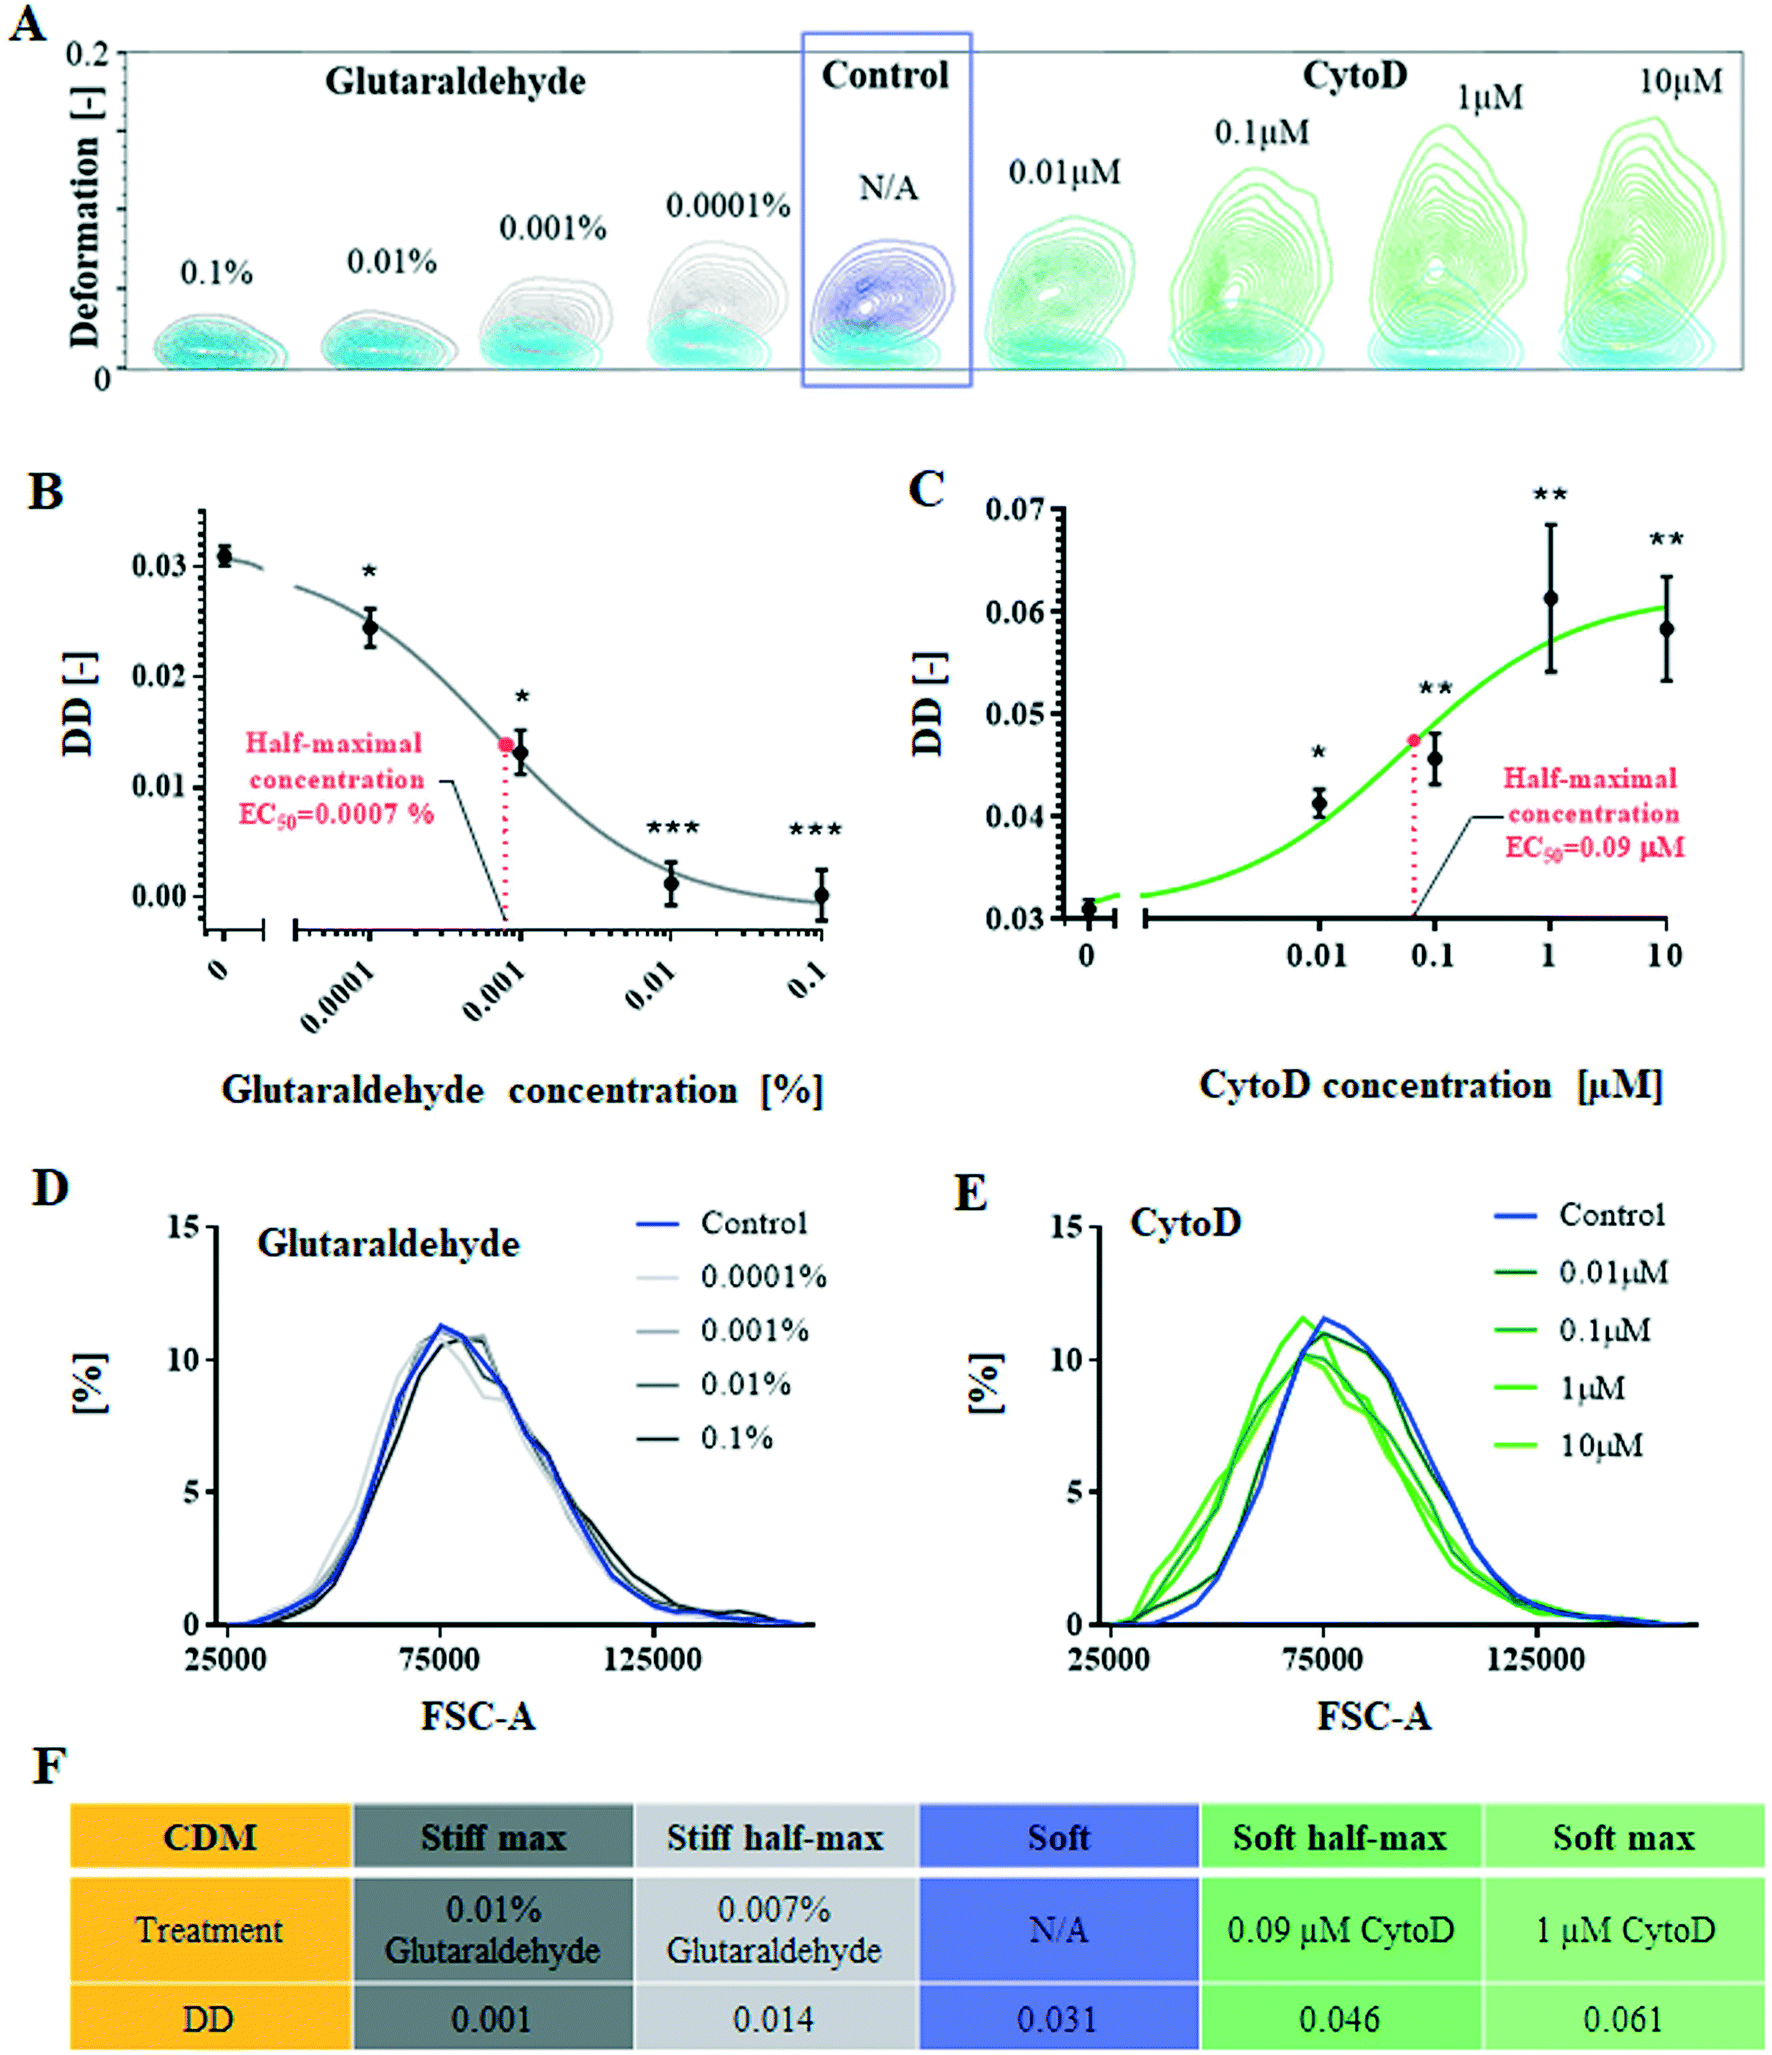
Cells from the cellular deformability model were tested as pure populations in two designs of spiral microchannels at five different flow rates. Design I was a spiral channel with 360 × 60 μm2 cross-section and it was tested at Re = 79, 119, 158, 197. Design II was a spiral channel 170 × 30 μm2 cross-section, tested at Re = 33, 66, 97, 132 and 168. The hydrodynamic behaviour of cells (reported as their lateral equilibrium position at the end of the spiral channel, measured as a distance from the outer wall [μm]) was compared with reference rigid spherical polystyrene beads of comparable size (10 and 15 μm in diameter, please note, 15 μm beads could not be tested in design II since they clogged the device at the inlet).As shown in Fig. 3A, at lower flow rates (Re = 79, 119 and 158) cells of all five deformability degrees behave in a similar manner, i.e. they remain focused in the side of the channel closest to the inner wall, at around 270 μm. Increased flow rates (Re = 198) triggered a shift of soft (=control), soft half-max and soft max cells to lateral positions closer to the channel centreline (184 ± 60, 168 ± 87 and 219 ± 60 μm, respectively) accompanied by cells defocusing from the uniform streak of cells (SD < 50 μm), manifested by cells occupying larger space within the channel. Stiff half-max and stiff max cells were not affected in the same way, remaining focused close to the inner wall, with stiff max cells being focused in a tighter streak closer to the outer inner wall (304 ± 21 μm) in comparison to stiff half-max cells (269 ± 61 μm). Further flow rate increase (Re = 237) resulted in a shift of soft, soft half-max and soft max cells closer to the outer wall of the channel (132 ± 50, 109 ± 44 and 121 ± 49 μm, respectively). The highest applied flow rate did not change the hydrodynamic behaviour of stiff max cells, which were still focused closer to the inner wall (305 ± 45 μm), but interestingly stiff half-max cells started shifting towards centreline of the channel, with the characteristic defocusing indicated by wider spread of assembled lateral position (251 ± 77 μm), similarly to softer cells at Re = 198. At all tested flow rates reference 15 μm beads remained tightly focused close to the inner wall.
 | ||
| Fig. 3 Hydrodynamic behaviour of cells (10000 per condition) of five different deformabilities (soft max, soft half-max, soft, stiff half-max and stiff) (A) in comparison to reference 15 μm beads in design I spiral microchannels with 360 × 60 μm2 cross-section at five different flow rates corresponding to Re = 79, 119, 158, 198 and 237 and (B) in comparison to reference 10 μm beads, in design II spiral channel with 170 × 30 μm cross-section at five different flow rates corresponding to Re = 33, 66, 97, 132 and 168. The lateral equilibrium positions were measured as a distance from the outer wall (μm) at the end of the spiral channel and there were generated by image analysis. Here, it is reported as median (represented as the symbol) and the interquartile range (indicated by the short vertical lines). Vertical dotted lines indicate four sections of the channel corresponding to four outlets of the channel (in design I: 0–90 μm – outlet A, etc. and design II: 0–42 μm – outlet A, etc.). For the summary of triplicate results please consult ESI† (C and D) receiver operating characteristic (ROC) curves were plotted for lateral equilibrium position for soft cells versus stiff max cells, to identify optimal separation flow rate. The true positive rate is defined as the number of soft cells found at a given lateral position and divided by the total number of soft cells. The false positive rate is the corresponding number of stiff max cells divided by the total number of soft cells for the same cut-off. To determine which of the applied flow rates ensures the best separation efficiency the area under the curve (AUC) was calculated. | ||
In design II (Fig. 3B), due to cell diameter approaching the height of the channel, Jurkat cells were geometrically forced towards centreline of the channel. At lower Re numbers (Re = 33, 66 and 97) cells from all five conditions behaved in a similar manner, i.e. they remained focussed near the centre of the channel (85 μm). Increased flow rates (Re = 132) resulted in a noticeable stiff max cells deviation from the centreline (101 ± 25 μm). At the highest applied flow rates (Re = 168) the difference between soft and stiff cells were revealed; soft cells were pushed closer to the outer wall (soft: 68 ± 21 μm, soft half-max: 80 ± 26 and soft max: 113 ± 21 μm) while stiff cells focussed close to the inner wall (stiff half max: 100 ± 27 μm and stiff max: 113 ± 21 μm). The reference 10 μm beads behaved similarly to stiff max cells, i.e. they remained focused close to the centreline at lower applied flow rates (102 ± 8, 99 ± 17 and 108 ± 20 μm for Re = 33, 66 and 97, respectively), and slightly diverged towards the inner wall at higher flow rates (128 ± 11 and 119 ± 23 and Re = 132 and 168, respectively).
Deformability difference for sorting cells in a spiral microchannel
Using the significant differences in lateral equilibrium position adopted by soft and stiff max cells within spiral microchannels, we conducted label-free separation of these cells. The end of the spiral microchannel is divided into four balanced outlets (A–D) for cell collection. The spiral microchannel itself could be divided into four sections: design I: 0–90 μm, 90–180 μm, 180–270 μm and 270–360 μm, and design II: 0–42.5 μm, 42.5–85 μm, 85–127.5 μm and 127.5–170 μm, and measured from the outer wall, corresponding to the four outlets A, B, C and D, respectively. Due to the laminar flow regime, cells equilibrated at the end of the channel within the realm of one of the four sections will travel to the corresponding outlet. This principle allows for the prediction of sorting outcome without labour-intense outlet quantification, which is a common practice for optimising spiral channels performance. Prior to separation, pre-sorted pure populations are run separately at a range of flow rates and their lateral equilibrium positions are compared in order to identify the optimal flow rate. The most distinct difference in equilibrium positions of soft and stiff max cells was observed in designed I, at Re = 237, with separation reaching 98% (AUC = 0.98, Fig. 2B), hence that was the flow rate applied for sorting cells from a mixed sample. Additionally, by quantifying the number of cells in each section of the channel a mock separation efficiency was generated (indicated by yellow lines in Fig. 4C and D), showing it would be possible to capture 91% of stiff cells in outlet D with >96% purity, while soft cells should be mainly distributed between outlets A (separation efficiency: 29%, purity: 99%) and B (separation efficiency: 60%, purity: 96%). The same Re was consequently applied for sorting cells from a mixed sample containing stiff max cells and soft cells. | ||
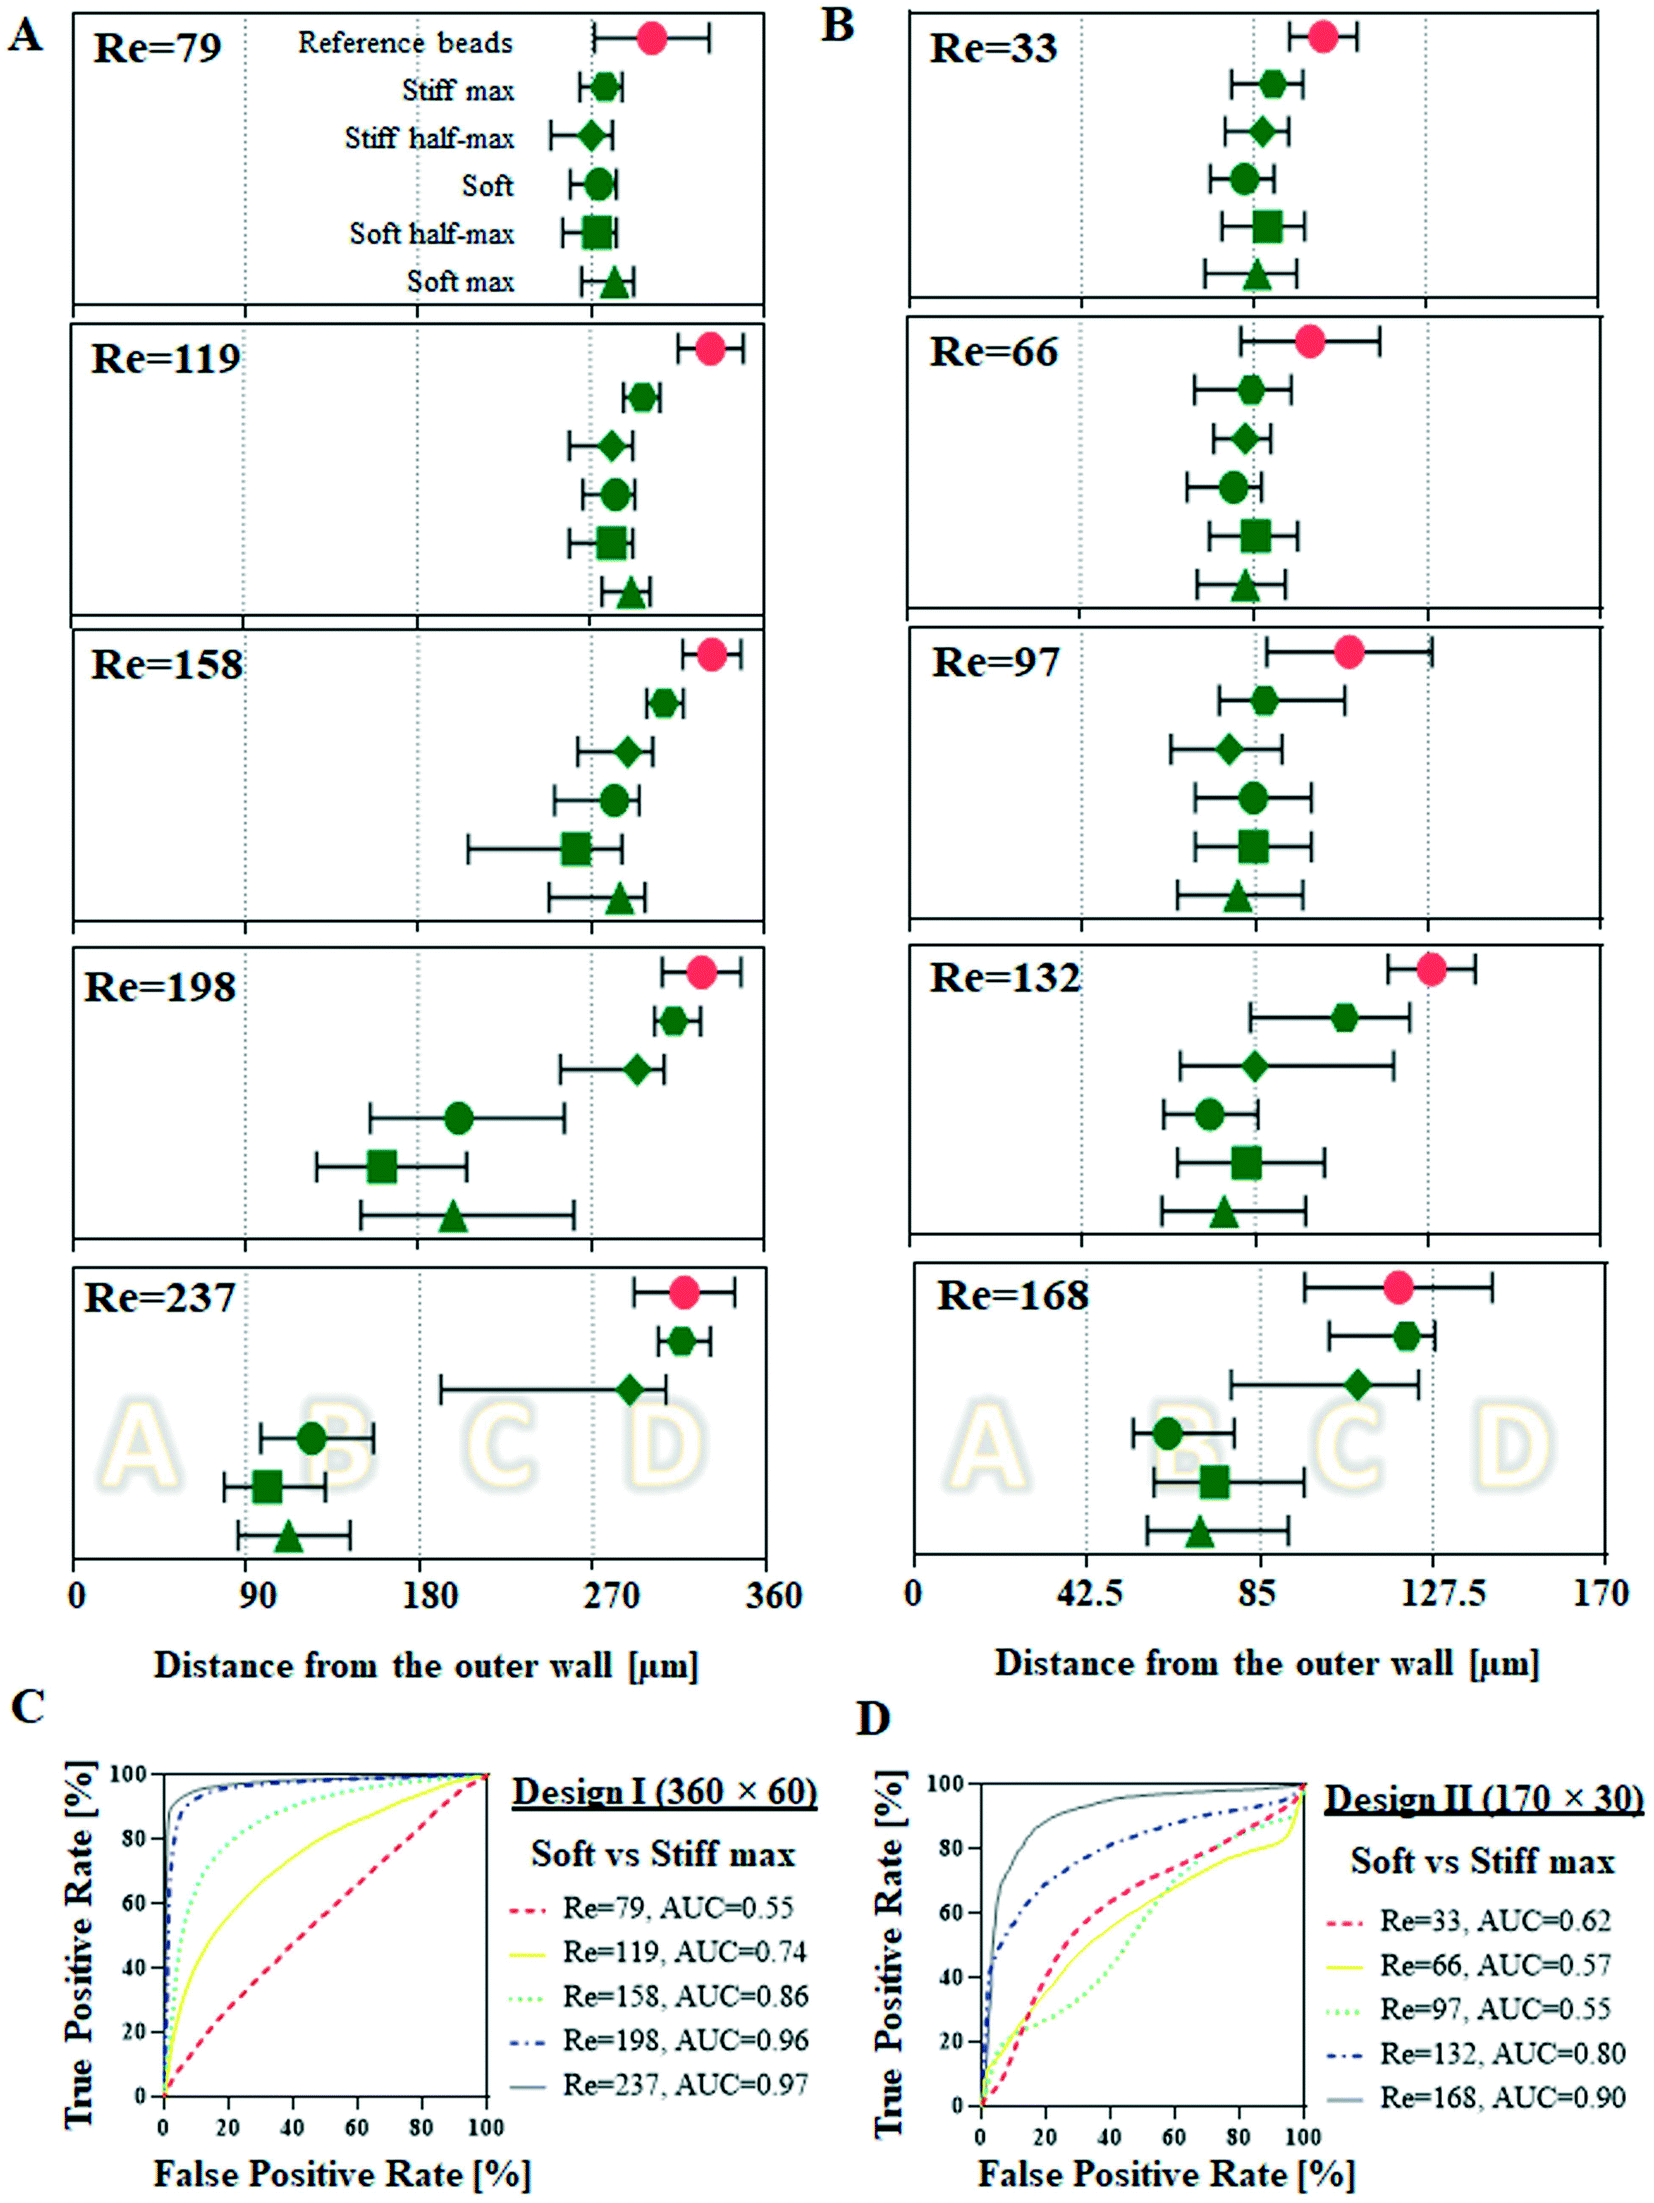
| Fig. 4 Deformability based separation in the spiral microchannel was demonstrated by the separation of untreated soft GFP+ cells (blue) from the glutaraldehyde-treated stiff max GFP− (grey). RT-FDC characterisation of GFP+ in comparison to GFP− cells. Equal probability contour plots (the same number of cells fall between each pair of contour lines) with adjacent histograms of deformation vs. cell size (expressed as projected cell area in μm2) for GFP+ and GFP− cells measurements were performed at 0.16 μl min−1 flow rate in a 30 μm × 30μm channel. More than 10000 of total events were acquired and split accordingly between each subset. (A) Comparison of untreated GFP+ versus GFP− untreated cells (black) and (B) comparison of untreated GFP+ cells and GFP− cells fixed with glutaraldehyde. The purification efficiency is characterised by (C) purity and (D) separation efficiency generated by quantification of cells collected at the outlets after processing at Re = 237. The process validation was performed at three independent occasions, the bars represent mean value and error bars correspond to the standard error of the mean. By quantifying the number of cells in each section of the channel corresponding to one of four outlets, run as pure populations, it was possible to generate mock purity and separation efficiency (represented as yellow lines on the corresponding graphs) to assess possible sorting outcome for the mixed sample. (E) Summary of flow cytometric assessment of the presence of live, apoptotic and necrotic (with unclassified (U/C) events presented on the graph) Jurkat cells before (control) and after (spiral) processing in the spiral microchannel at Re = 237. For the summary of scatter plots for triplicate results please consult ESI.† | ||
For this separation experiment, it was necessary to distinguish between soft and stiff cells in order to quantify the process performance (purity and separation efficiency). Jurkat cells were consequently modified to express green fluorescence protein (GFP), without compromising their deformability (Fig. 4A and B), which would allow for their detection by flow cytometry. Transfected with GFP Jurkat cells (GFP+) served as the soft subpopulation, mixed with GFP-negative (GFP−) stiff max cells.
The input cell sample, containing soft GFP+ and stiff max GFP− cells mixed at around 55:45 ratio (Fig. 4C) at 1 × 10⁶ cells per ml, was passed through the spiral microchannel at Re = 237 on three independent occasions. As shown in Fig. 4C, the majority (78.5 ± 1.6%, mean ± standard error of the mean) of the stiff max GFP− cells were hydrodynamically directed to outlet D, reaching 80% purity (Fig. 4D). Soft GFP+ cells were mainly distributed between outlets A (separation efficiency: 33.1%, purity: 92%) and B (separation efficiency: 38.9%, purity: 79%). Please note that the separation efficiency is lower than predicted due to hydrodynamic particle–particle interactions.41,42 This experiment provides proof of concept for deformability-based cell separation in spiral microchannels.
Impact on cell viability
Processing in spiral microchannels has been recognised as a gentle technique, with little if any impact on cell viability.34 To take advantage of FD, more elevated than usually flow rates are required (SFig. 3†), resulting in an elevated degree of shear stress, potentially deteriorating cell quality. To identify if the elevated flow rates negatively impacted on cell quality/viability, cells were collected after processing at the highest applied flow rate and investigated by flow cytometry. The earliest detectable signs of apoptosis are membrane asymmetry. In apoptotic cells, phosphatidylserine is translocated from inner to the outer layer of the cell membrane and can be identified by its conjugate Annexin V. Necrotic cells are characterised by increased cell permeability, which allows propidium iodide, which is not permanent to live cells, to enter the cell and bind to DNA. Fig. 4E shows that processing at the highest flow rate in the spiral microchannel does not significantly affect cell viability. Viability of control cells, which were not flowed through the system, was around 80% with the remaining 20% being split between apoptotic and necrotic cells within the sample. These proportions were not affected after exposure to shear flow in spiral microfluidic.Discussion
Exploiting the contribution of FD in spiral microchannels offers new ways to separate target cells from complex heterogeneous samples based on their intrinsic mechanical properties. In previous reports, the FD effect for particles focusing in straight channels has been used either solely or in conjugation with other effects, such as viscoelasticity33 and inertia.28 At inertia-less regimes (where Re numbers remain small), deformability-based separation is possible due to cell–wall interaction, where more deformable cells experience more repulsion from the wall in comparison to their stiffer counterparts.37,43 This principle was successfully employed by Geislinger et al. to separate red blood cells from platelets, where cells were pushed against a wall using sheath flow.44Incorporating the effect of inertia increases separation throughput since it occurs at intermediate Re numbers (for a detailed review on throughputs achieved in spiral microchannels please consult STable. 1†). Hur et al.36 demonstrated that the FD effect in combination with inertial effects in a straight microchannel with high aspect-ratio cross-section, yields throughputs of ∼2.2 × 10⁴ cells per min in a single device. Adding curvature to the channel brings two advantages over straight channels. Firstly, the presence of Dean flow modifies the preferred locations of the particles depending on their size. Secondly, it accelerates particles displacement; particles travel shorter distances to be equilibrated in comparison to straight channels with the same cross-section and operating at equivalent flow rates.45
In this research, it has been experimentally demonstrated that hydrodynamic effects in spiral microchannels can be used to separate cells of the same size but different deformability. Although the effect of FD in confined channels has been studied using droplets and vesicles46–50 they do not reflect the real nature of cells and their hydrodynamic behaviour. Cells are surrounded by a lipid bilayer underlined with a dynamic cytoskeleton, which primarily determines cell deformability.51 Additionally, most cells contain a nucleus, which under sufficiently high shear stress constitutes a limiting factor for cell deformability.3,52 For all these reasons, the cellular deformability model has been developed. Using cells of five degrees of deformability, we studied their behaviour within spiral microchannels. Based on the experimental observations two conclusions could be drawn:
(1) The effect of FD requires sufficiently high Re numbers (design with 360 × 60 μm2 cross-section: Re = 237, design with 170 × 30 μm2 cross-section: Re = 168). Cells passing through the channel at lower flow rates behave according to their size, and thus no significant differences were observed between soft and stiff cells. At elevated flow rates, stiff cells behaved like rigid reference beads while soft cells enter a characteristic defocused state, when they diverge from their previously assembled equilibrium position, near the inner wall of the channel, to occupy a much wider section of the channel around the centreline, and finally, are re-focused closer to the outer wall at sufficiently high flow rates.
(2) The effect of FD appears to be sensitive to a deformability threshold, above which the experienced drag reaches its maximal magnitude. At sufficiently high flow rates, all soft cells-soft, soft half-max and soft-max cells were focused closer to the outer wall. Interestingly, in a channel with 360 × 60 μm2 cross-section at Re = 237, stiff max cells remained focused in a tight streak close to the inner wall, while stiff half-max cells started defocusing into a wider streak in comparison to the positions they occupied at lower flow rates (design I: Re = 198), suggesting that if the applied flow rate was high enough, they could possibly travel to the outer wall side of the channel.
It has been experimentally verified, that the unique combination of Dean flow and FD can be adapted to separate cells within a microfluidic system when there is a sufficient difference in deformability between cells of interest. Promisingly, the elevated flow rates had no impact on cell viability. For comparison, during FACS procedure, high shear stresses due to the high fluid flow rates coupled with small nozzle diameters as well as operating at suboptimal temperatures and CO2 concentration, have the potential to reduce cellular viability.53 However, there is numerous guidance to be followed in order to maintain cell viability during and after FACS sorting, such as using customized nozzle sizes, collecting sorted cells in serum rich media, and collection tubes at a cell-type-specific optimal temperature.54 Recently, Sutermaster & Darling 2019 published an extensive study on the suitability of FACS and MACS sorting for high-yield and high-throughput cell sorting and they concluded that the viability of cells processed by FACS is conserved.55 This statement is in line with our findings on cell viability after processing in spiral microchannels at high flow rates applied in this study.
In the demonstrated approach, 3 × 10⁶ cells per min and 3 ml of medium per min, are processed by a single device (design I) when operating at the optimal flow rate. The current throughput seems reasonable for processing cells that are routinely cultured within a similar concentration range in large volumes. At present, culture is routinely carried in static culture conditions, facilitating maximal cell concentration at around 5 × 10⁶ cells per ml.56 The downstream processing proposed in this study has the capacity for further scale-up by two means: increasing cell sample concentration (minding the effect of particle–particle interaction, by maintaining optimal particles concentration to prevent their steric interaction, so-called steric crowding effect23) and system parallelisation. Stacking microfluidic devices (stack of 20 devices reported57) is a common practice resulting in a rapid and efficient throughput improvement.
Conclusions
Herein, for the first time, it has been demonstrated that at adequately high Re numbers in spiral microchannels the effect of FD become significant in the overall process of establishing cell equilibrium positions. By studying the hydrodynamic behaviour of a cellular deformability model, it has been found that cells of the same size but different deformability assemble at opposite equilibrium positions within the channel cross-section. Soft cells travel close to the outer wall, while their stiff counterparts are focused close to the inner wall of the channel. This experimental observation was successfully adapted into a passive label-free approach for separating cells of different deformability properties, without compromising cells' quality. This hydrodynamic microfluidic phenomenon appears promising and in order to fully exploit it, further theoretical investigation of the underlying physics is required. Given these results, a novel sorting approach is possible, for simultaneous sorting based on size and deformability with one system, with all the advantages offered by spiral microchannels. This study presents a much-needed label-free high-throughput (millions of cells per min, ml of medium per min) scalable and continuous cell sorting approach e.g. for novel stem-cell-derived therapeutic products, up to high purities.Author contributions
EG designed and performed all presented experimental work and data analysis, and wrote the manuscript with support from GW, NW, OO, MJ and HB, OO contributed to the RT-DC experiments design and data analysis, GW provided critical feedback and helped shape the manuscript, MJ and HB advised on the experimental design and equally helped supervise the project. All authors discussed the results and commented on the manuscript.Conflicts of interest
There are no conflicts to declare.Acknowledgements
FACS sorting was performed in the University of Edinburgh FACS Facility by Dr Martin Waterfall. Jurkat cells expressing green fluorescence protein (GFP+), were kindly provided by Dr Miguel Hermida (Heriot-Watt University, UK). EG gratefully acknowledges the funding from Scottish Industrial Biotechnology Innovation Centre (IBioIC) for her doctoral studies, Royal Society of Edinburgh for the JM Lessells travel scholarship allowing visiting OO's lab and performing the experimental work as well as Epigem Ltd. for providing resources for this project. OO gratefully acknowledges funding from the German Federal Ministry of Education and Research (ZIK grant under grant agreement 03Z22CN11) and from the Deutschen Zentrum für Herz-Kreislaufforschung. Notes and references. MJ would like to thank the Engineering and Physical Sciences Research Council (EPSRC) and the Royal Academy of Engineering for her Personal Research Fellowship (EP/R006482/1 and RF/201718/1741).References
- D. Di Carlo, A mechanical biomarker of cell state in medicine, J. Lab. Autom., 2012, 17, 32–42 CrossRef CAS PubMed.
- O. Otto, et al., Real-time deformability cytometry: on-the-fly cell mechanical phenotyping, Nat. Methods, 2015, 12, 199–202 CrossRef CAS PubMed.
- E. Guzniczak, et al., High-throughput assessment of mechanical properties of stem cell derived red blood cells, toward cellular downstream processing, Sci. Rep., 2017, 7, 14457 CrossRef PubMed.
- J. Rossy, J. M. Laufer and D. F. Legler, Role of Mechanotransduction and Tension in T Cell Function, Front. Immunol., 2018, 9, 2638 CrossRef PubMed.
- J. Guck, et al., Optical deformability as an inherent cell marker for testing malignant transformation and metastatic competence, Biophys. J., 2005, 88, 3689–3698 CrossRef CAS PubMed.
- E. M. Darling, S. Zauscher and F. Guilak, Viscoelastic properties of zonal articular chondrocytes measured by atomic force microscopy, Osteoarthr. Cartil., 2006, 14, 571–579 CrossRef CAS PubMed.
- S. M. Hosseini and J. J. Feng, How malaria parasites reduce the deformability of infected red blood cells, Biophys. J., 2012, 103, 1–10 CrossRef CAS PubMed.
- K. Schriebl, S. Lim, A. Choo, A. Tscheliessnig and A. Jungbauer, Stem cell separation: A bottleneck in stem cell therapy, Biotechnol. J., 2010, 5, 50–61 CrossRef CAS PubMed.
- L. M. Lee, et al., Label-free mesenchymal stem cell enrichment from bone marrow samples by inertial microfluidics, Anal. Methods, 2018, 10, 713–721 RSC.
- C. A. Mcintyre, B. T. Flyg and T. C. Fong, Fluorescence-Activated Cell Sorting for CGMP Processing of Therapeutic Cells, BioProcess Int., 2010, 8, 44–53 CAS.
- N. A. Willoughby, et al., A scalable label-free approach to separate human pluripotent cells from differentiated derivatives, Biomicrofluidics, 2016, 10, 14107 CrossRef CAS PubMed.
- D. R. Gossett, et al., Label-free cell separation and sorting in microfluidic systems, Anal. Bioanal. Chem., 2010, 397, 3249–3267 CrossRef CAS PubMed.
- C. W. Shields 4th, C. D. Reyes and G. P. López, Microfluidic cell sorting: a review of the advances in the separation of cells from debulking to rare cell isolation, Lab Chip, 2015, 15, 1230–1249 RSC.
- M. M. Diogo, C. L. da Silva and J. M. S. Cabral, in Separation Technologies for Stem Cell Bioprocessing BT - Stem Cells and Cell Therapy, ed. M. Al-Rubeai and M. Naciri, Springer, Netherlands, 2014, pp. 157–181, DOI:10.1007/978-94-007-7196-3_7.
- F. Tan, T. Wang, H. Wang and Y. Zheng, Microfluidic techniques for tumor cell detection, Electrophoresis, 2019, 40, 1230–1244 CrossRef CAS PubMed.
- N. Pamme and C. Wilhelm, Continuous sorting of magnetic cells via on-chip free-flow magnetophoresis, Lab Chip, 2006, 6, 974–980 RSC.
- M. Alshareef, et al., Separation of tumor cells with dielectrophoresis-based microfluidic chip, Biomicrofluidics, 2013, 7, 11803 CrossRef PubMed.
- D. Di Carlo, D. Irimia, R. G. Tompkins and M. Toner, Continuous inertial focusing, ordering, and separation of particles in microchannels, Proc. Natl. Acad. Sci. U. S. A., 2007, 104, 18892–18897 CrossRef CAS PubMed.
- J. Zhou, et al., Isolation of cells from whole blood using shear-induced diffusion, Sci. Rep., 2018, 8, 1296 CrossRef PubMed.
- M. Yamada, M. Nakashima and M. Seki, Pinched Flow Fractionation: Continuous Size Separation of Particles Utilizing a Laminar Flow Profile in a Pinched Microchannel, Anal. Chem., 2004, 76, 5465–5471 CrossRef CAS PubMed.
- J. McGrath, M. Jimenez and H. Bridle, Deterministic lateral displacement for particle separation: A review, Lab Chip, 2014, 14, 4139–4158 RSC.
- Y.-Y. Chiu, C.-K. Huang and Y.-W. Lu, Enhancement of microfluidic particle separation using cross-flow filters with hydrodynamic focusing, Biomicrofluidics, 2016, 10, 11906 CrossRef PubMed.
- D. Di Carlo, Inertial microfluidics, Lab Chip, 2009, 9, 3038–3046 RSC.
- J. Zhou and I. Papautsky, Size-dependent enrichment of leukocytes from undiluted whole blood using shear-induced diffusion, Lab Chip, 2019, 19, 3416–3426 RSC.
- J. Zhang, et al., Fundamentals and applications of inertial microfluidics: a review, Lab Chip, 2016, 16, 10–34 RSC.
- H. Amini, W. Lee and D. Di Carlo, Inertial microfluidic physics, Lab Chip, 2014, 14, 2739–2761 RSC.
- T. M. Squires and S. R. Quake, Microfluidics: Fluid physics at the nanoliter scale, Rev. Mod. Phys., 2005, 77, 977–1026 CrossRef CAS.
- I. Gregoratto, C. J. McNeil and M. W. Reeks, Micro-device for rapid separation of suspensions for use in micro-total-analysis-systems (μTAS), in Proceedings of the International Conference on Integration and Commercialization of Micro and Nanosystems 2007 B, 2007, pp. 1079–1086 Search PubMed.
- J. Seo, M. H. Lean and A. Kole, Membraneless microseparation by asymmetry in curvilinear laminar flows, J. Chromatogr. A, 2007, 1162, 126–131 CrossRef CAS PubMed.
- A. A. S. Bhagat, S. S. Kuntaegowdanahalli and I. Papautsky, Continuous particle separation in spiral microchannels using Dean flows and differential migration, Lab Chip, 2008, 8, 1906–1914 RSC.
- D. R. Gossett and D. Di Carlo, Particle focusing mechanisms in curving confined flows, Anal. Chem., 2009, 81, 8459–8465 CrossRef CAS PubMed.
- A. Russom, et al., Differential inertial focusing of particles in curved low-aspect-ratio microchannels, New J. Phys., 2009, 11, 75025 CrossRef PubMed.
- D. H. Yoon, et al., Size-selective separation of micro beads by utilizing secondary flow in a curved rectangular microchannel, Lab Chip, 2009, 9, 87–90 RSC.
- Y. Gou, Y. Jia, P. Wang and C. Sun, Progress of Inertial Microfluidics in Principle and Application, Sensors, 2018, 18, 1762 CrossRef PubMed.
- S. S. Kuntaegowdanahalli, A. A. S. Bhagat, G. Kumar and I. Papautsky, Inertial microfluidics for continuous particle separation in spiral microchannels, Lab Chip, 2009, 9, 2973–2980 RSC.
- S. C. Hur, N. K. Henderson-MacLennan, E. R. B. McCabe and D. Di Carlo, Deformability-based cell classification and enrichment using inertial microfluidics, Lab Chip, 2011, 11, 912–920 RSC.
- A. Karimi, S. Yazdi and A. M. Ardekani, Hydrodynamic mechanisms of cell and particle trapping in microfluidics, Biomicrofluidics, 2013, 7, 21501 CrossRef CAS PubMed.
- P. Rosendahl, et al., Real-time fluorescence and deformability cytometry, Nat. Methods, 2018, 15, 355–358 CrossRef CAS PubMed.
- M. Herbig, A. Mietke, P. Müller and O. Otto, Statistics for real-time deformability cytometry : clustering, dimensionality reduction and significance testing, Biomicrofluidics, 2018, 042214, 1–37 Search PubMed.
- F. Zeng, W. Yang, J. Huang, Y. Chen and Y. Chen, Determination of the lowest concentrations of aldehyde fixatives for completely fixing various cellular structures by real-time imaging and quantification, Histochem. Cell Biol., 2013, 139, 735–749 CrossRef CAS PubMed.
- Y. Gao, M. Pascale, C. Lafforgue, S. Colin and L. Baldas, Inertial lateral migration and self-assembly of particles in bidisperse suspensions in microchannel flows, Microfluid. Nanofluid., 2019, 23, 1613–4982 Search PubMed.
- W. Lee, H. Amini, H. A. Stone and D. Di Carlo, Dynamic self-assembly and control of microfluidic particle crystals, Proc. Natl. Acad. Sci. U. S. A., 2010, 107, 22413–22418 CrossRef CAS PubMed.
- S. Yang, et al., Deformability-selective particle entrainment and separation in a rectangular microchannel using medium viscoelasticity, Soft Matter, 2012, 8, 5011–5019 RSC.
- T. Geislinger, B. Eggart, S. Braunmüller, L. Schmid and T. Franke, Separation of blood cells using hydrodynamic lift, Appl. Phys. Lett., 2012, 100, 183701 CrossRef.
- J. M. Martel and M. Toner, Inertial focusing dynamics in spiral microchannels, Phys. Fluids, 2012, 24, 32001 CrossRef PubMed.
- C. K. W. Tam and W. A. Hyman, Transverse motion of an elastic sphere in a shear field, J. Fluid Mech., 1973, 59, 177–185 CrossRef.
- L. G. Leal, Particle Motions in a Viscous Fluid, Annu. Rev. Fluid Mech., 1980, 12, 435–476 CrossRef.
- S. K. Doddi and P. Bagchi, Lateral migration of a capsule in a plane Poiseuille flow in a channel, Int. J. Multiphase Flow, 2008, 34, 966–986 CrossRef CAS.
- P. C.-H. Chan and L. G. Leal, The motion of a deformable drop in a second-order fluid, J. Fluid Mech., 1979, 92, 131–170 CrossRef.
- M. Abkarian and A. Viallat, Dynamics of Vesicles in a Wall-Bounded Shear Flow, Biophys. J., 2005, 89, 1055–1066 CrossRef CAS PubMed.
- D. A. Fletcher and R. D. Mullins, Cell mechanics and the cytoskeleton, Nature, 2010, 463, 485 CrossRef CAS PubMed.
- P. Isermann and J. Lammerding, Nuclear mechanics and mechanotransduction in health and disease, Curr. Biol., 2013, 23, R1113–R1121 CrossRef CAS PubMed.
- S. Basu, H. M. Campbell, B. N. Dittel and A. Ray, Purification of specific cell population by fluorescence activated cell sorting (FACS), J. Visualized Exp., 2010, 1546, DOI:10.3791/1546.
- A. Cossarizza, et al., Guidelines for the use of flow cytometry and cell sorting in immunological studies (second edition), Eur. J. Immunol., 2019, 49, 1457–1973 CrossRef CAS PubMed.
- B. Sutermaster and E. Darling, Considerations for high-yield, high-throughput cell enrichment: fluorescence versus magnetic sorting, Sci. Rep., 2019, 9, 227 CrossRef PubMed.
- E. Ratcliffe, R. J. Thomas and D. J. Williams, Current understanding and challenges in bioprocessing of stem cell-based therapies for regenerative medicine, Br. Med. Bull., 2011, 100, 137–155 CrossRef PubMed.
- B. Miller, M. Jimenez and H. Bridle, Cascading and Parallelising Curvilinear Inertial Focusing Systems for High Volume, Wide Size Distribution, Separation and Concentration of Particles, 2016, vol. 6, p. 36386 Search PubMed.
Footnotes |
| † Electronic supplementary information (ESI) available. See DOI: 10.1039/c9lc01000a |
| ‡ MJ & HB equally contributed to this work. |
| This journal is © The Royal Society of Chemistry 2020 |